

Bitcoin (BTC) bulls are in no mood to let go of their advantage. They pierced the $70,000 mark on March 11, signaling continued demand from the traders. Bitwise chief investment officer Matt Hougan said in a memo to investors that professional investors were waiting to buy Bitcoin exchange-traded funds (ETFs).
ビットコイン(BTC)の強気派はその優位性を手放す気にはなれない。 3月11日には7万ドルの大台を突破し、トレーダーからの需要が続いていることを示唆した。ビットワイズの最高投資責任者マット・ホーガン氏は投資家向けメモの中で、プロの投資家がビットコイン上場投資信託(ETF)の購入を待っていると述べた。
However, that has not held back the demand for Bitcoin ETFs. According to data from Dune, the spot Bitcoin ETFs have accumulated 4.06% of the current Bitcoin supply. If buying continues at the same rate, Bitcoin holdings of the ETFs are projected to reach 8.65% of the Bitcoin supply on a yearly basis.
しかし、それがビットコインETFの需要を抑制することはなかった。デューンのデータによると、スポットビットコインETFは現在のビットコイン供給量の4.06%を蓄積している。同じペースで買いが続けば、ETFのビットコイン保有量は年間ベースでビットコイン供給量の8.65%に達すると予想される。
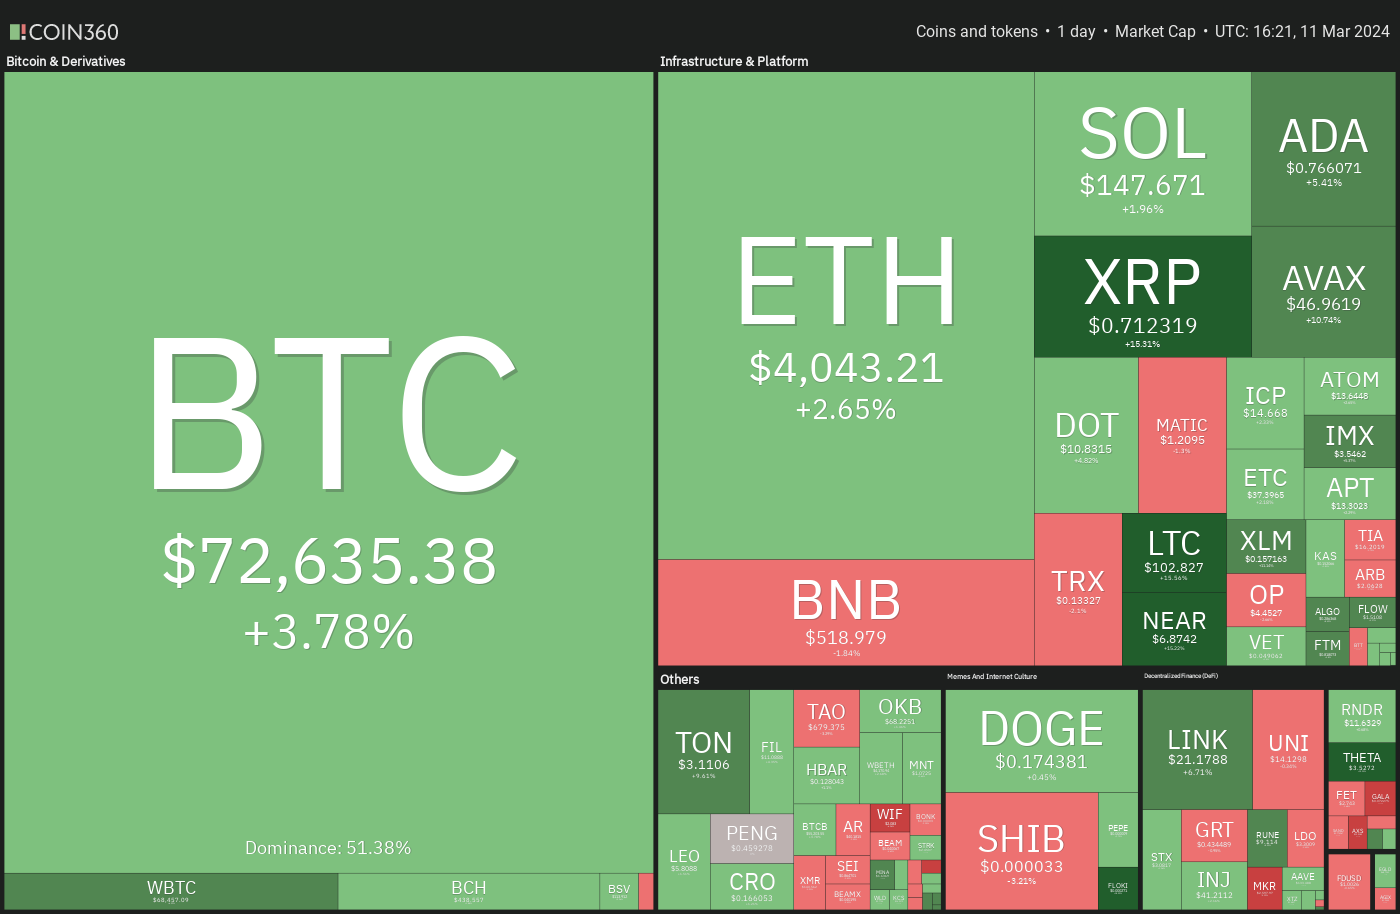
MicroStrategy founder and chairman Michael Saylor said in a X post that the firm had purchased 12,000 Bitcoin at an average price of $68,477, using the proceeds from the recently completed $800 million convertible note offering. After the latest purchase, MicroStrategy’s Bitcoin holdings stand at 205,000 Bitcoin acquired at an average price of $33,706 per Bitcoin.
MicroStrategyの創設者兼会長のマイケル・セイラー氏はXポストで、同社が最近完了した8億ドルの転換社債発行からの収益を使用して、平均価格6万8477ドルで1万2000ビットコインを購入したと述べた。最新の買収後、MicroStrategy のビットコイン保有量は 205,000 ビットコインとなり、1 ビットコインあたりの平均価格は 33,706 ドルで取得されました。
Traders will have to closely watch the Bitcoin ETF inflows because a sustained slowdown will hurt sentiment and may cause a correction. What are the important support levels to watch out for in Bitcoin and altcoins? Let’s analyze the charts to find out.
トレーダーらはビットコインETFの流入を注意深く監視する必要がある。景気減速が続くとセンチメントが悪化し、調整を引き起こす可能性があるためだ。ビットコインとアルトコインで注意すべき重要なサポートレベルは何ですか?チャートを分析して調べてみましょう。
S&P 500 Index price analysis
S&P 500 指数の価格分析
The S&P 500 Index has been rising inside an ascending channel pattern for several days. The price turned down from the resistance line of the channel on March 8, indicating that the bears are defending the level.
S&P 500指数はここ数日間、上昇チャネルパターンの中で上昇している。価格は3月8日のチャネルのレジスタンスラインから下落し、弱気派がその水準を守っていることを示している。
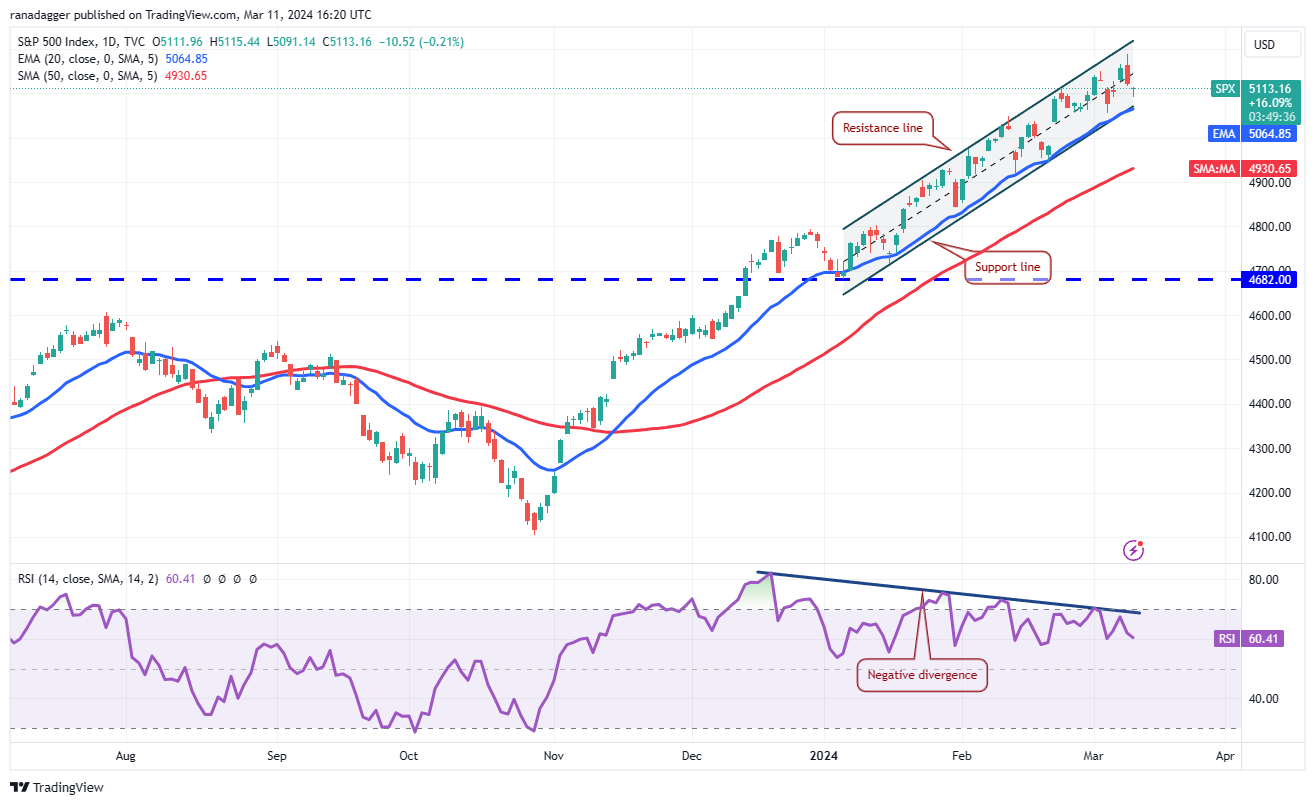
Although the upsloping moving averages indicate an advantage to buyers, the negative divergence on the relative strength index (RSI) cautions of a potential correction or consolidation in the near term. If bears sink the price below the channel, the selling could intensify, and the index may fall to the 50-day simple moving average (4,930).
移動平均線の右肩上がりは買い手に有利であることを示していますが、相対力指数 (RSI) のマイナスの乖離は、短期的に調整または統合の可能性を警告しています。弱気派が価格をチャネルを下回った場合、売りが激化し、指数は50日単純移動平均(4,930)まで下落する可能性がある。
Conversely, if the price turns up from the current level or the channel’s support line, it will indicate that the sentiment remains positive and traders are buying on every minor dip. The bulls will have to kick the price above the channel to start a sharp rally toward 5,350.
逆に、価格が現在のレベルまたはチャネルのサポートラインから上昇した場合は、センチメントが引き続きポジティブであり、トレーダーがあらゆる小さな下落で購入していることを示します。強気派は5,350に向けて急激な上昇を開始するために、価格をチャネルより上に上げなければならないだろう。
U.S. Dollar Index price analysis
米ドルインデックスの価格分析
The U.S.dollar Index (DXY) slipped below the 20-day EMA (103) on March 1, and the bears successfully defended the level during subsequent attempts by the bulls to push the price above it. The failure to rise above the 20-day EMA accelerated selling on March 6.
米ドル指数(DXY)は3月1日に20日間EMA(103)を下回ったが、その後の強気派による価格をその水準より上に押し上げようとする中、弱気派はその水準を守ることに成功した。 20日間EMAを上回れなかったため、3月6日には売りが加速した。
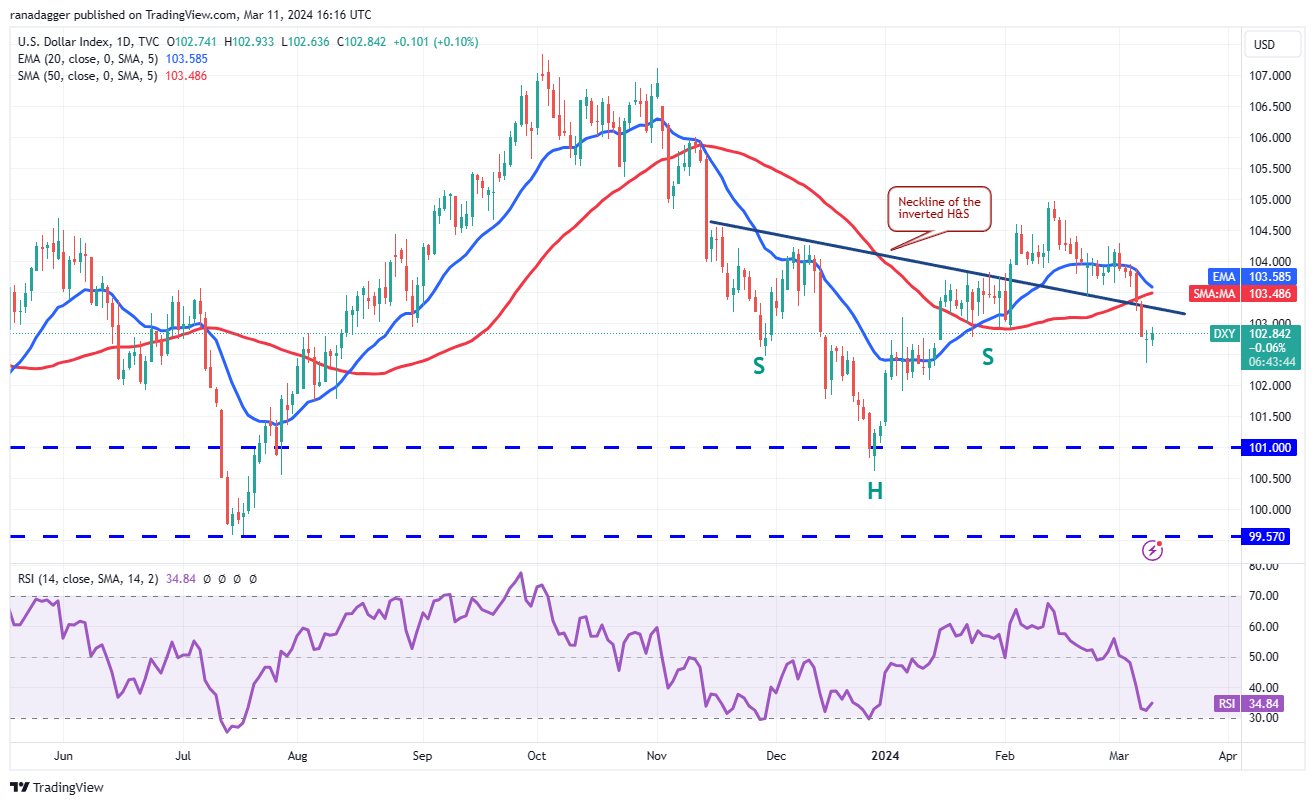
Sellers pulled the price back below the 50-day SMA (103) and the neckline of the inverse head-and-shoulders pattern on March 7. The moving averages are on the verge of a bearish crossover, and the RSI is near the oversold zone, indicating that bears have the edge. The index could skid to 102 and eventually to 101.
売り手は、3月7日の50日間SMA(103)と逆ヘッド・アンド・ショルダー・パターンのネックライン以下に価格を引き下げた。移動平均線は弱気クロスオーバーの瀬戸際にあり、RSIは売られ過ぎゾーンに近い。 、クマが優勢であることを示しています。指数は102まで下落し、最終的には101まで上昇する可能性がある。
Any recovery attempt is likely to face selling at the 20-day EMA. A rise above the 20-day EMA will be the first sign that the selling pressure may be reducing. The index could then rise to 105.
回復を試みても、20日間EMAでは売りに直面する可能性が高い。 20日間EMAを上回る上昇は、売り圧力が低下している可能性があることを示す最初の兆候となるでしょう。その後、同指数は105まで上昇する可能性がある。
Bitcoin price analysis
ビットコイン価格分析
Bitcoin struggled to break above $70,000 during the weekend but blasted above the level on March 11, indicating solid demand from the bulls.
ビットコインは週末に7万ドルを突破するのに苦労したが、3月11日にはその水準を大きく突破し、強気派の堅調な需要を示した。
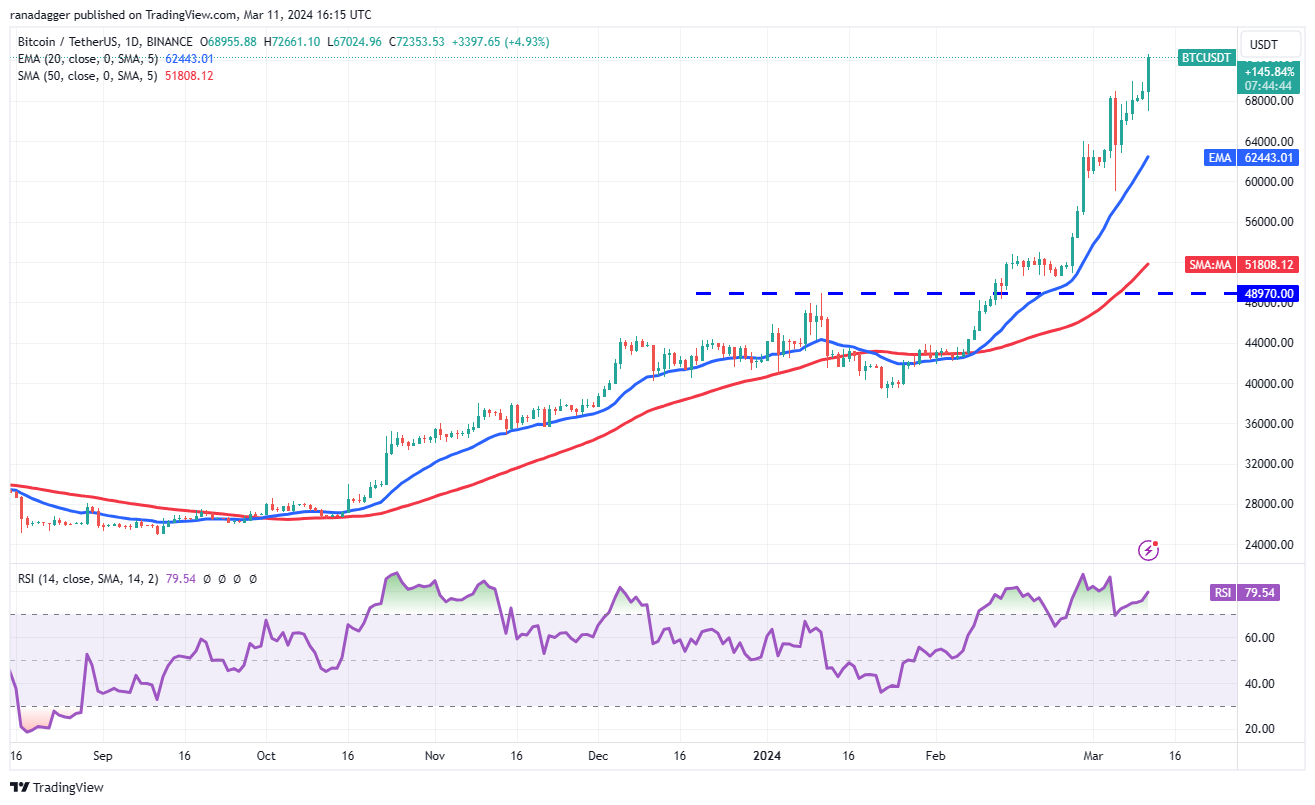
The rising moving averages and the RSI in the overbought zone show that the buyers are in control. The BTC/USDT pair could reach $76,000 and subsequently $80,000. This zone is likely to offer strong resistance to the bulls.
移動平均線の上昇と買われ過ぎゾーンのRSIは、買い手が主導権を握っていることを示しています。 BTC/USDTペアは76,000ドルに達し、その後は80,000ドルに達する可能性があります。このゾーンは強気派にとって強い抵抗となる可能性が高い。
It is difficult to call a top in an asset when it is backed by strong momentum. The first sign of weakness will be a break and close below the 20-day EMA ($62,443). That will signal profit booking by the bulls and may start a deeper pullback.
強い勢いに支えられている資産をトップと呼ぶのは難しい。弱さの最初の兆候はブレイクし、20日間EMA(62,443ドル)を下回って終了することだろう。これは強気派による利益確定のシグナルとなり、より深い反落が始まる可能性がある。
Ether price analysis
イーサ価格分析
The bears tried to pull Ether (ETH) toward the breakout level of $3,600, but the long tail on the March 11 candlestick shows aggressive buying at lower levels.
弱気派はイーサ(ETH)をブレイクアウトレベルの3,600ドルに向けて引っ張ろうとしたが、3月11日のローソク足のロングテールはより低いレベルでの積極的な買いを示している。
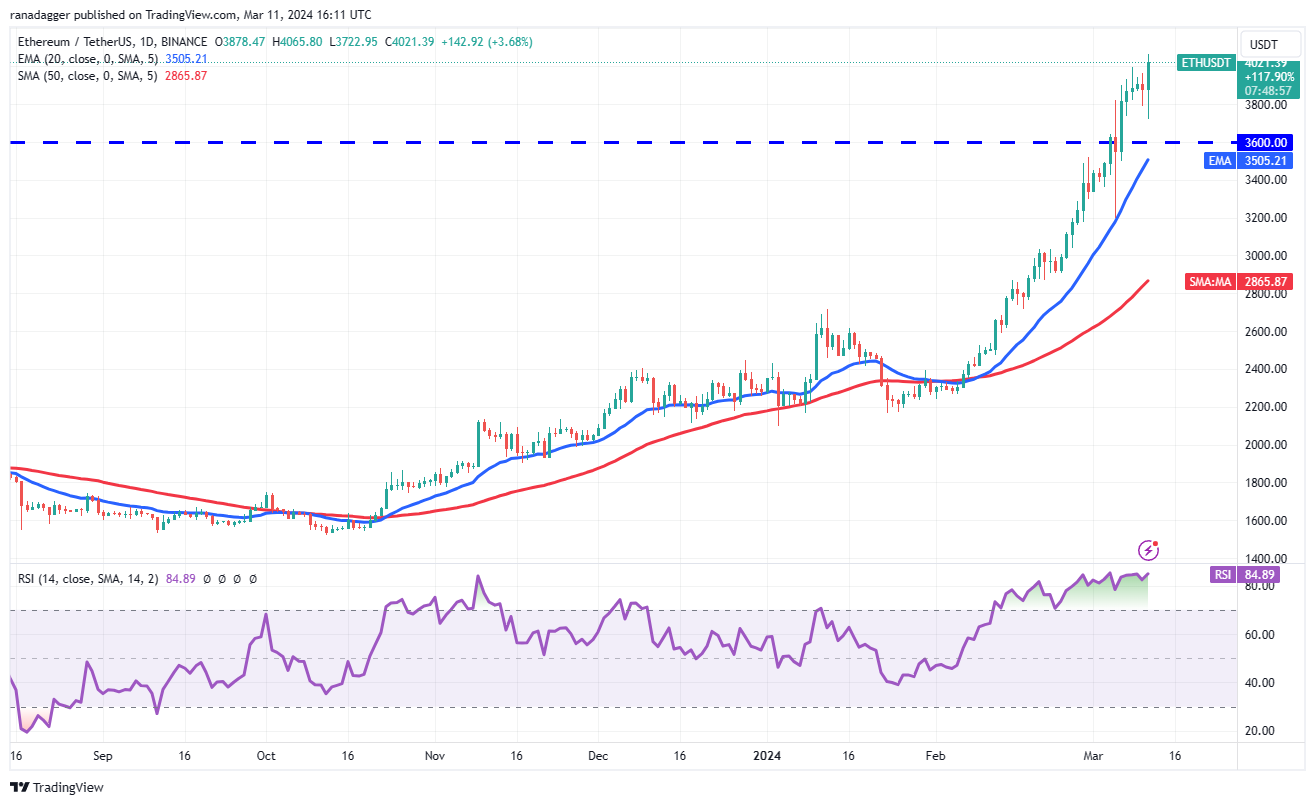
Buyers have pushed the price above the psychological level of $4,000. That opens the doors for a rally to $4,372, which may act as a minor hurdle, but if this resistance is crossed, the ETH/USDT pair could jump to $4,868.
買い手は価格を心理的水準の4000ドルを超えて押し上げている。これにより、4,372ドルへの上昇への扉が開かれ、小さなハードルとなる可能性があるが、この抵抗を越えれば、ETH/USDTペアは4,868ドルまで跳ね上がる可能性がある。
The sharp up move of the past few days has pushed the RSI into deep overbought territory, signaling caution. Sellers will have to drag the price below the 20-day EMA ($3,505) to break the bullish momentum. The pair may then start a corrective phase.
過去数日間の急激な上昇により、RSIは買われ過ぎの領域に深く入り込み、警戒を示している。売り手は強気の勢いを断ち切るために価格を20日間EMA(3,505ドル)以下に引き下げる必要がある。その後、ペアは修正フェーズを開始する可能性があります。
BNB price analysis
BNB価格分析
BNB (BNB) has been in a strong uptrend for several days. The momentum picked up further after buyers pushed the price above $460.
BNB(BNB)はここ数日間強い上昇傾向にあります。買い手が価格を460ドル以上に押し上げたことで、勢いはさらに加速した。
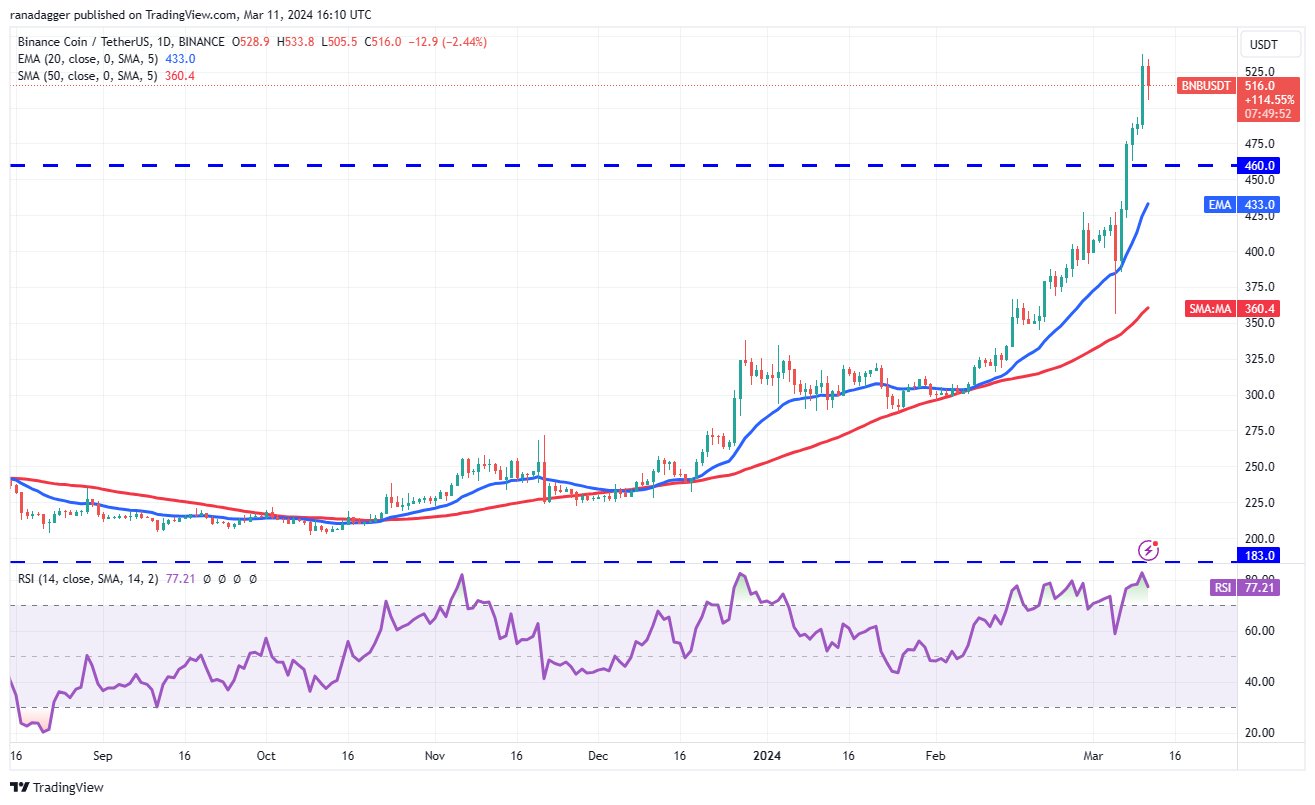
The BNB/USDT pair is likely to reach $560, which may act as a stiff resistance in the short term. If bulls do not give up much ground from $560, the uptrend may continue. The pair may then climb to $617.
BNB/USDTペアは560ドルに達する可能性が高く、短期的には強い抵抗線となる可能性がある。強気派が560ドルから大きく譲歩しなければ、上昇傾向が続く可能性がある。その後、ペアは617ドルまで上昇する可能性がある。
The essential support on the downside is $460, and then the 20-day EMA ($433). Sellers will have to tug the price below the 20-day EMA to indicate that the uptrend may have ended in the short term.
下値の重要なサポートは 460 ドル、そして 20 日間 EMA (433 ドル) です。売り手は、上昇トレンドが短期的に終了した可能性があることを示すために、価格を20日間EMAを下回る水準に引き下げる必要がある。
XRP price analysis
XRP価格分析
Repeated failure of the bears to sustain XRP (XRP) below the 20-day EMA ($0.60) may have attracted buyers on March 11.
弱気派がXRP(XRP)を20日間EMA(0.60ドル)以下に維持することに度重なる失敗をしたことが、3月11日に買い手を引き寄せた可能性がある。
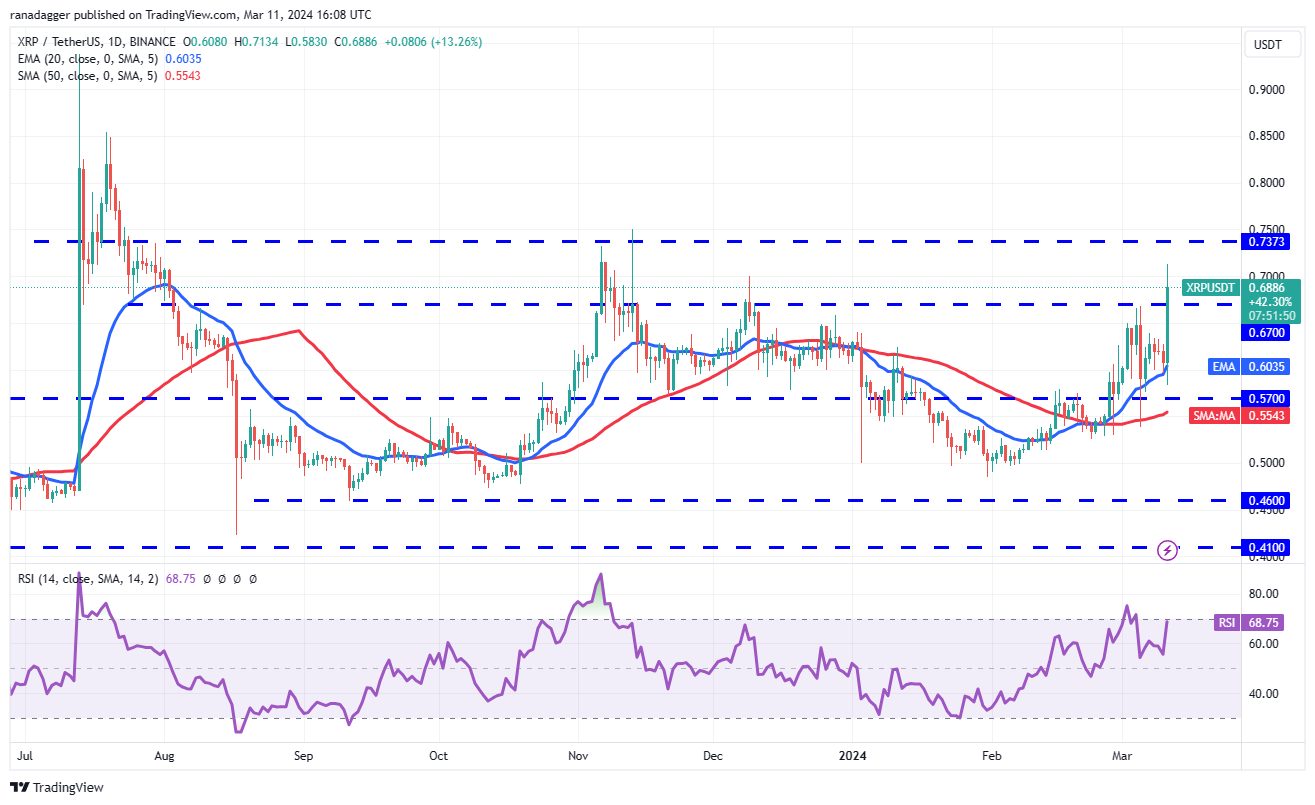
The bulls pushed the price above the immediate resistance of $0.67, indicating solid buying at lower levels. Buyers will try to maintain the momentum and challenge the formidable resistance at $0.74. If this level is scaled, it will indicate the start of a new uptrend. The XRP/USDT pair could rise to $0.85 and subsequently to $0.95.
強気派は価格を目先の抵抗線である0.67ドルを超えて押し上げ、下位レベルでも堅調な買いが入っていることを示した。買い手はこの勢いを維持し、0.74ドルの強力な抵抗に挑戦しようとするだろう。このレベルがスケーリングされる場合、それは新しい上昇トレンドの始まりを示します。 XRP/USDTペアは0.85ドルまで上昇し、その後0.95ドルまで上昇する可能性がある。
Alternatively, if the price turns down from $0.74, it will suggest that the bears remain active at higher levels. The pair may then slide to the strong support at $0.67.
あるいは、価格が0.74ドルから下落した場合は、弱気派が高水準で引き続き活発であることを示唆するだろう。その後、ペアは0.67ドルの強いサポートまで下落する可能性がある。
Solana price analysis
ソラナの価格分析
The bears are trying to start a correction in Solana (SOL), but the bulls are in no mood to relent. The shallow pullback shows a lack of sellers.
弱気派はソラナ(SOL)で調整を始めようとしているが、強気派は折れる気配はない。戻りが浅いのは売り手が不足していることを示している。
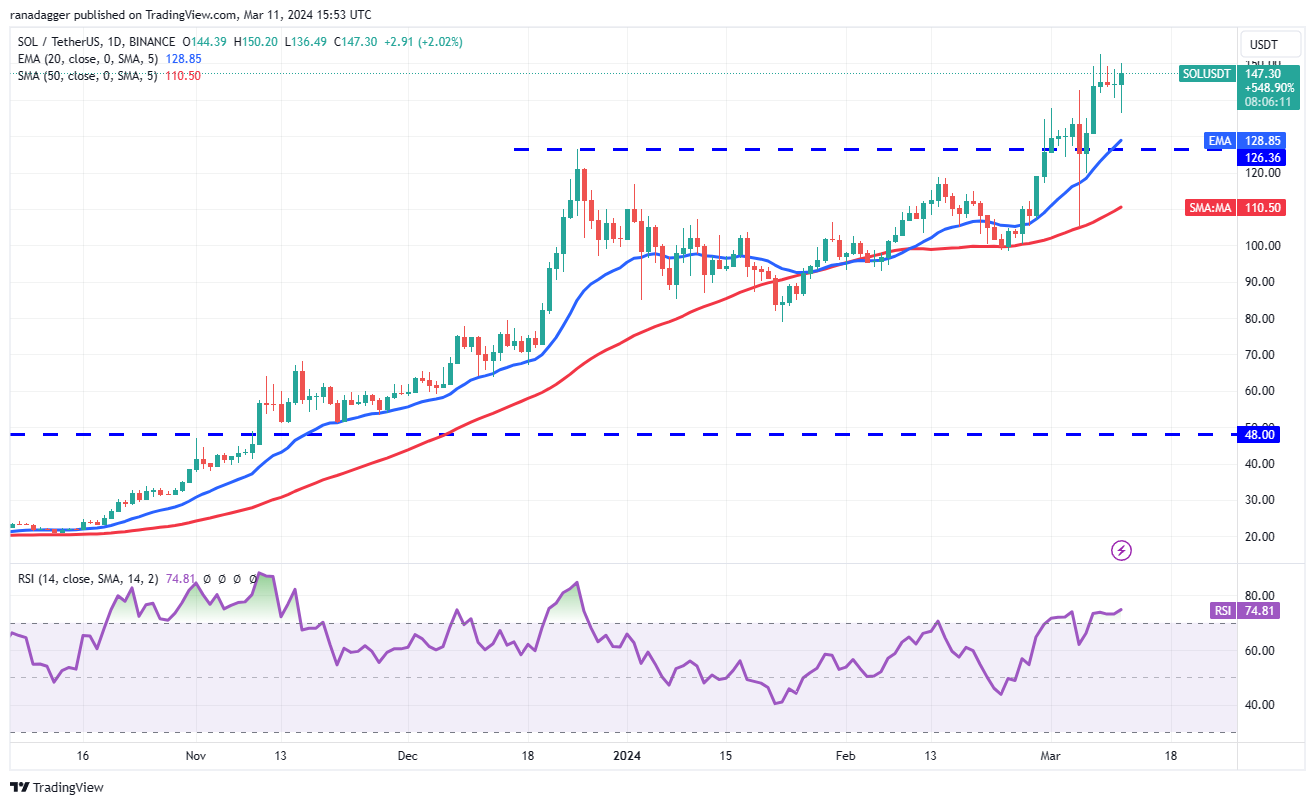
Buyers will take advantage of the situation and try to strengthen their position further by pushing the price above $153. If they do that, the SOL/USDT pair could resume the uptrend. The pair may then climb to $184.
買い手はこの状況を利用し、価格を153ドル以上に押し上げることでポジションをさらに強化しようとするだろう。そうなれば、SOL/USDTペアは上昇トレンドを再開する可能性がある。その後、ペアは184ドルまで上昇する可能性がある。
If bears want to prevent the upside, they will have to quickly yank the price below the breakout level of $126. That may accelerate selling, opening the doors for a drop to the 50-day SMA ($110).
弱気派が上昇を阻止したい場合は、価格をブレイクアウトレベルである126ドル以下に迅速に引き下げる必要がある。そうなれば売りが加速し、50日SMA(110ドル)への下落の扉が開く可能性がある。
Related: Why is Bitcoin price up today?
関連: 今日ビットコインの価格が上昇しているのはなぜですか?
Cardano price analysis
カルダノの価格分析
Cardano (ADA) dipped to the breakout level of $0.68 on March 11, but the long tail on the candlestick shows solid buying at lower levels.
カルダノ(ADA)は3月11日に0.68ドルのブレイクアウトレベルまで下落したが、ローソク足のロングテールはより低いレベルでの堅調な買いを示している。
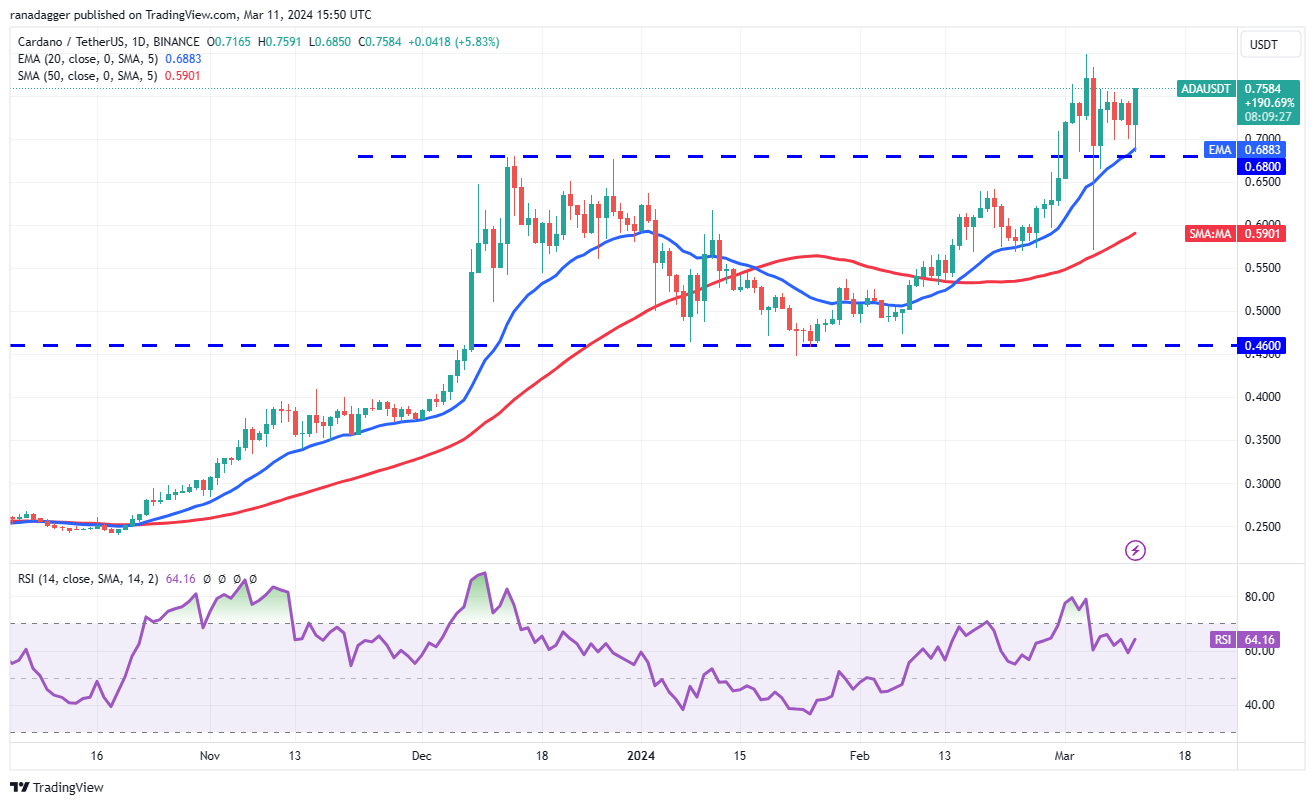
The upsloping 20-day EMA ($0.68) and the RSI in the positive territory suggest that the path of least resistance is to the upside. Buyers will try to propel the price to the March 4 high of $0.80. If this level is surmounted, the ADA/USDT pair could extend the rally to $0.90 and later to $1.25.
20 日間 EMA (0.68 ドル) が右肩上がりで、RSI がプラス圏にあることは、最も抵抗が少ない道は上値に向かうことを示唆しています。買い手は価格を3月4日の高値である0.80ドルまで押し上げようとするだろう。このレベルを超えた場合、ADA/USDTペアは上昇を0.90ドルまで、その後は1.25ドルまで拡大する可能性がある。
This positive view will be invalidated in the near term if the price turns down and breaks below $0.68. That will indicate a comeback by the bears. The pair then risks a fall to the 50-day SMA ($0.59).
価格が下落して0.68ドルを下回れば、この前向きな見方は短期的には無効になるだろう。それは弱気派の巻き返しを示すだろう。その後、このペアは50日間SMA(0.59ドル)まで下落するリスクがある。
Dogecoin price analysis
ドージコインの価格分析
The bulls have been fighting with the bears to keep Dogecoin (DOGE) above the breakout level of $0.16.
強気派はドージコイン(DOGE)をブレイクアウトレベルの0.16ドル以上に維持するために弱気派と戦ってきた。
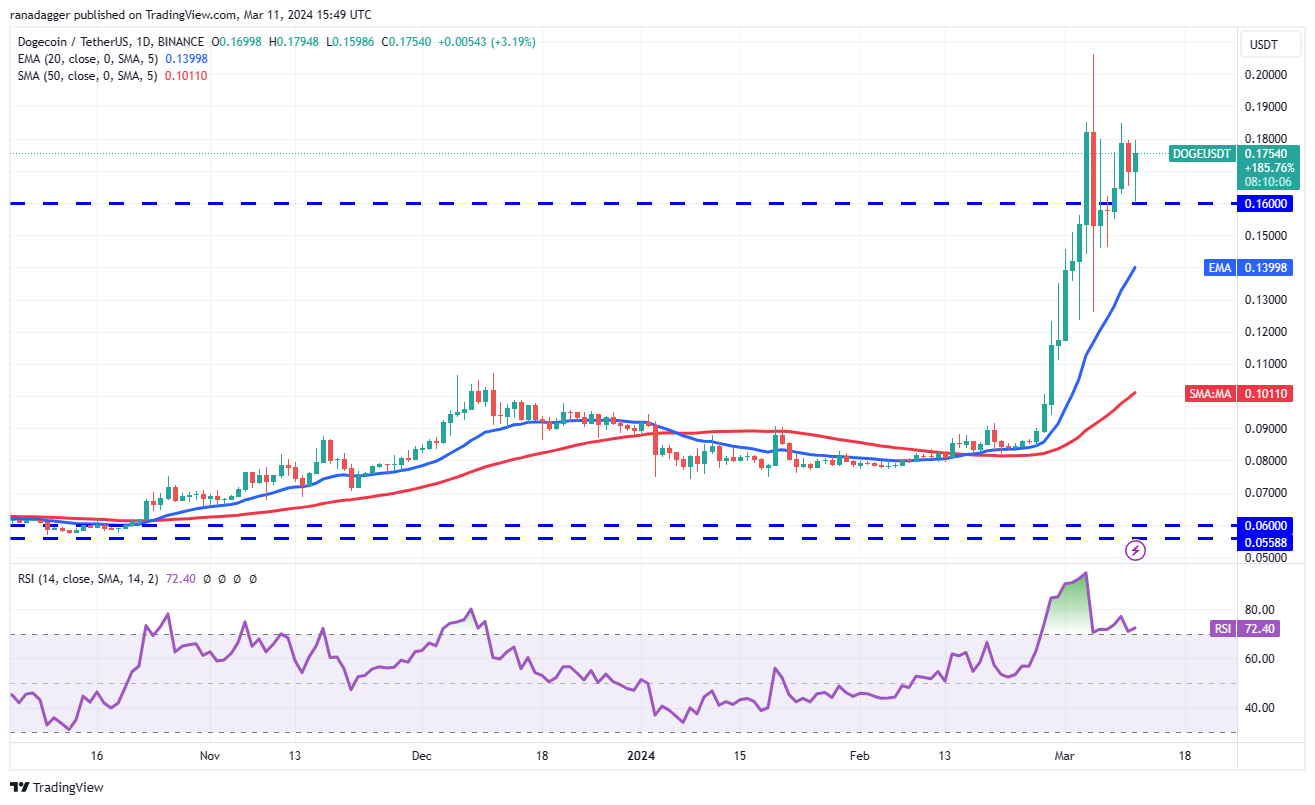
The rising 20-day EMA ($0.14) and the RSI in the overbought zone suggest that the bulls have an edge. If buyers propel and maintain the price above $0.000018, the DOGE/USDT pair could retest $0.21 and then rally to $0.26.
20日間EMA(0.14ドル)の上昇と買われ過ぎゾーンにあるRSIは、強気派が有利であることを示唆している。買い手が価格を0.000018ドル以上に押し上げて維持した場合、DOGE/USDTペアは0.21ドルを再テストし、その後0.26ドルまで上昇する可能性がある。
Contrarily, if the price breaks below $0.16, it will suggest that the bulls have given up. The pair may slump to the 20-day EMA, which remains the critical level to watch out for. A break below this support may start a deeper correction to $0.12.
逆に、価格が0.16ドルを下回った場合、強気派が諦めたことを示唆することになる。ペアは20日間EMAまで下落する可能性があるが、これは依然として注意すべき重要なレベルである。このサポートを下回ると、0.12ドルまでのさらなる調整が始まる可能性がある。
Shiba Inu price analysis
柴犬の価格分析
Shiba Inu (SHIB) has been consolidating inside a large range between $0.000029 and $0.000039 after the sharp rally,
柴犬 (SHIB) は急激な上昇の後、0.000029 ドルから 0.000039 ドルの間の大きな範囲内で値を固めてきました。
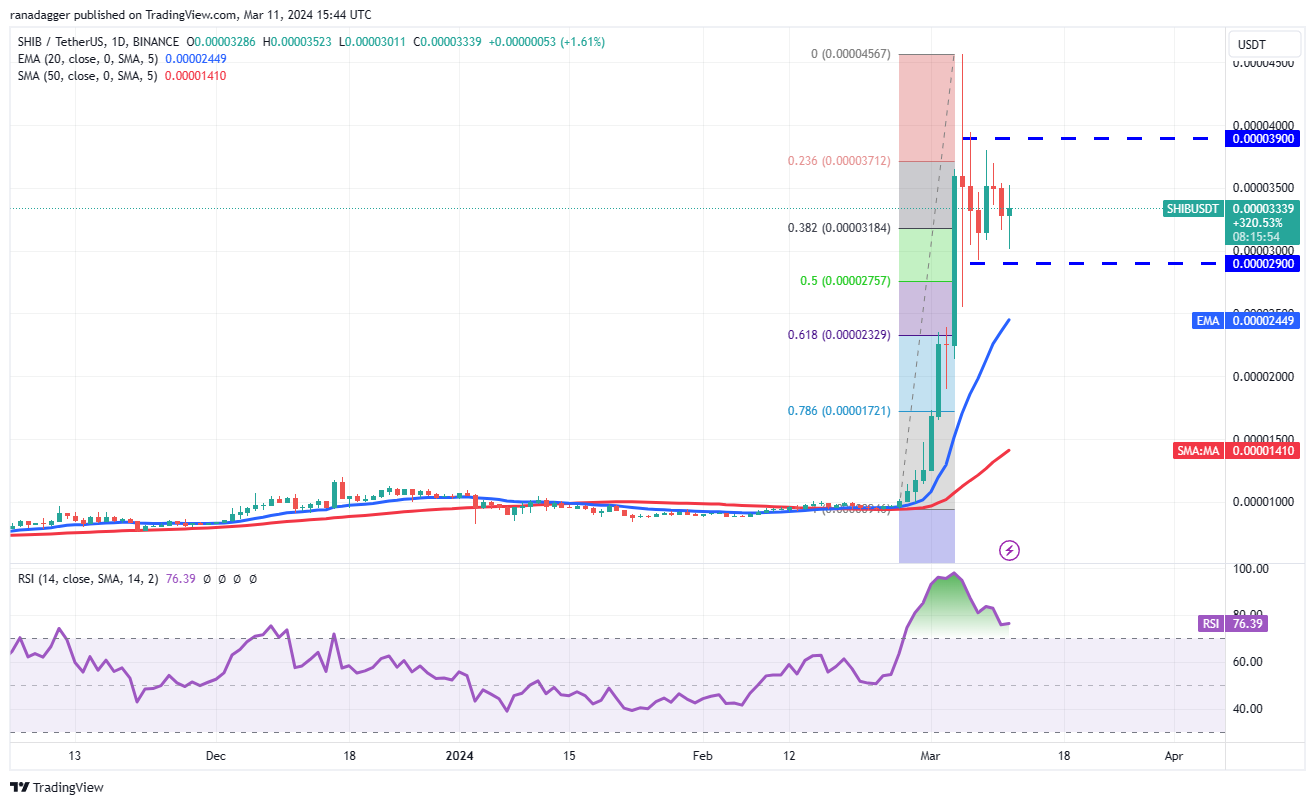
The range-bound action is correcting the deeply overbought levels on the RSI, suggesting that the markets are cooling down. The SHIB/USDT pair may trade inside the range for some more time.
レンジ内での動きはRSIの買われすぎの水準を修正しており、市場が冷え込んでいることを示唆している。 SHIB/USDTペアはしばらくレンジ内で取引される可能性がある。
If the price breaks below the range, the pair could slide to the 20-day EMA ($0.000024), a crucial level to watch out for. A break below this level will tilt the advantage in favor of the bears.
価格がこの範囲を下回った場合、ペアは20日間EMA(0.000024ドル)まで下落する可能性があり、注意すべき重要なレベルです。このレベルを下回ると、優位性は弱気派に有利に傾くでしょう。
On the contrary, a break above $0.000039 will signal that the bulls are back in command. The pair could then rise to $0.000046. If this level is crossed, the rally could reach $0.000065.
逆に、0.000039ドルを超えると、強気派が再び主導権を握ることになります。その後、ペアは0.000046ドルまで上昇する可能性があります。このレベルを超えると、ラリーは0.000065ドルに達する可能性があります。
This article does not contain investment advice or recommendations. Every investment and trading move involves risk, and readers should conduct their own research when making a decision.
この記事には投資に関するアドバイスや推奨事項は含まれません。あらゆる投資や取引の動きにはリスクが伴うため、読者は決定を下す際に独自の調査を行う必要があります。
 DogeHome
 Cryptopolitan_News
 Coin Edition
 BlockchainReporter
 crypto.news
 Crypto Daily™
 BlockchainReporter
 Optimisus


