

Bitcoin (BTC) bulls are in no mood to let go of their advantage. They pierced the $70,000 mark on March 11, signaling continued demand from the traders. Bitwise chief investment officer Matt Hougan said in a memo to investors that professional investors were waiting to buy Bitcoin exchange-traded funds (ETFs).
比特币(BTC)多头无意放弃他们的优势。 3 月 11 日,它们突破了 70,000 美元大关,表明交易员的需求持续增长。 Bitwise 首席投资官 Matt Hougan 在给投资者的一份备忘录中表示,专业投资者正在等待购买比特币交易所交易基金(ETF)。
However, that has not held back the demand for Bitcoin ETFs. According to data from Dune, the spot Bitcoin ETFs have accumulated 4.06% of the current Bitcoin supply. If buying continues at the same rate, Bitcoin holdings of the ETFs are projected to reach 8.65% of the Bitcoin supply on a yearly basis.
然而,这并没有抑制对比特币 ETF 的需求。根据Dune的数据,现货比特币ETF已累计占当前比特币供应量的4.06%。如果继续以同样的速度购买,ETF 的比特币持有量预计将达到每年比特币供应量的 8.65%。
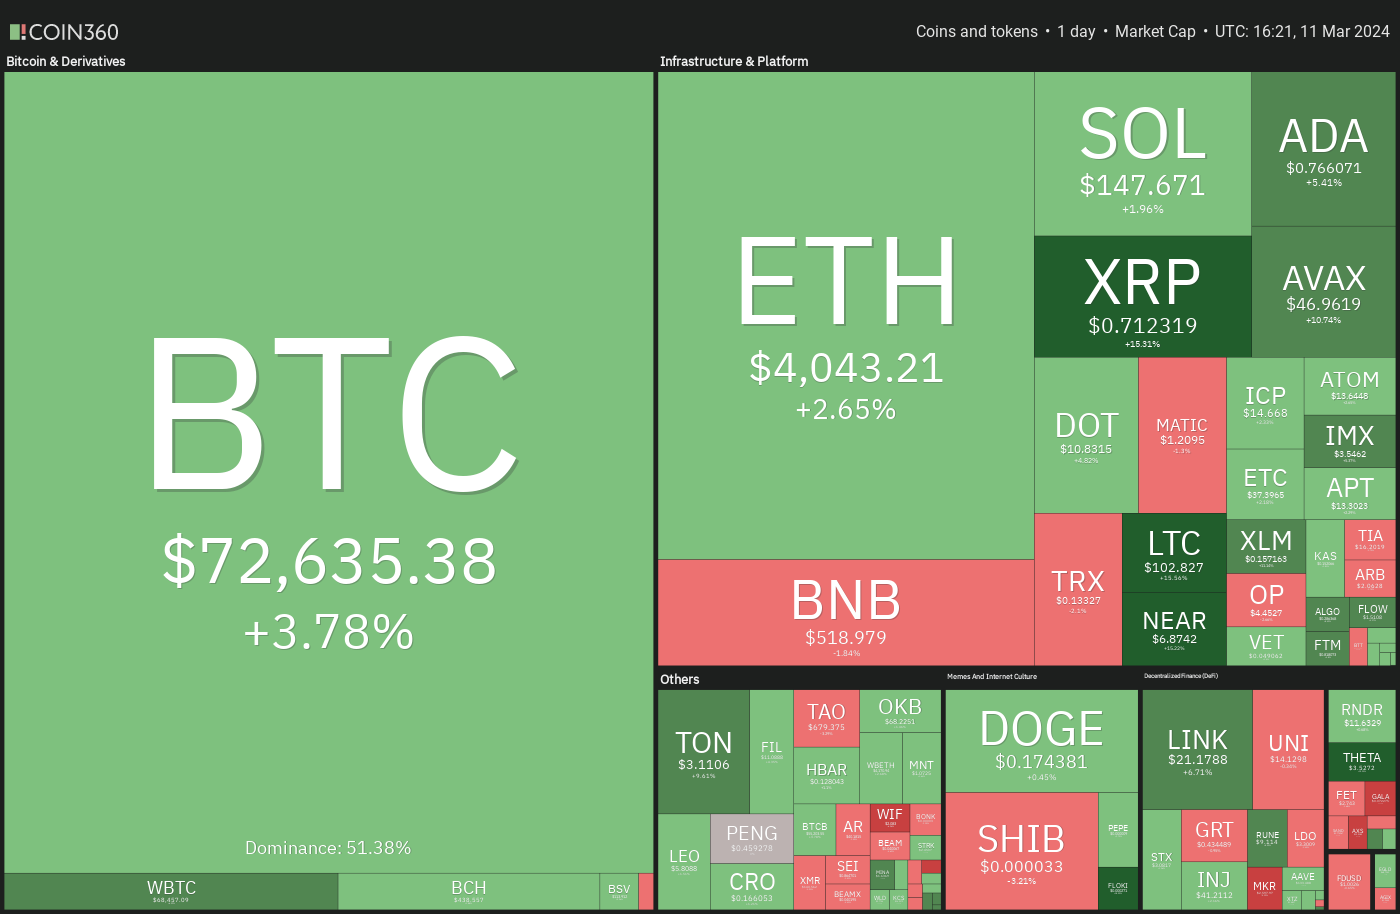
MicroStrategy founder and chairman Michael Saylor said in a X post that the firm had purchased 12,000 Bitcoin at an average price of $68,477, using the proceeds from the recently completed $800 million convertible note offering. After the latest purchase, MicroStrategy’s Bitcoin holdings stand at 205,000 Bitcoin acquired at an average price of $33,706 per Bitcoin.
MicroStrategy 创始人兼董事长 Michael Saylor 在 X 帖子中表示,该公司已使用最近完成的 8 亿美元可转换票据发行的收益,以平均价格 68,477 美元购买了 12,000 枚比特币。最近一次购买后,MicroStrategy 的比特币持有量达到 205,000 个比特币,平均价格为每个比特币 33,706 美元。
Traders will have to closely watch the Bitcoin ETF inflows because a sustained slowdown will hurt sentiment and may cause a correction. What are the important support levels to watch out for in Bitcoin and altcoins? Let’s analyze the charts to find out.
交易者将不得不密切关注比特币 ETF 的流入,因为持续放缓将损害市场情绪并可能导致回调。比特币和山寨币需要注意哪些重要支撑位?让我们分析一下图表来找出答案。
S&P 500 Index price analysis
标准普尔 500 指数价格分析
The S&P 500 Index has been rising inside an ascending channel pattern for several days. The price turned down from the resistance line of the channel on March 8, indicating that the bears are defending the level.
标准普尔 500 指数连续几天在上升通道模式内上涨。价格从 3 月 8 日的通道阻力线转向下跌,表明空头正在捍卫该水平。
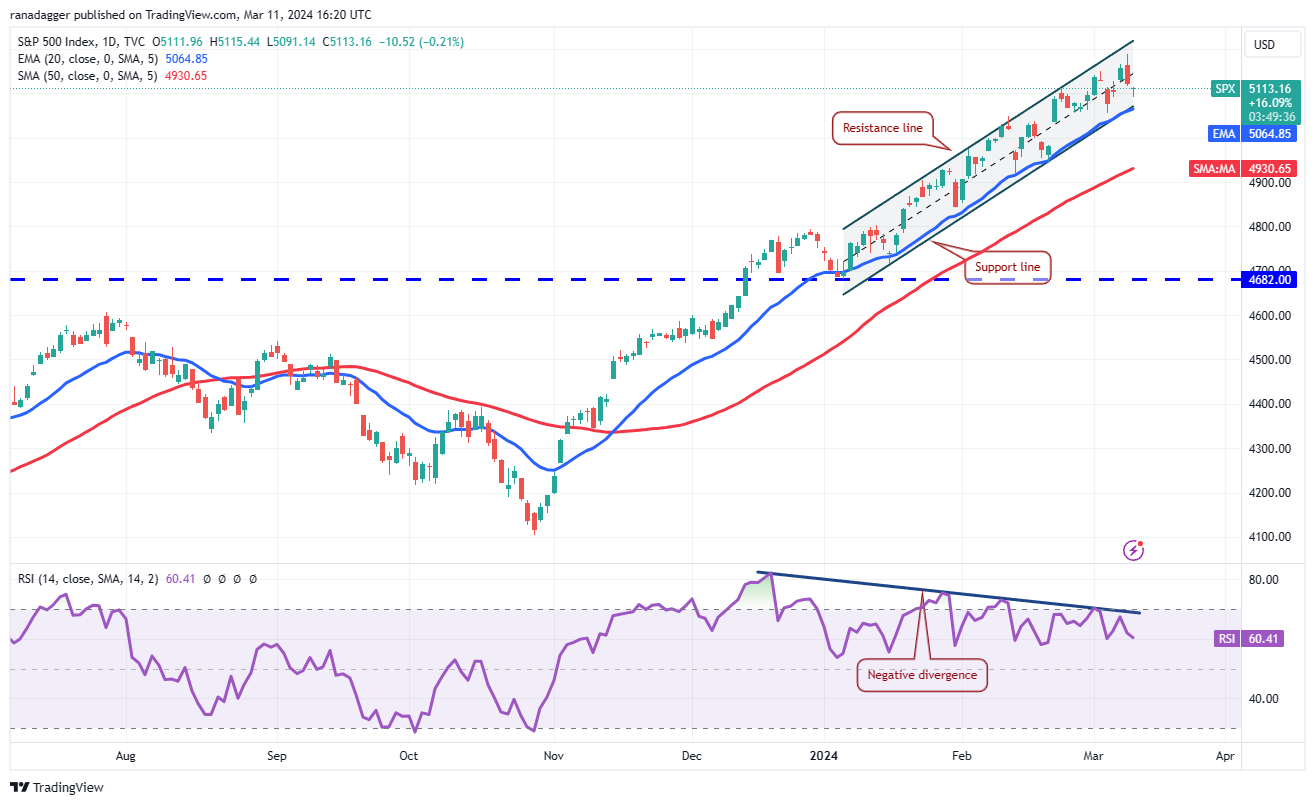
Although the upsloping moving averages indicate an advantage to buyers, the negative divergence on the relative strength index (RSI) cautions of a potential correction or consolidation in the near term. If bears sink the price below the channel, the selling could intensify, and the index may fall to the 50-day simple moving average (4,930).
尽管向上倾斜的移动平均线表明买家有优势,但相对强弱指数(RSI)的负背离警告近期可能出现调整或盘整。如果空头将价格压低至该通道下方,卖盘可能会加剧,指数可能会跌至 50 日简单移动平均线(4,930)。
Conversely, if the price turns up from the current level or the channel’s support line, it will indicate that the sentiment remains positive and traders are buying on every minor dip. The bulls will have to kick the price above the channel to start a sharp rally toward 5,350.
相反,如果价格从当前水平或通道支撑线上涨,则表明市场情绪依然乐观,交易者在每次小幅下跌时买入。多头必须将价格推至通道上方才能开始大幅反弹至 5,350 点。
U.S. Dollar Index price analysis
美元指数价格分析
The U.S.dollar Index (DXY) slipped below the 20-day EMA (103) on March 1, and the bears successfully defended the level during subsequent attempts by the bulls to push the price above it. The failure to rise above the 20-day EMA accelerated selling on March 6.
3 月 1 日,美元指数 (DXY) 跌破 20 日均线 (103),空头在多头随后试图将价格推高至该水平之上时成功守住了该水平。未能突破 20 日均线加速了 3 月 6 日的抛售。
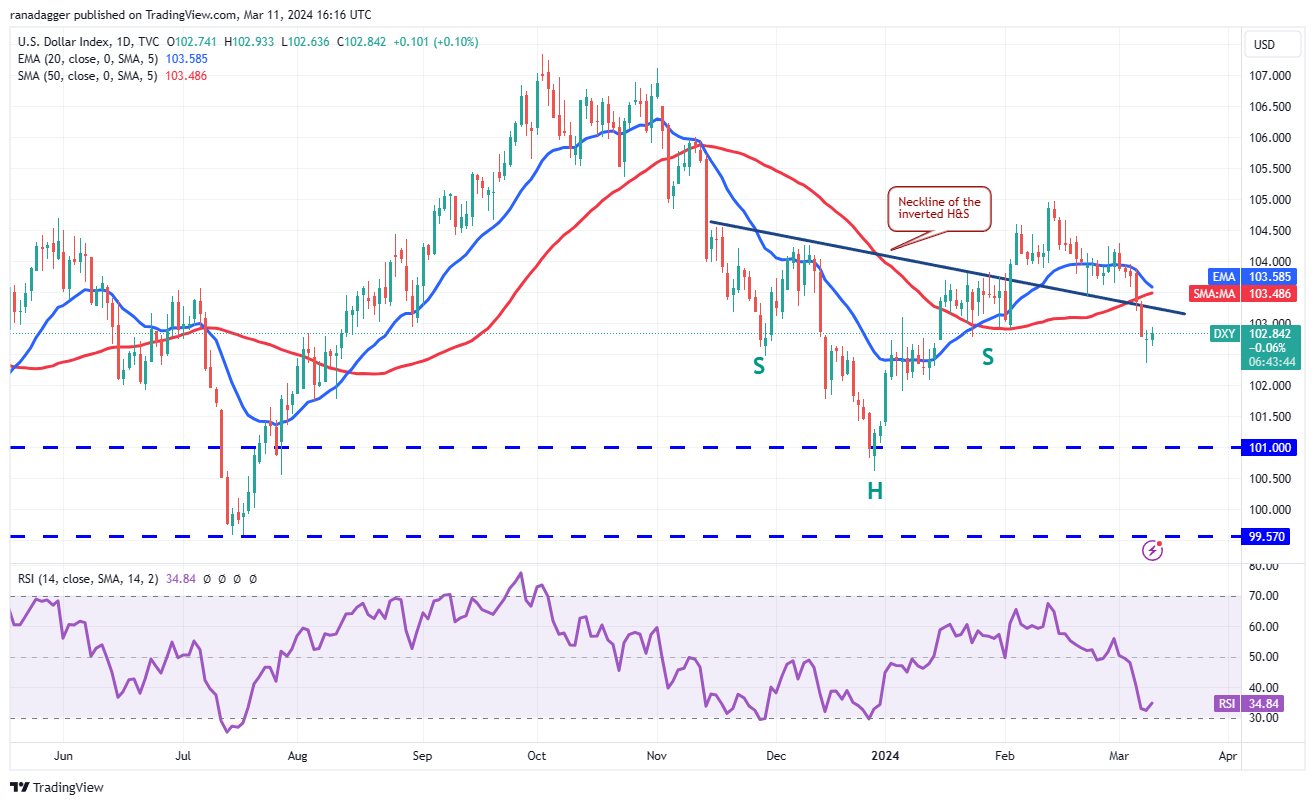
Sellers pulled the price back below the 50-day SMA (103) and the neckline of the inverse head-and-shoulders pattern on March 7. The moving averages are on the verge of a bearish crossover, and the RSI is near the oversold zone, indicating that bears have the edge. The index could skid to 102 and eventually to 101.
卖家将价格拉回到3月7日的50日移动平均线(103)和反向头肩形态的颈线下方。移动平均线处于看跌交叉的边缘,RSI接近超卖区域,表明空头有优势。该指数可能会跌至 102,最终跌至 101。
Any recovery attempt is likely to face selling at the 20-day EMA. A rise above the 20-day EMA will be the first sign that the selling pressure may be reducing. The index could then rise to 105.
任何复苏尝试都可能面临 20 日均线的抛售。升破 20 日均线将是抛售压力可能减轻的第一个迹象。该指数随后可能升至 105。
Bitcoin price analysis
比特币价格分析
Bitcoin struggled to break above $70,000 during the weekend but blasted above the level on March 11, indicating solid demand from the bulls.
比特币周末艰难突破 70,000 美元,但在 3 月 11 日突破该水平,表明多头需求强劲。
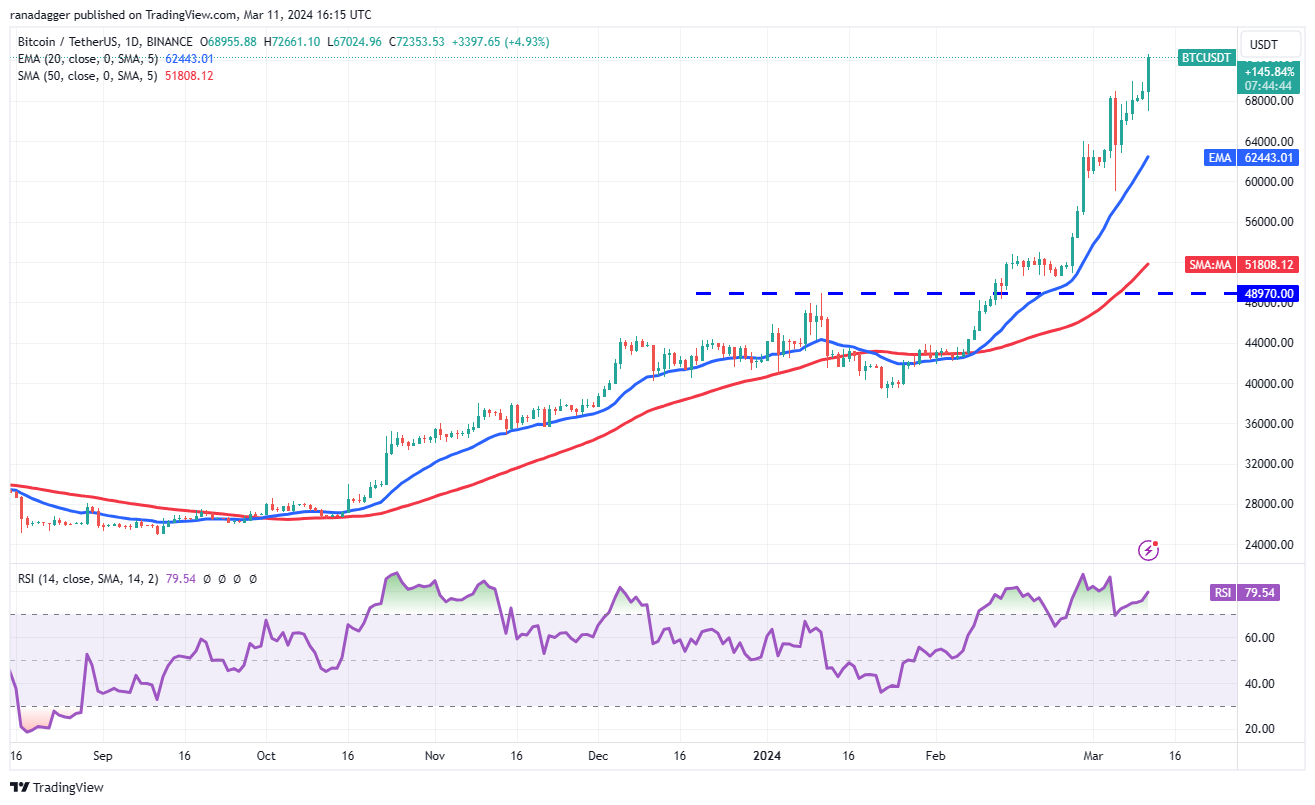
The rising moving averages and the RSI in the overbought zone show that the buyers are in control. The BTC/USDT pair could reach $76,000 and subsequently $80,000. This zone is likely to offer strong resistance to the bulls.
上升的移动平均线和超买区域的 RSI 表明买家处于控制之中。 BTC/USDT 货币对可能会达到 76,000 美元,随后达到 80,000 美元。该区域可能对多头构成强大阻力。
It is difficult to call a top in an asset when it is backed by strong momentum. The first sign of weakness will be a break and close below the 20-day EMA ($62,443). That will signal profit booking by the bulls and may start a deeper pullback.
当一项资产有强劲动能支撑时,很难判断其已见顶。疲软的第一个迹象将是跌破并收于 20 日均线(62,443 美元)下方。这将标志着多头获利了结,并可能开始进一步回调。
Ether price analysis
以太币价格分析
The bears tried to pull Ether (ETH) toward the breakout level of $3,600, but the long tail on the March 11 candlestick shows aggressive buying at lower levels.
空头试图将以太坊 (ETH) 拉向 3,600 美元的突破水平,但 3 月 11 日烛台上的长尾显示出较低水平的激进买盘。
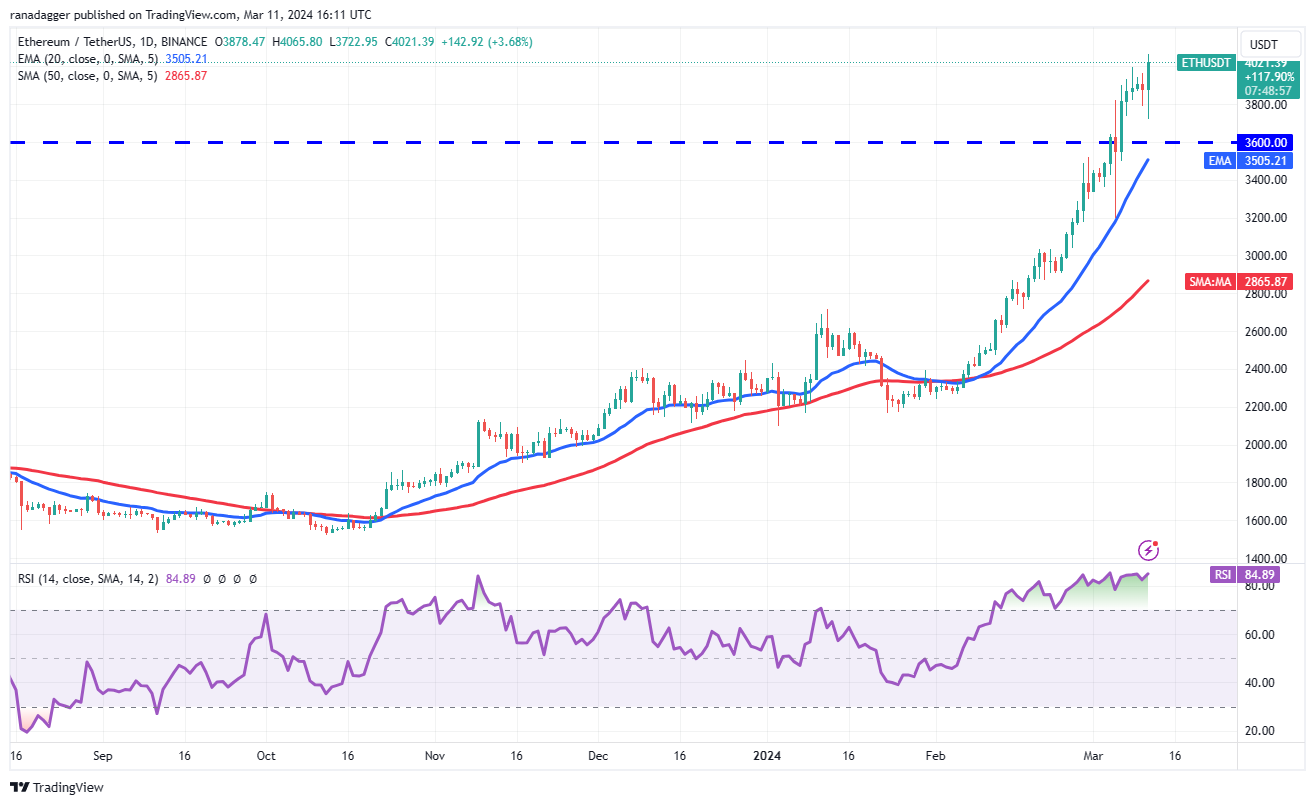
Buyers have pushed the price above the psychological level of $4,000. That opens the doors for a rally to $4,372, which may act as a minor hurdle, but if this resistance is crossed, the ETH/USDT pair could jump to $4,868.
买家已将价格推至 4,000 美元以上的心理价位。这为反弹至 4,372 美元打开了大门,这可能是一个小障碍,但如果突破该阻力位,ETH/USDT 货币对可能会跃升至 4,868 美元。
The sharp up move of the past few days has pushed the RSI into deep overbought territory, signaling caution. Sellers will have to drag the price below the 20-day EMA ($3,505) to break the bullish momentum. The pair may then start a corrective phase.
过去几天的大幅上涨已将 RSI 推入深度超买区域,发出谨慎的信号。卖家必须将价格拖至 20 日均线(3,505 美元)以下才能打破看涨势头。然后,该货币对可能会开始调整阶段。
BNB price analysis
BNB价格分析
BNB (BNB) has been in a strong uptrend for several days. The momentum picked up further after buyers pushed the price above $460.
BNB(BNB)连续几天处于强劲上涨趋势。在买家将价格推高至 460 美元以上后,这一势头进一步增强。
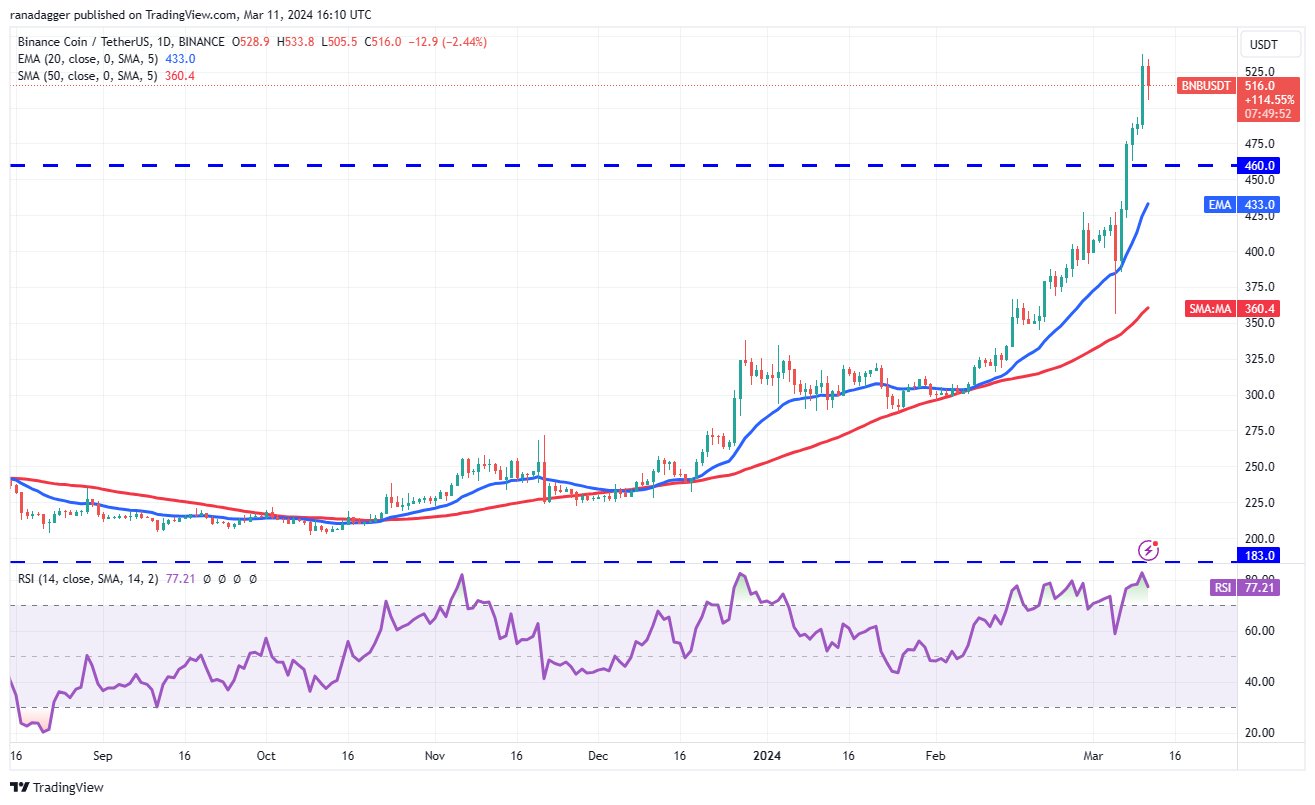
The BNB/USDT pair is likely to reach $560, which may act as a stiff resistance in the short term. If bulls do not give up much ground from $560, the uptrend may continue. The pair may then climb to $617.
BNB/USDT 货币对可能会达到 560 美元,这可能会在短期内成为刚性阻力。如果多头不放弃 560 美元的太多支撑,上升趋势可能会持续。随后该货币对可能会攀升至 617 美元。
The essential support on the downside is $460, and then the 20-day EMA ($433). Sellers will have to tug the price below the 20-day EMA to indicate that the uptrend may have ended in the short term.
下行的重要支撑是 460 美元,然后是 20 日均线(433 美元)。卖家必须将价格拉低至 20 日均线下方,以表明上升趋势可能在短期内结束。
XRP price analysis
瑞波币价格分析
Repeated failure of the bears to sustain XRP (XRP) below the 20-day EMA ($0.60) may have attracted buyers on March 11.
空头多次未能将 XRP (XRP) 维持在 20 日均线(0.60 美元)下方,这可能在 3 月 11 日吸引了买家。
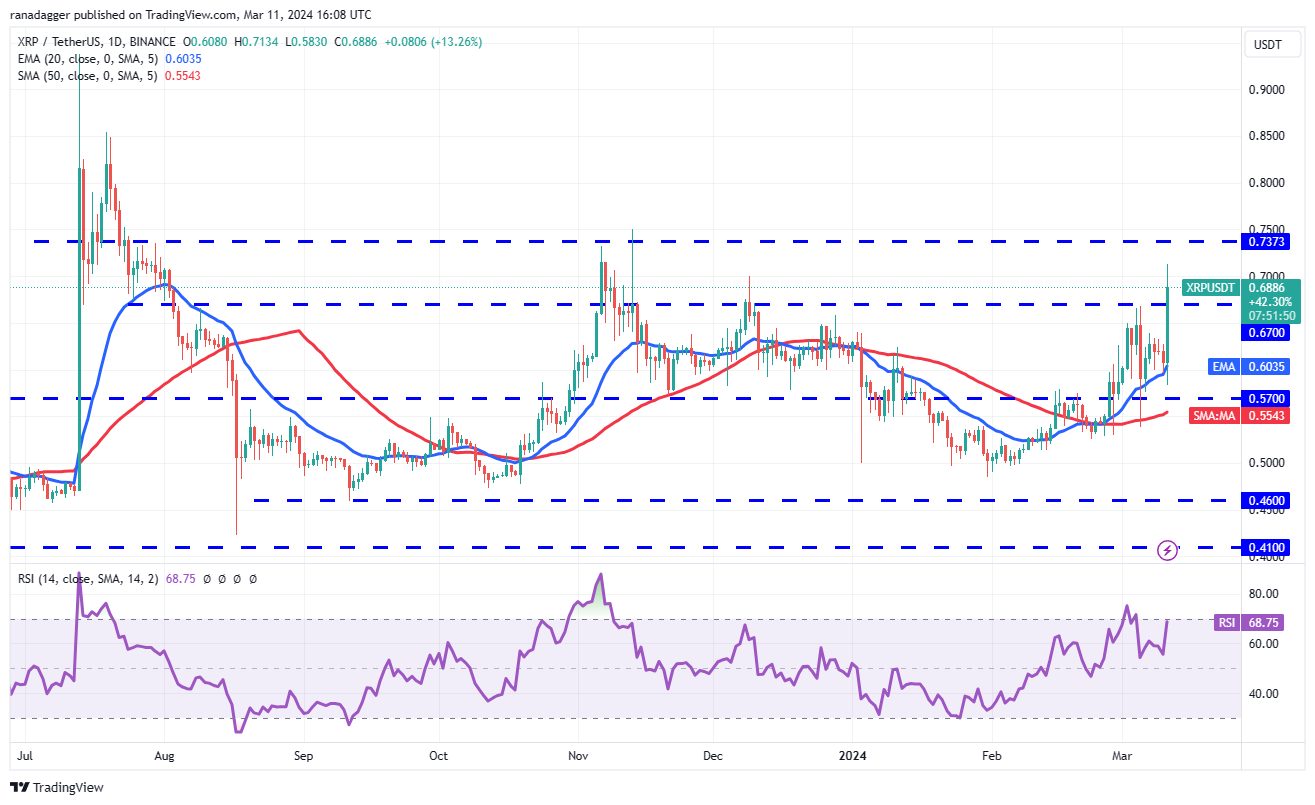
The bulls pushed the price above the immediate resistance of $0.67, indicating solid buying at lower levels. Buyers will try to maintain the momentum and challenge the formidable resistance at $0.74. If this level is scaled, it will indicate the start of a new uptrend. The XRP/USDT pair could rise to $0.85 and subsequently to $0.95.
多头将价格推升至 0.67 美元的直接阻力位之上,表明较低水平的买盘强劲。买家将努力保持势头并挑战 0.74 美元的强大阻力位。如果突破该水平,则表明新的上升趋势的开始。 XRP/USDT 货币对可能会升至 0.85 美元,随后升至 0.95 美元。
Alternatively, if the price turns down from $0.74, it will suggest that the bears remain active at higher levels. The pair may then slide to the strong support at $0.67.
或者,如果价格从 0.74 美元下跌,则表明空头在较高水平上仍然活跃。随后该货币对可能会滑向 0.67 美元的强支撑位。
Solana price analysis
Solana 价格分析
The bears are trying to start a correction in Solana (SOL), but the bulls are in no mood to relent. The shallow pullback shows a lack of sellers.
空头正试图开始 Solana (SOL) 的调整,但多头却没有心情放松。小幅回调表明缺乏卖家。
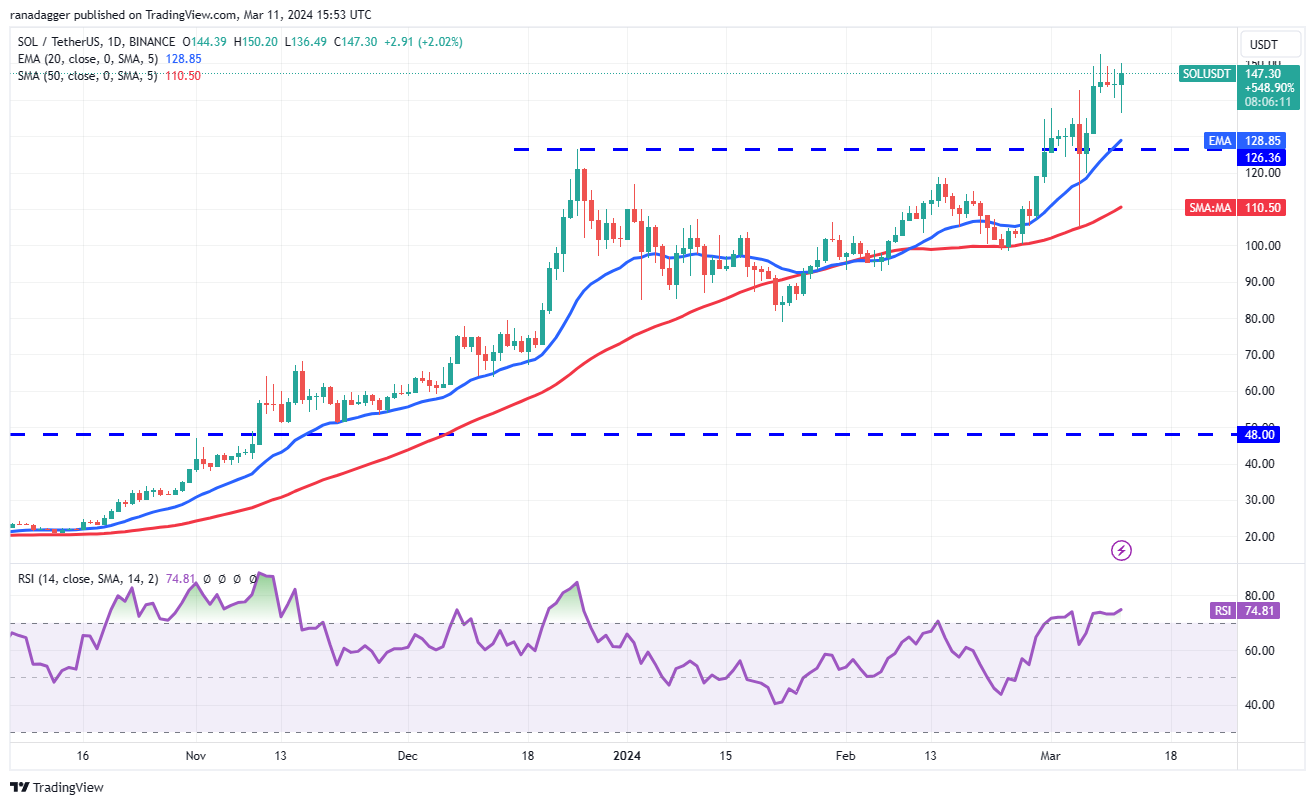
Buyers will take advantage of the situation and try to strengthen their position further by pushing the price above $153. If they do that, the SOL/USDT pair could resume the uptrend. The pair may then climb to $184.
买家将利用这种情况,试图通过将价格推高至 153 美元以上来进一步巩固自己的地位。如果他们这样做,SOL/USDT 货币对可能会恢复上升趋势。随后该货币对可能会攀升至 184 美元。
If bears want to prevent the upside, they will have to quickly yank the price below the breakout level of $126. That may accelerate selling, opening the doors for a drop to the 50-day SMA ($110).
如果空头想要阻止上涨,他们将不得不迅速将价格拉至 126 美元的突破位以下。这可能会加速抛售,为跌至 50 日移动平均线(110 美元)打开大门。
Related: Why is Bitcoin price up today?
相关:为什么今天比特币价格上涨?
Cardano price analysis
卡尔达诺价格分析
Cardano (ADA) dipped to the breakout level of $0.68 on March 11, but the long tail on the candlestick shows solid buying at lower levels.
卡尔达诺 (ADA) 于 3 月 11 日跌至 0.68 美元的突破水平,但烛台上的长尾显示较低水平的强劲买盘。
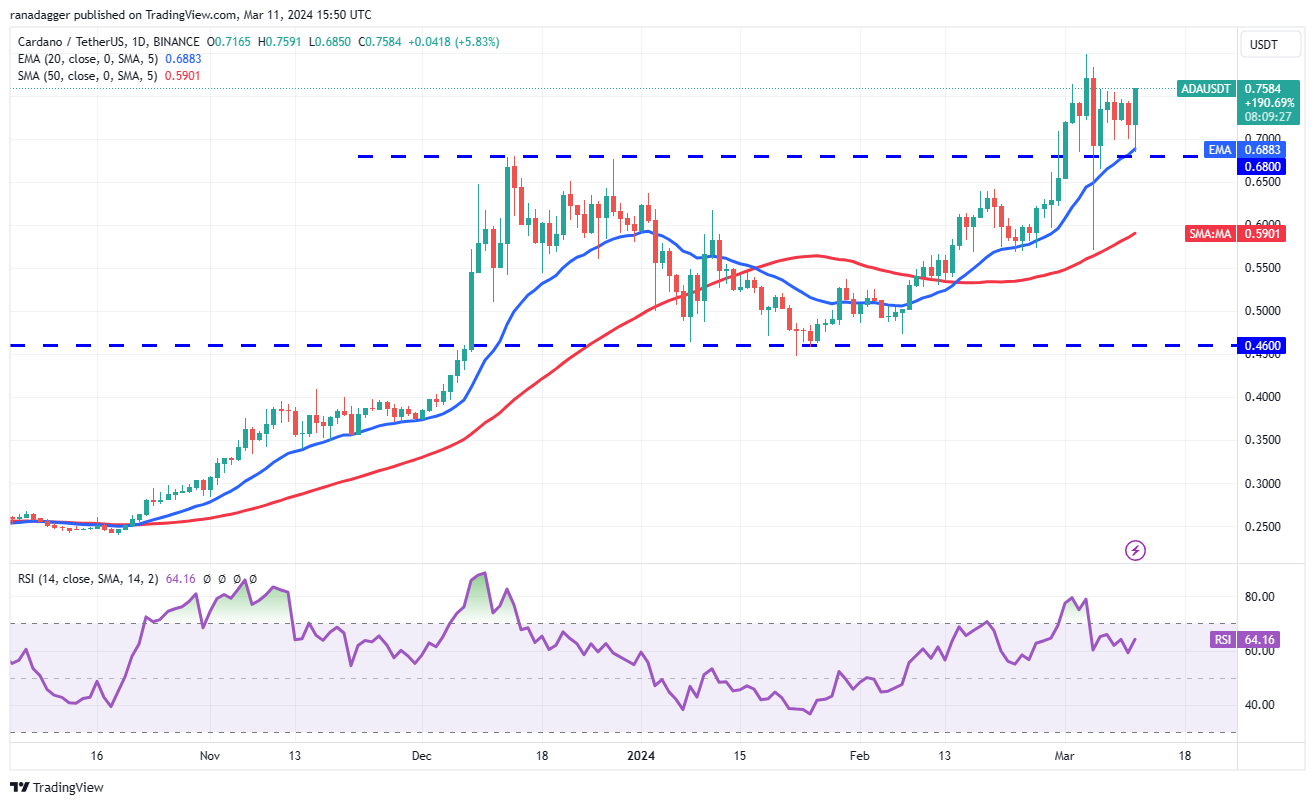
The upsloping 20-day EMA ($0.68) and the RSI in the positive territory suggest that the path of least resistance is to the upside. Buyers will try to propel the price to the March 4 high of $0.80. If this level is surmounted, the ADA/USDT pair could extend the rally to $0.90 and later to $1.25.
上升的 20 日均线(0.68 美元)和 RSI 处于正值区域表明阻力最小的路径是上行。买家将试图将价格推高至 3 月 4 日的高点 0.80 美元。如果突破该水平,ADA/USDT 货币对可能会将涨势扩大至 0.90 美元,随后升至 1.25 美元。
This positive view will be invalidated in the near term if the price turns down and breaks below $0.68. That will indicate a comeback by the bears. The pair then risks a fall to the 50-day SMA ($0.59).
如果价格下跌并跌破 0.68 美元,这种积极观点将在短期内失效。这将表明空头将卷土重来。随后该货币对可能会跌至 50 日移动平均线(0.59 美元)。
Dogecoin price analysis
狗狗币价格分析
The bulls have been fighting with the bears to keep Dogecoin (DOGE) above the breakout level of $0.16.
多头一直在与空头战斗,以将狗狗币 (DOGE) 保持在 0.16 美元的突破水平之上。
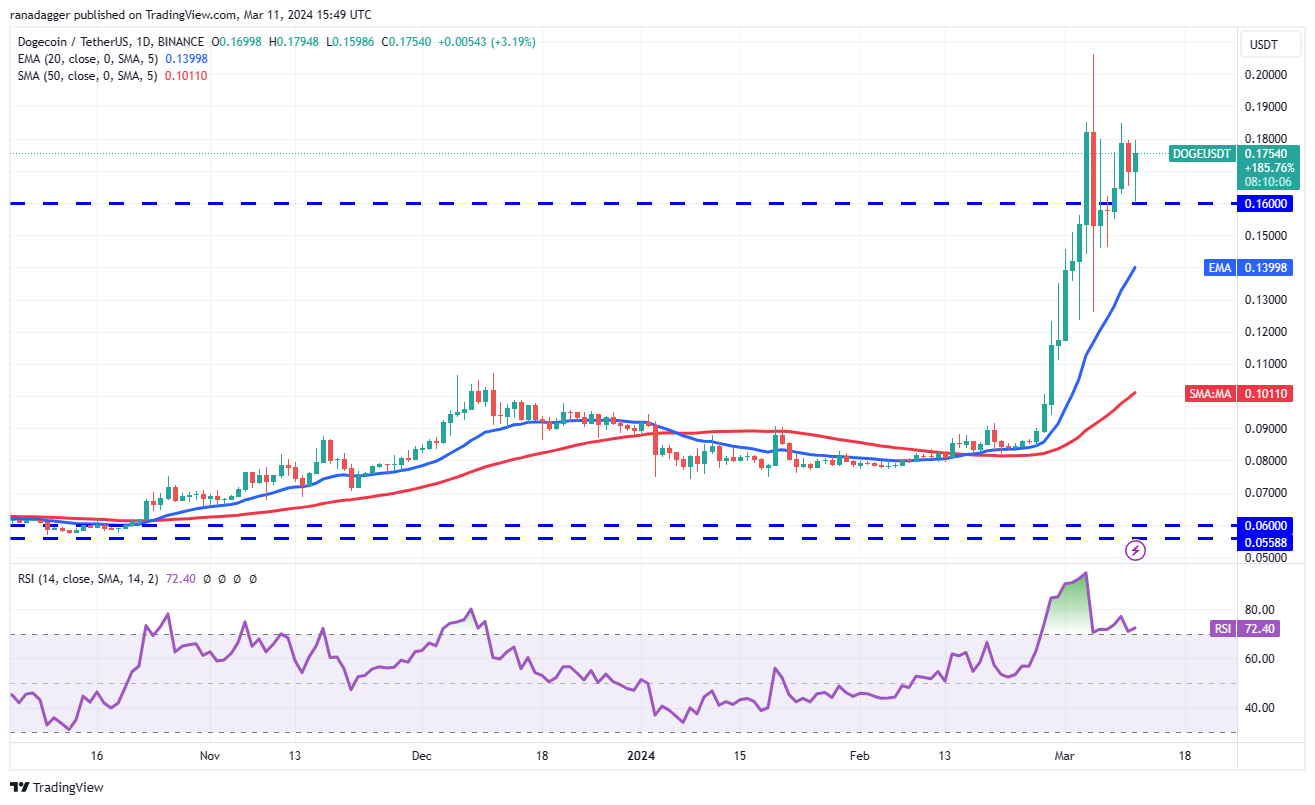
The rising 20-day EMA ($0.14) and the RSI in the overbought zone suggest that the bulls have an edge. If buyers propel and maintain the price above $0.000018, the DOGE/USDT pair could retest $0.21 and then rally to $0.26.
不断上涨的 20 日均线(0.14 美元)和超买区域的 RSI 表明多头具有优势。如果买家推动并维持价格高于 0.000018 美元,DOGE/USDT 货币对可能会重新测试 0.21 美元,然后反弹至 0.26 美元。
Contrarily, if the price breaks below $0.16, it will suggest that the bulls have given up. The pair may slump to the 20-day EMA, which remains the critical level to watch out for. A break below this support may start a deeper correction to $0.12.
相反,如果价格跌破0.16美元,则表明多头已经放弃。该货币对可能会跌至 20 日均线,这仍然是值得关注的关键水平。跌破该支撑位可能会开始更深的回调至 0.12 美元。
Shiba Inu price analysis
柴犬价格分析
Shiba Inu (SHIB) has been consolidating inside a large range between $0.000029 and $0.000039 after the sharp rally,
柴犬 (SHIB) 在大幅上涨后一直在 0.000029 美元至 0.000039 美元之间的大范围内盘整,
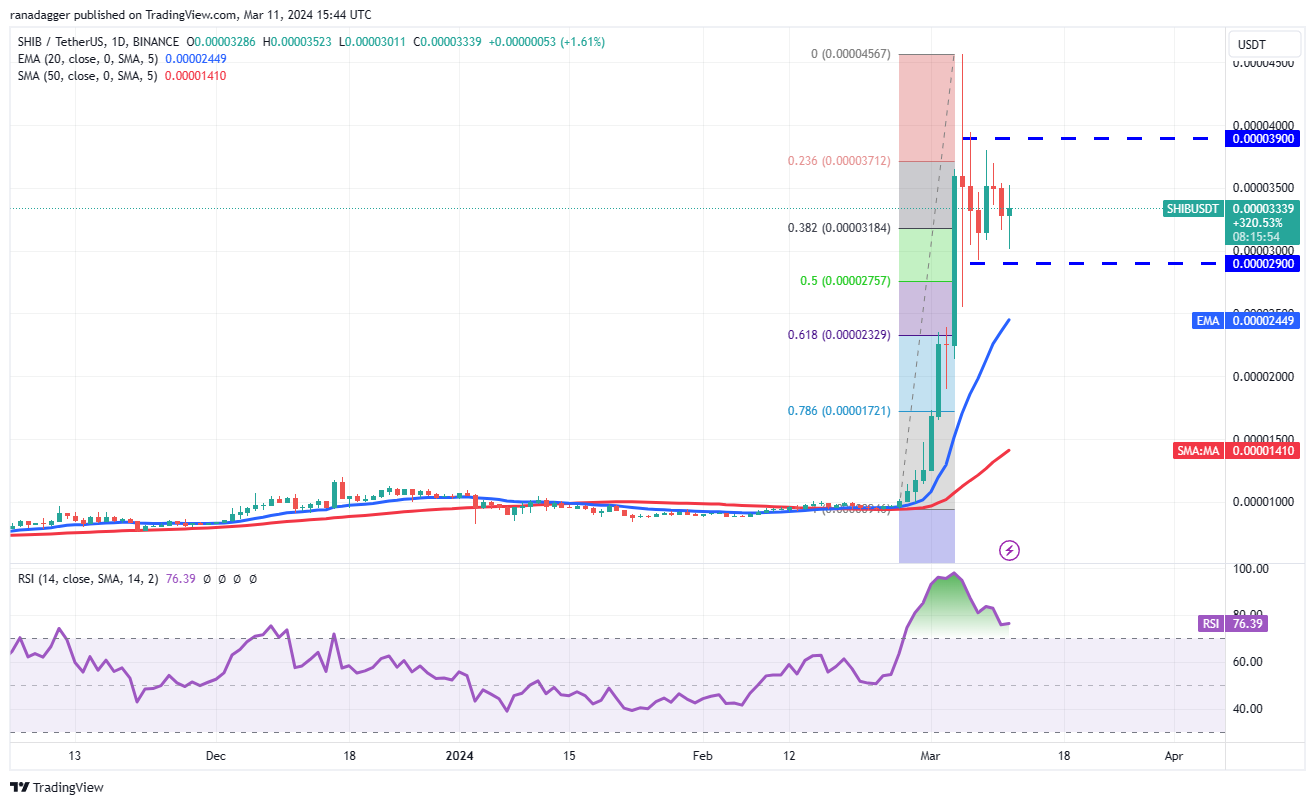
The range-bound action is correcting the deeply overbought levels on the RSI, suggesting that the markets are cooling down. The SHIB/USDT pair may trade inside the range for some more time.
区间波动正在修正 RSI 的深度超买水平,表明市场正在降温。 SHIB/USDT 货币对可能会在该区间内交易一段时间。
If the price breaks below the range, the pair could slide to the 20-day EMA ($0.000024), a crucial level to watch out for. A break below this level will tilt the advantage in favor of the bears.
如果价格跌破该区间,该货币对可能会滑向 20 日均线(0.000024 美元),这是一个值得关注的关键水平。跌破该水平将使优势向空头倾斜。
On the contrary, a break above $0.000039 will signal that the bulls are back in command. The pair could then rise to $0.000046. If this level is crossed, the rally could reach $0.000065.
相反,突破 0.000039 美元将表明多头重新占据主导地位。随后该货币对可能会升至 0.000046 美元。如果突破该水平,反弹可能达到 0.000065 美元。
This article does not contain investment advice or recommendations. Every investment and trading move involves risk, and readers should conduct their own research when making a decision.
本文不包含投资建议或建议。每一项投资和交易行为都涉及风险,读者在做出决定时应自行研究。
 DogeHome
 Cryptopolitan_News
 Coin Edition
 BlockchainReporter
 crypto.news
 Crypto Daily™
 BlockchainReporter
 Optimisus


