

Technical analysis is an essential tool for investors in the cryptocurrency market, especially those who trade in the futures market. So, what does technical analysis tell us about Dogecoin, which is currently trading at $0.07606? Let’s delve into a detailed chart analysis, examining important support and resistance levels.
Dogecoin Daily Chart Analysis
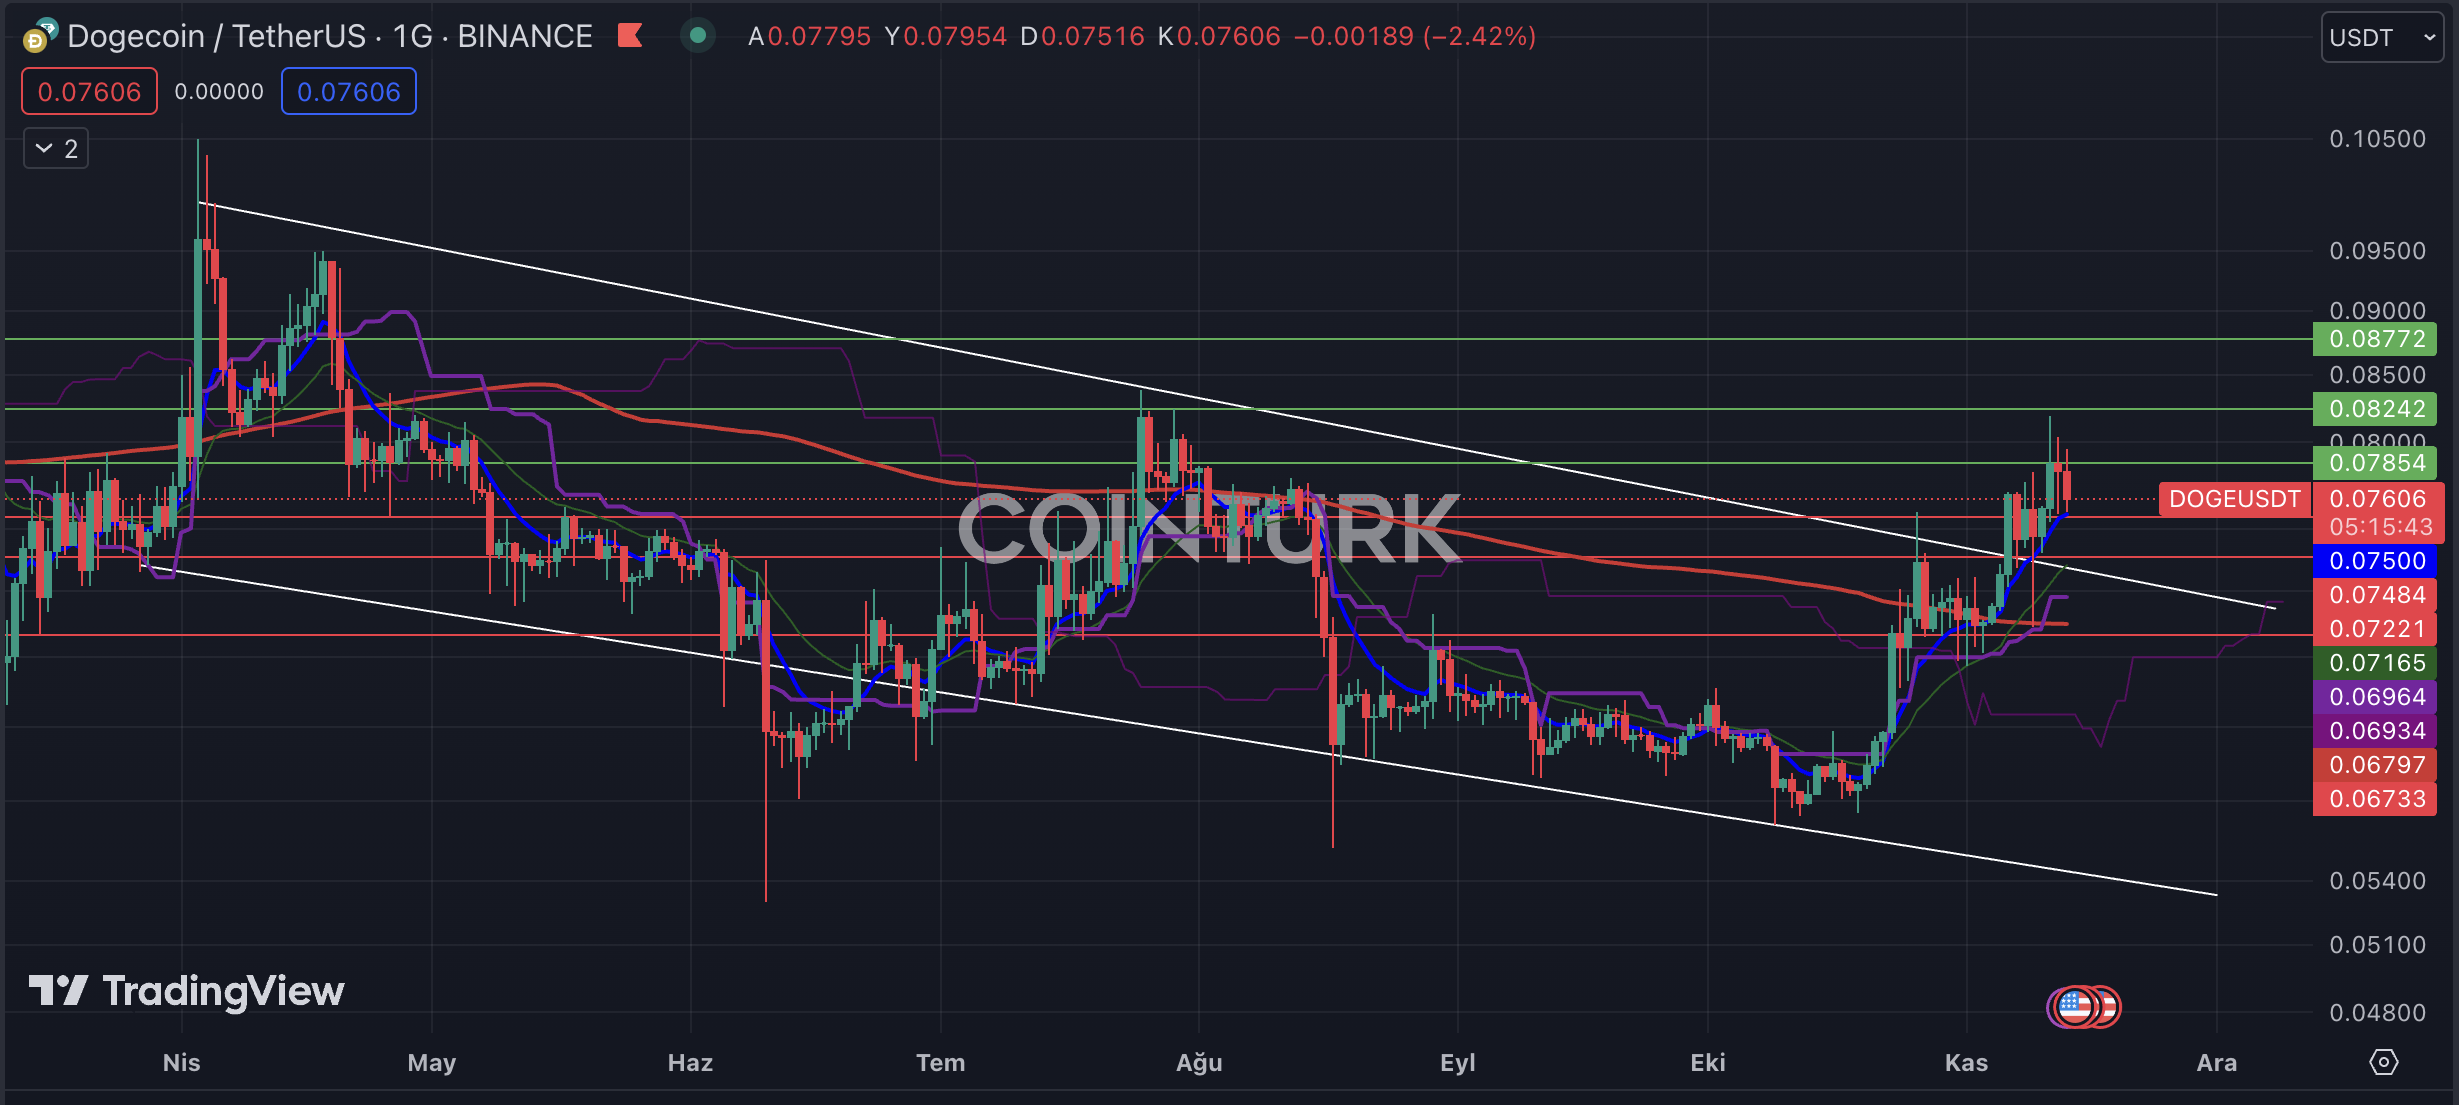
The first notable formation on the daily chart of Dogecoin is a descending channel pattern. This structure was surpassed when the resistance line was broken during the recent uptrend. Despite the dominance of selling pressure today, this formation may lead to a positive trend in the future.
The crucial support levels to watch for DOGE on the daily chart are $0.07484, $0.07221, and $0.06733. If the daily closing price falls below the $0.06733 level, it could lead to a return to the formation zone and a price below the EMA 200 (red line), resulting in a significant loss of momentum for DOGE.
On the other hand, the important resistance levels to monitor for DOGE on the daily chart are $0.07854, $0.08242, and $0.08772. If the daily closing price exceeds the $0.08242 level, it could trigger an upward trend for DOGE.
Dogecoin Two-Hour Chart Analysis
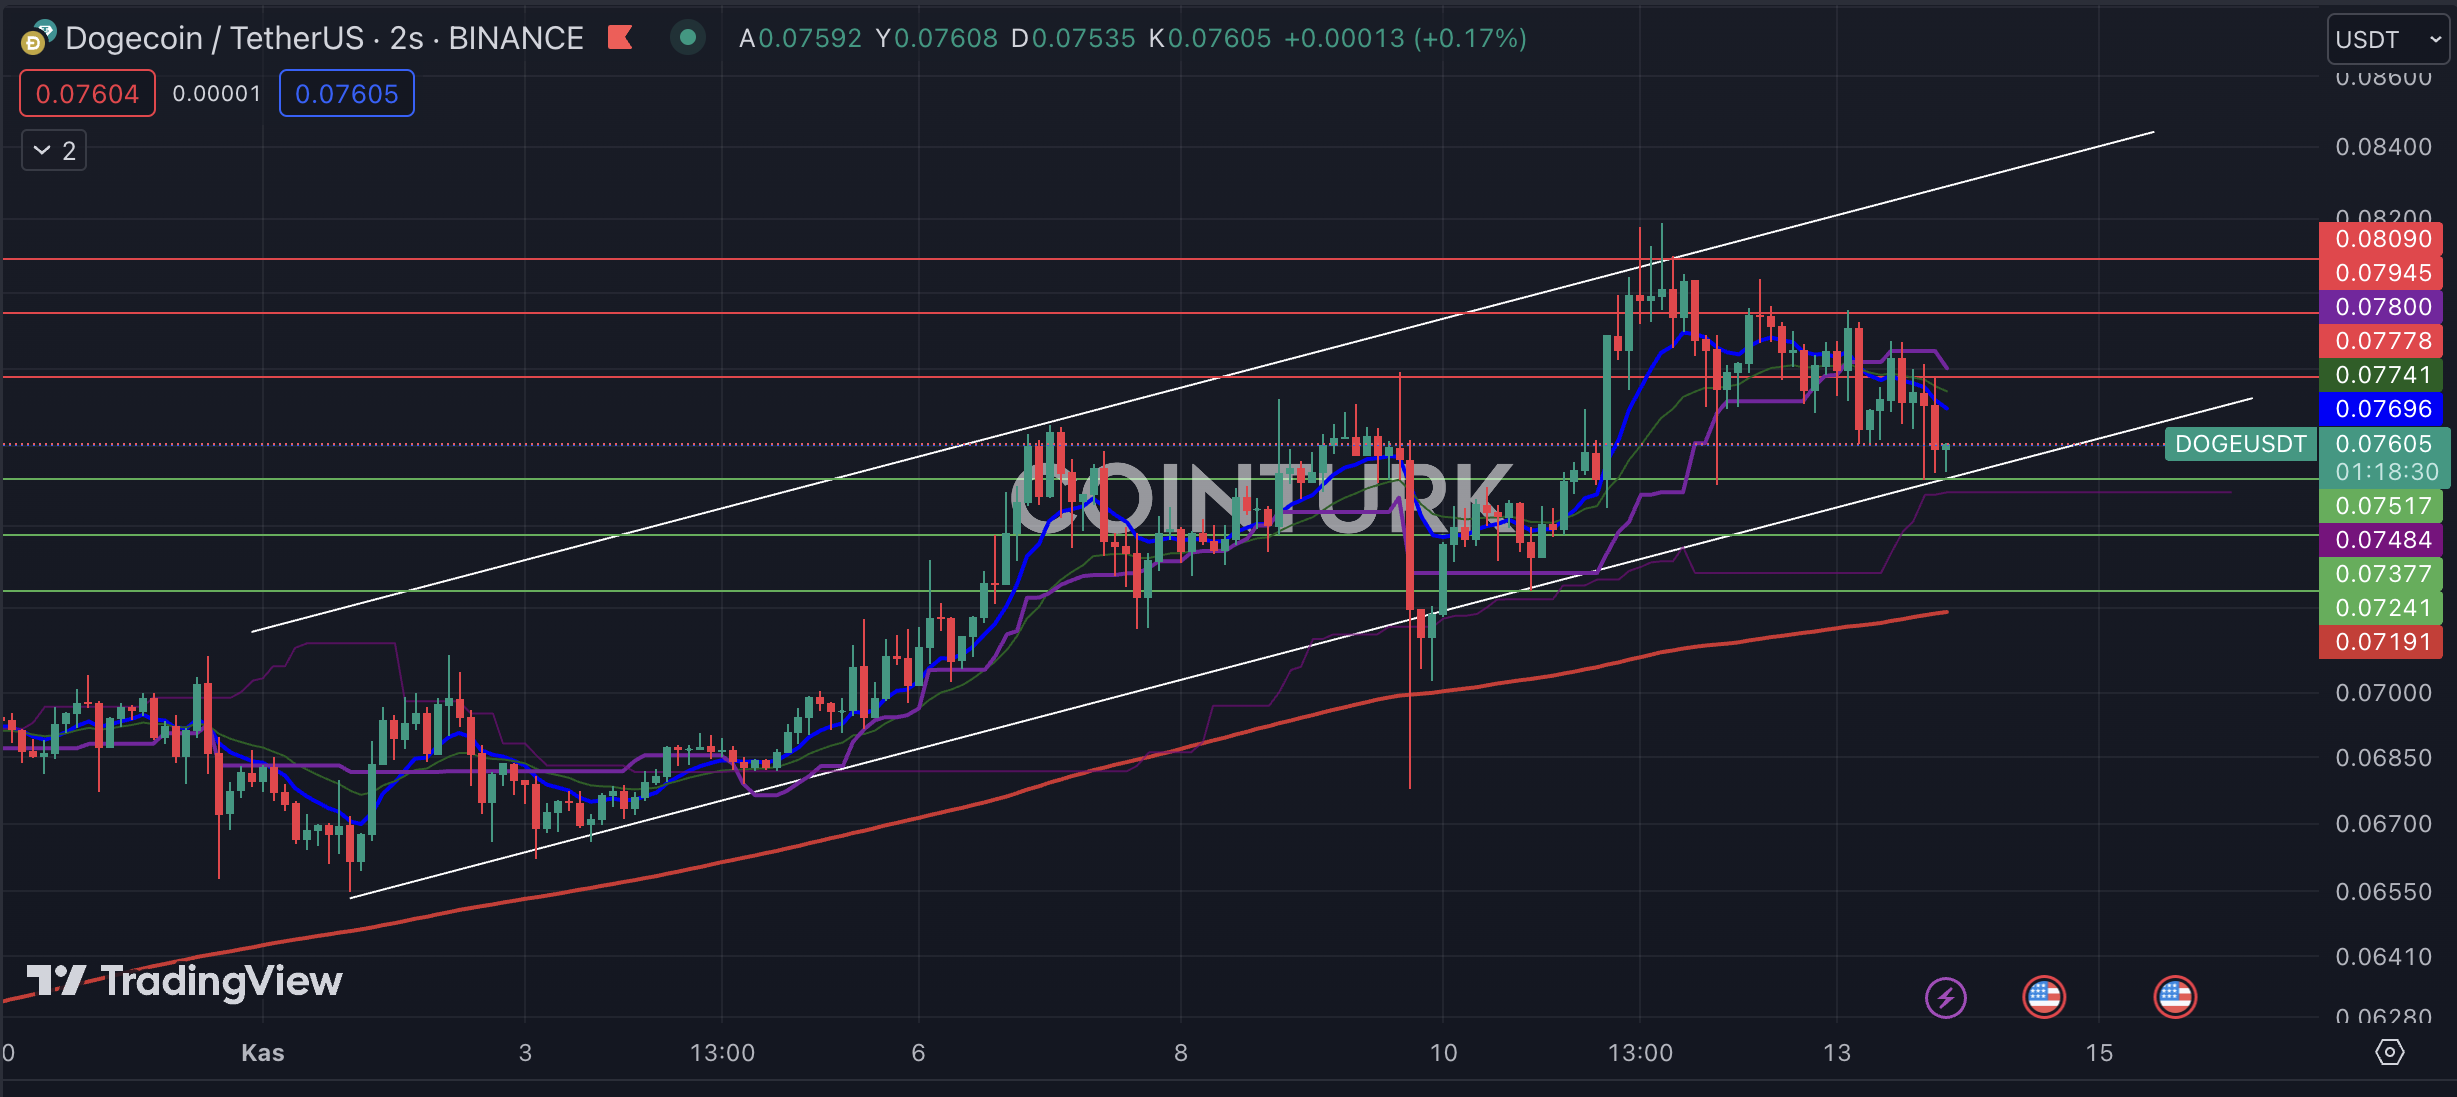
The first formation that stands out on the two-hour chart for DOGE is an ascending channel pattern. The breakdown of support on November 10th and three consecutive bar closures below this formation indicate a bear trap for investors. However, the presence of DOGE above the support line in recent bar closures suggests a significant waiting period.
The crucial support levels to watch for DOGE on the two-hour chart are $0.07517, $0.07377, and $0.07241. If the bar closes below the $0.07517 level, it will disrupt the formation structure.
Regarding resistance levels, the important levels to observe for DOGE on the two-hour chart are $0.07778, $0.07945, and $0.08090. A bar closure above the major obstacle of $0.08090 will ignite a new upward trend for DOGE.
 Optimisus
 DogeHome
 Crypto News Land
 Optimisus
 Crypto News Land
 Crypto News Land
 Optimisus
 Cryptopolitan_News


