Technical analysis is an essential tool for investors in the cryptocurrency market, especially those who trade in the futures market. So, what does technical analysis tell us about Dogecoin, which is currently trading at $0.07606? Let’s delve into a detailed chart analysis, examining important support and resistance levels.
기술적 분석은 암호화폐 시장의 투자자, 특히 선물 시장에서 거래하는 투자자에게 필수적인 도구입니다. 그렇다면 현재 0.07606달러에 거래되고 있는 Dogecoin에 대해 기술적 분석을 통해 우리는 무엇을 알 수 있을까요? 중요한 지지와 저항 수준을 조사하면서 상세한 차트 분석을 살펴보겠습니다.
Dogecoin Daily Chart Analysis
Dogecoin 일일 차트 분석
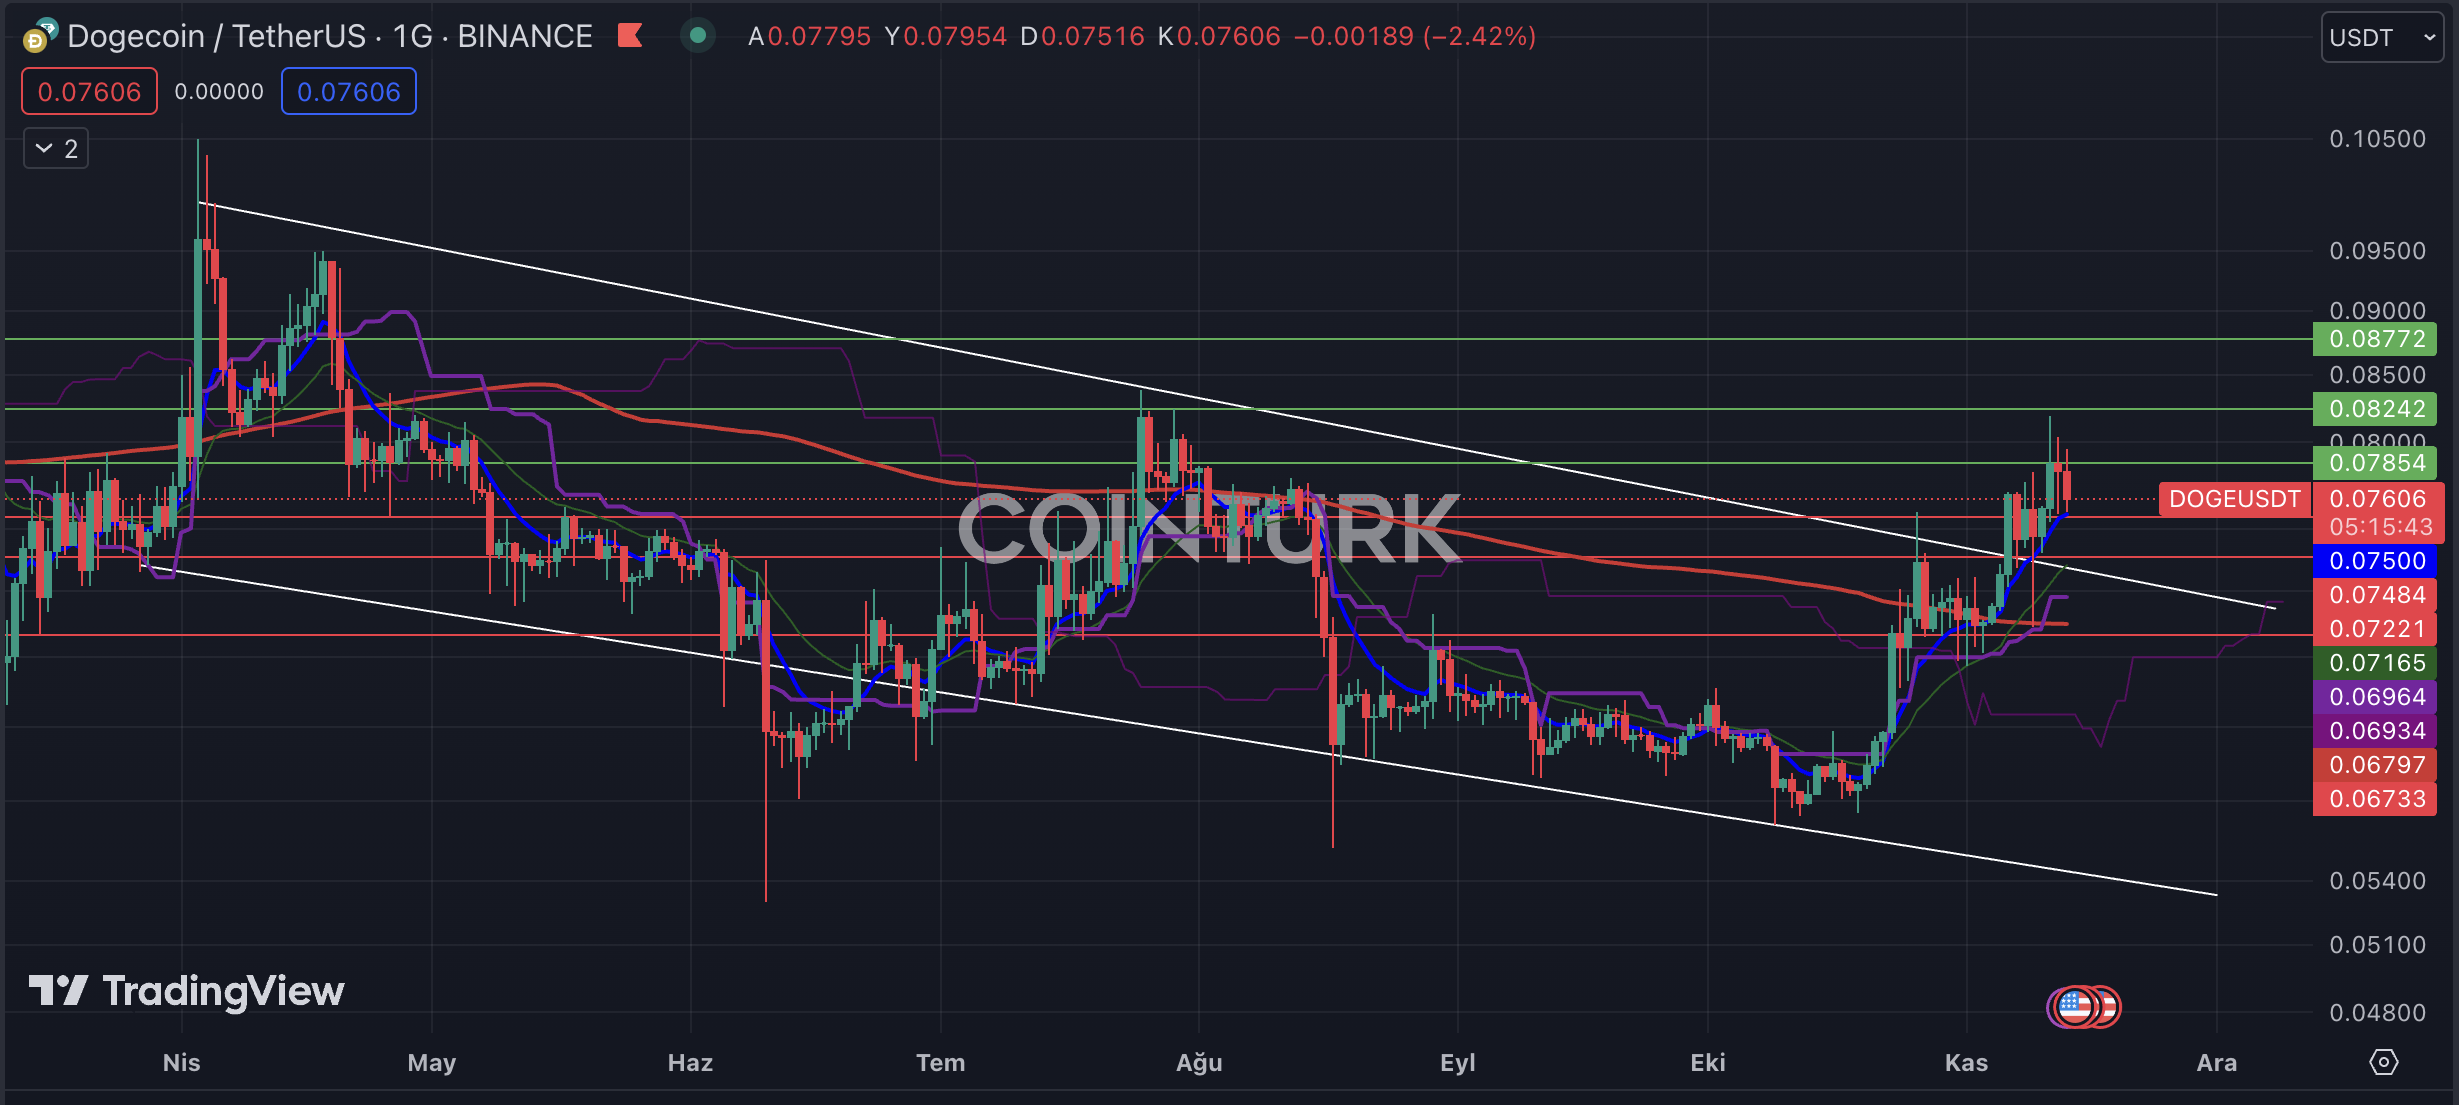
The first notable formation on the daily chart of Dogecoin is a descending channel pattern. This structure was surpassed when the resistance line was broken during the recent uptrend. Despite the dominance of selling pressure today, this formation may lead to a positive trend in the future.
Dogecoin 일일 차트에서 첫 번째로 눈에 띄는 형태는 하강 채널 패턴입니다. 최근 상승 추세에서 저항선이 무너지면서 이 구조를 넘어섰습니다. 오늘날 매도 압력이 지배적임에도 불구하고 이러한 형성은 미래에 긍정적인 추세로 이어질 수 있습니다.
The crucial support levels to watch for DOGE on the daily chart are $0.07484, $0.07221, and $0.06733. If the daily closing price falls below the $0.06733 level, it could lead to a return to the formation zone and a price below the EMA 200 (red line), resulting in a significant loss of momentum for DOGE.
일일 차트에서 DOGE를 관찰해야 하는 중요한 지원 수준은 $0.07484, $0.07221 및 $0.06733입니다. 일일 종가가 $0.06733 수준 아래로 떨어지면 형성 영역으로 복귀하고 가격이 EMA 200(빨간색 선) 아래로 내려가 DOGE의 모멘텀이 크게 손실될 수 있습니다.
On the other hand, the important resistance levels to monitor for DOGE on the daily chart are $0.07854, $0.08242, and $0.08772. If the daily closing price exceeds the $0.08242 level, it could trigger an upward trend for DOGE.
반면 일일 차트에서 DOGE를 모니터링해야 하는 중요한 저항 수준은 $0.07854, $0.08242, $0.08772입니다. 일일 종가가 $0.08242 수준을 초과하면 DOGE의 상승 추세가 촉발될 수 있습니다.

Dogecoin Two-Hour Chart Analysis
Dogecoin 2시간 차트 분석
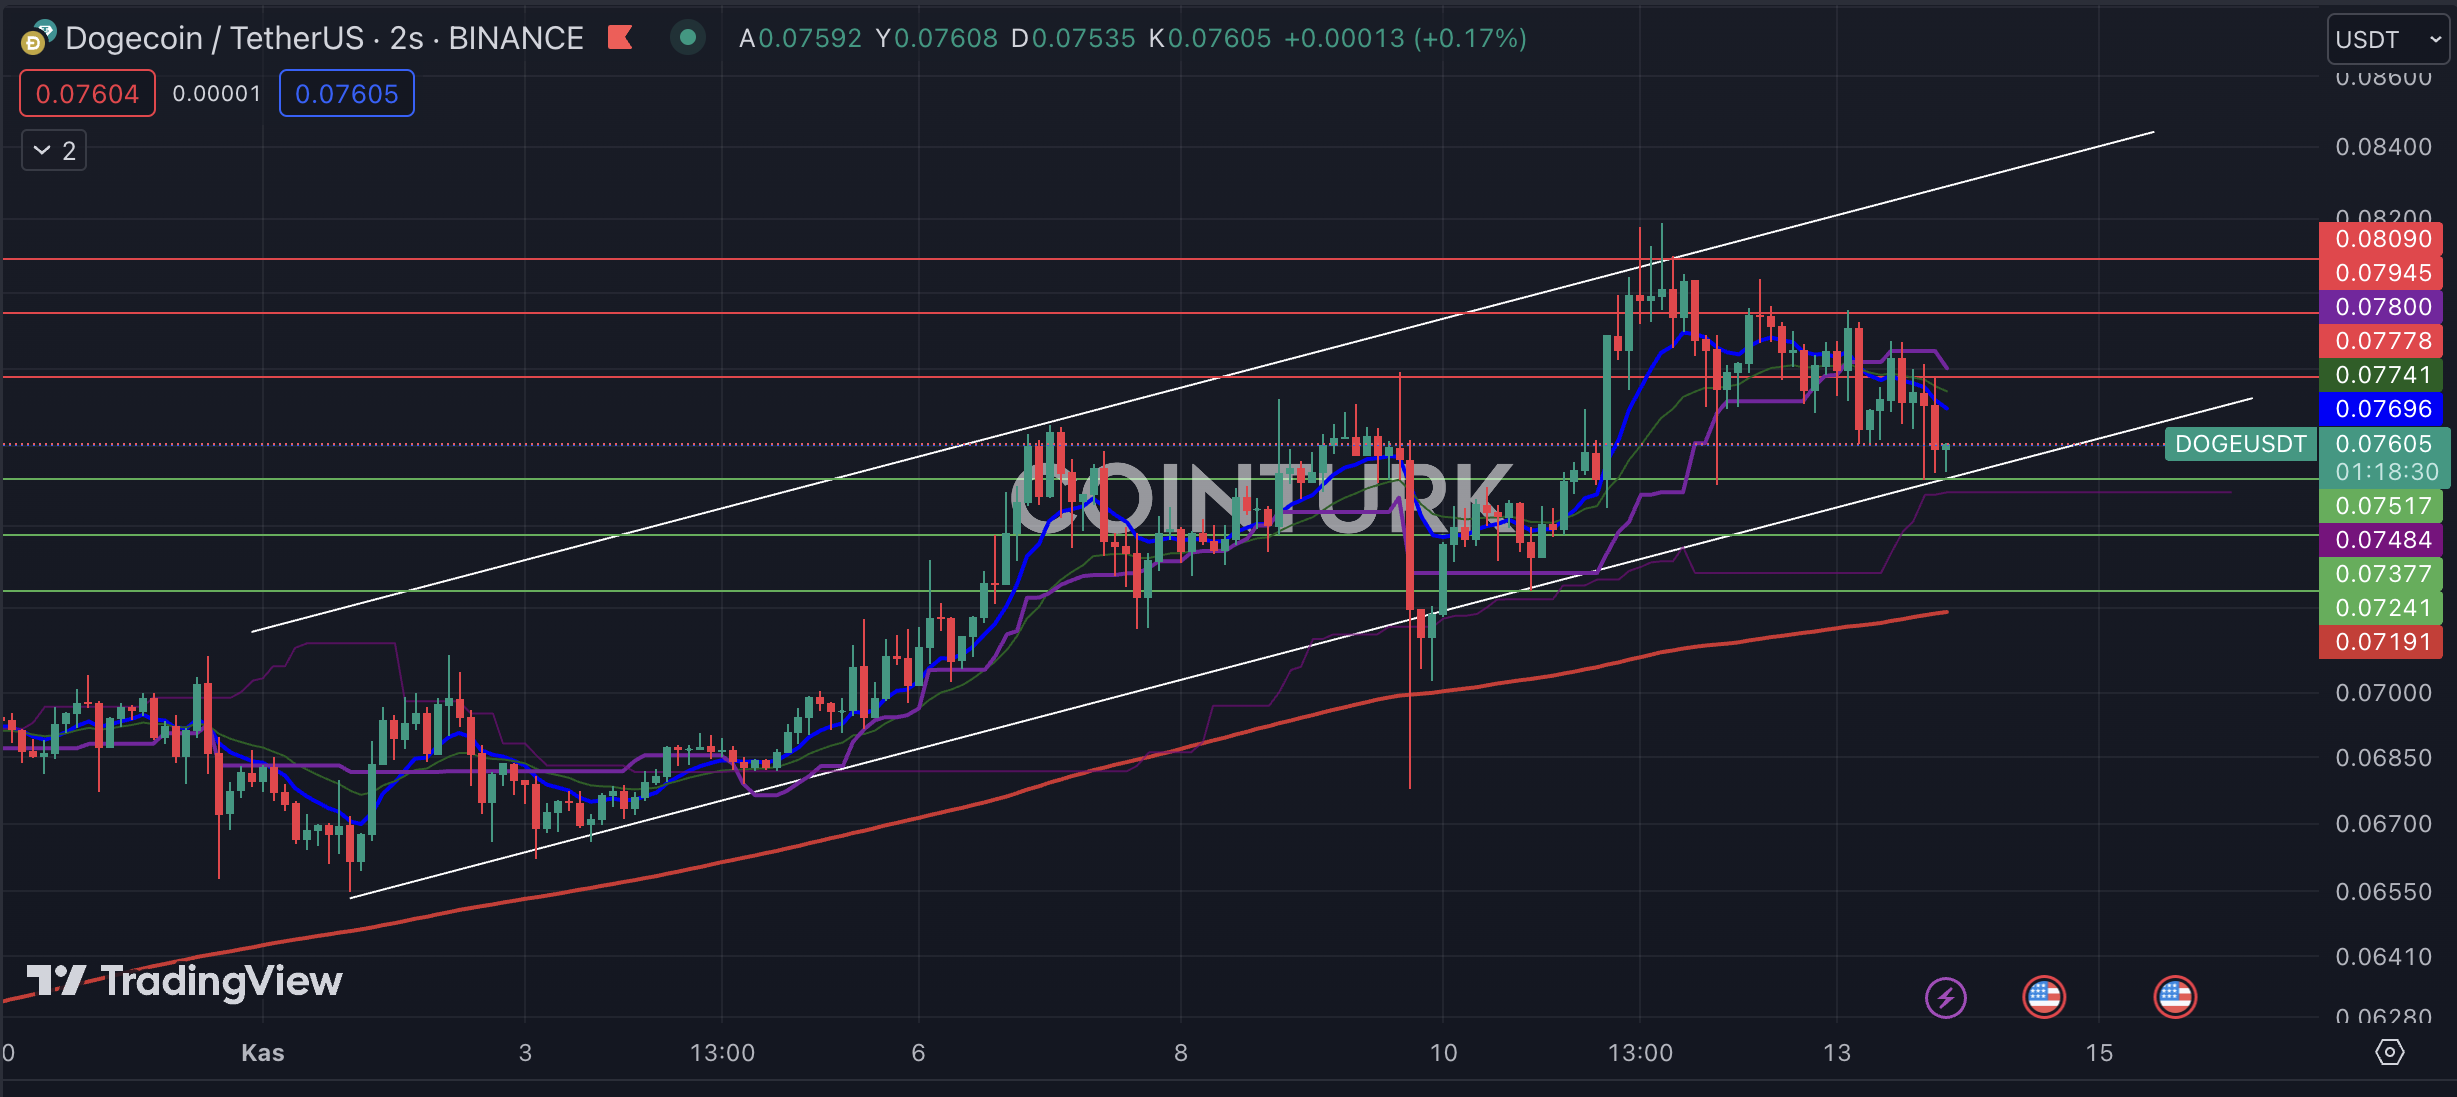
The first formation that stands out on the two-hour chart for DOGE is an ascending channel pattern. The breakdown of support on November 10th and three consecutive bar closures below this formation indicate a bear trap for investors. However, the presence of DOGE above the support line in recent bar closures suggests a significant waiting period.
DOGE의 2시간 차트에서 눈에 띄는 첫 번째 패턴은 상승 채널 패턴입니다. 11월 10일 지지율 분석과 이 형태 아래에서 3번 연속 막대 폐쇄는 투자자들에게 하락 함정을 나타냅니다. 그러나 최근 바 폐쇄에서 지지선 위에 DOGE가 존재한다는 것은 상당한 대기 기간이 있음을 시사합니다.
The crucial support levels to watch for DOGE on the two-hour chart are $0.07517, $0.07377, and $0.07241. If the bar closes below the $0.07517 level, it will disrupt the formation structure.
2시간 차트에서 DOGE를 관찰하는 중요한 지원 수준은 $0.07517, $0.07377 및 $0.07241입니다. 막대가 $0.07517 수준 아래로 마감되면 형성 구조가 붕괴됩니다.
Regarding resistance levels, the important levels to observe for DOGE on the two-hour chart are $0.07778, $0.07945, and $0.08090. A bar closure above the major obstacle of $0.08090 will ignite a new upward trend for DOGE.
저항 수준과 관련하여 2시간 차트에서 DOGE에 대해 관찰해야 할 중요한 수준은 $0.07778, $0.07945 및 $0.08090입니다. $0.08090의 주요 장애물을 넘는 막대 폐쇄는 DOGE의 새로운 상승 추세를 촉발할 것입니다.

계속 읽기: https://en.coin-turk.com/analytic-of-dogecoin-charts-diving-into-technical-indicators/


 BlockchainReporter
 Optimisus
 DogeHome
 Crypto News Land
 Optimisus
 Crypto News Land
 Crypto News Land
 Optimisus


