Technical analysis is an essential tool for investors in the cryptocurrency market, especially those who trade in the futures market. So, what does technical analysis tell us about Dogecoin, which is currently trading at $0.07606? Let’s delve into a detailed chart analysis, examining important support and resistance levels.
テクニカル分析は、暗号通貨市場の投資家、特に先物市場で取引する投資家にとって不可欠なツールです。それでは、テクニカル分析は、現在0.07606ドルで取引されているドージコインについて何を教えてくれるのでしょうか?重要なサポートとレジスタンスのレベルを調べながら、詳細なチャート分析を掘り下げてみましょう。
Dogecoin Daily Chart Analysis
ドージコイン日足チャート分析
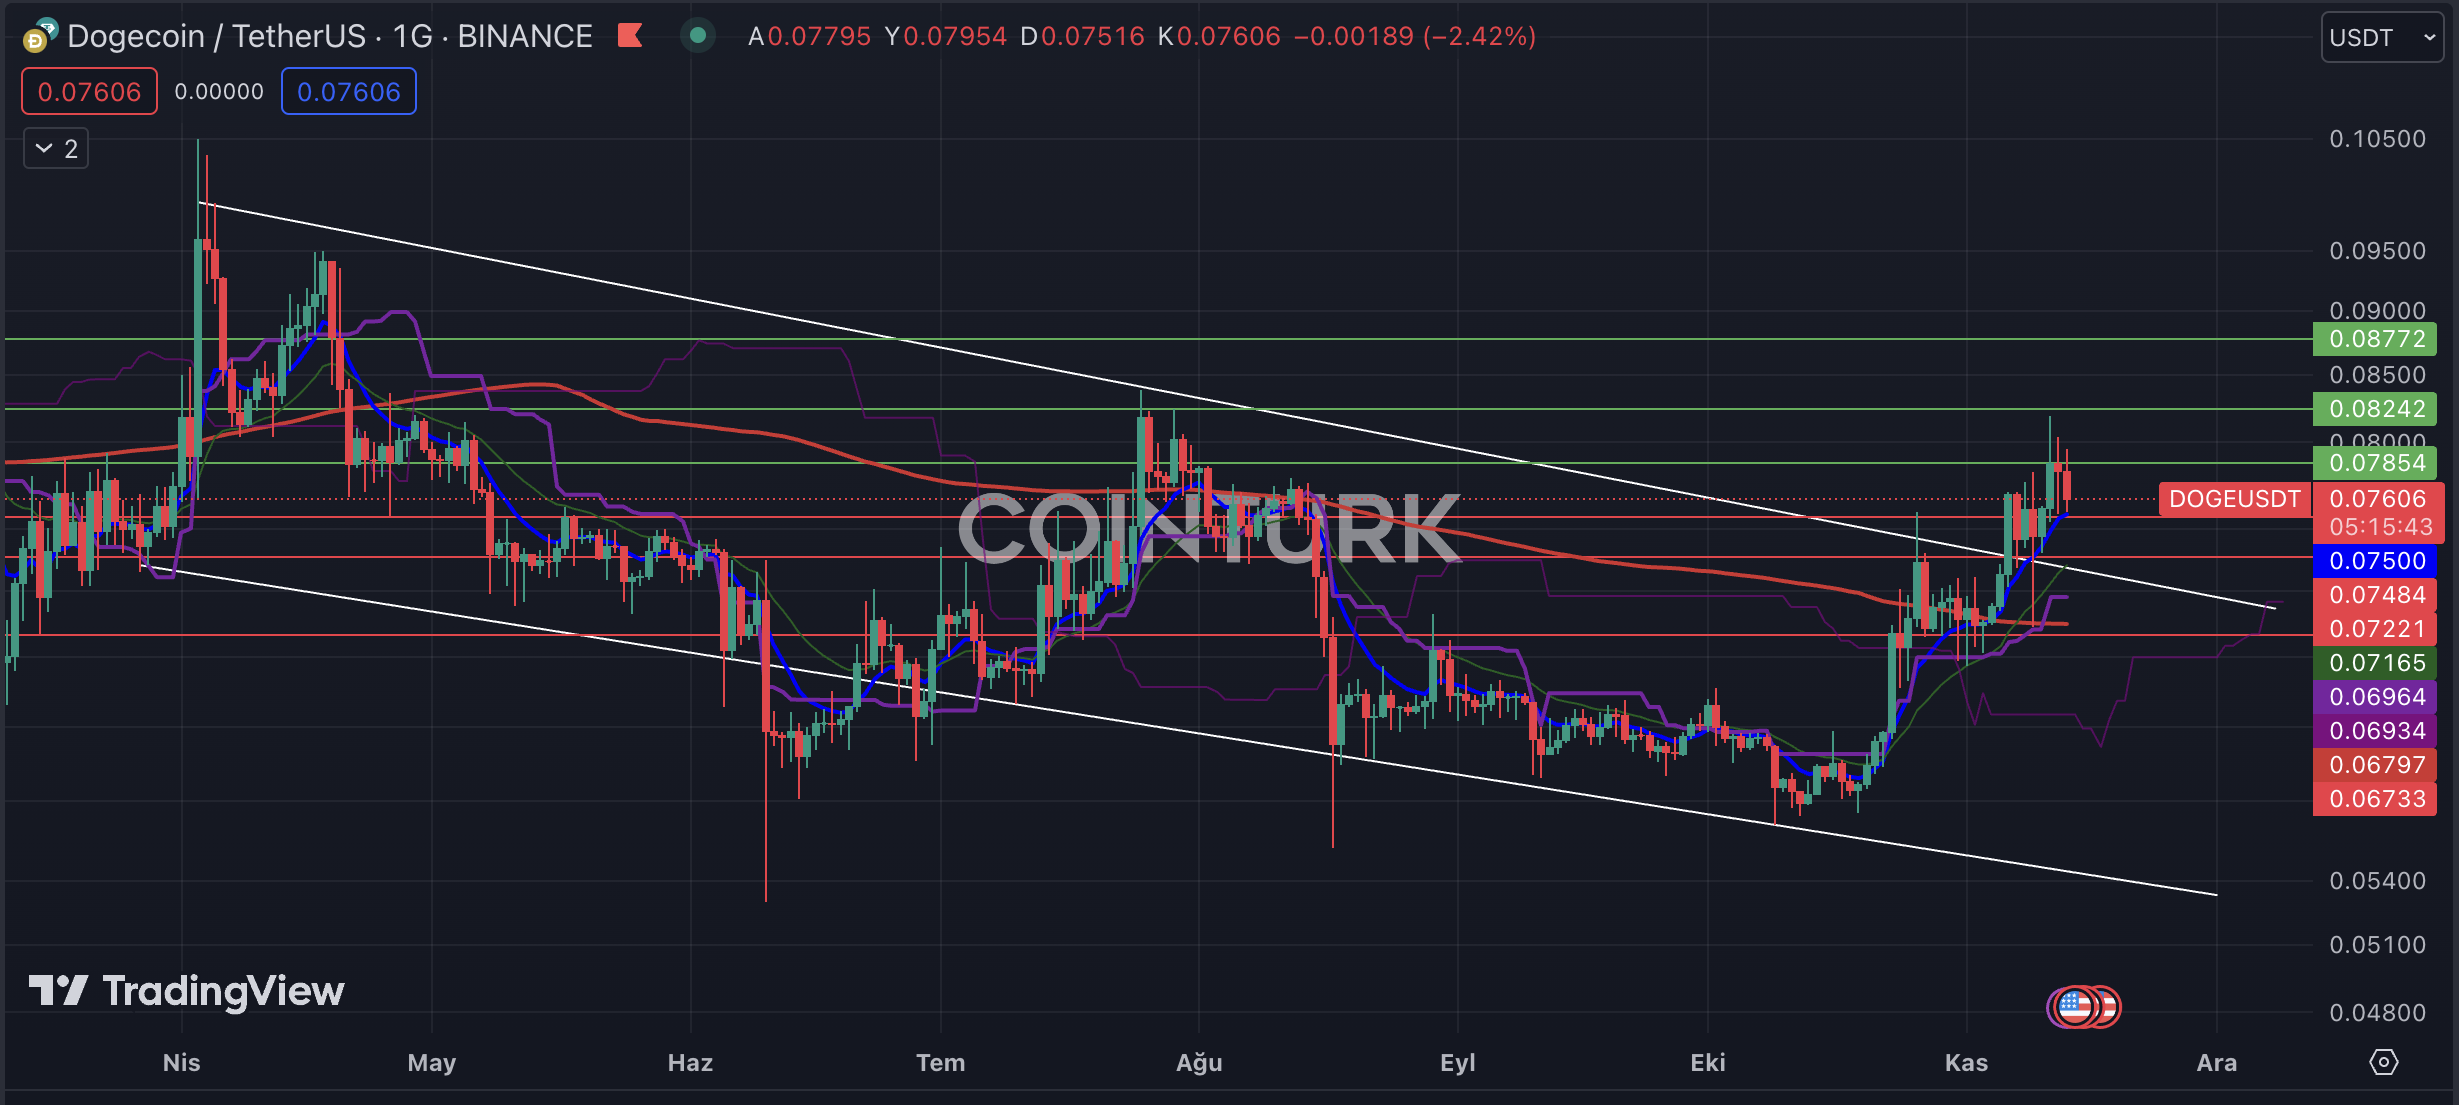
The first notable formation on the daily chart of Dogecoin is a descending channel pattern. This structure was surpassed when the resistance line was broken during the recent uptrend. Despite the dominance of selling pressure today, this formation may lead to a positive trend in the future.
ドージコインの日足チャートの最初の注目すべき形成は、下降チャネルパターンです。最近の上昇トレンド中にレジスタンスラインを突破したときに、この構造は上回りました。今日は売り圧力が優勢であるにもかかわらず、このフォーメーションは将来的にプラスの傾向につながる可能性があります。
The crucial support levels to watch for DOGE on the daily chart are $0.07484, $0.07221, and $0.06733. If the daily closing price falls below the $0.06733 level, it could lead to a return to the formation zone and a price below the EMA 200 (red line), resulting in a significant loss of momentum for DOGE.
日足チャートでDOGEに注目すべき重要なサポートレベルは、0.07484ドル、0.07221ドル、0.06733ドルです。毎日の終値が0.06733ドルのレベルを下回った場合、フォーメーションゾーンに戻り、価格がEMA 200(赤い線)を下回る可能性があり、その結果、DOGEの勢いが大幅に失われることになります。
On the other hand, the important resistance levels to monitor for DOGE on the daily chart are $0.07854, $0.08242, and $0.08772. If the daily closing price exceeds the $0.08242 level, it could trigger an upward trend for DOGE.
一方、日足チャートでDOGEを監視する重要な抵抗レベルは、0.07854ドル、0.08242ドル、0.08772ドルです。毎日の終値が0.08242ドルのレベルを超えた場合、DOGEの上昇トレンドを引き起こす可能性があります。

Dogecoin Two-Hour Chart Analysis
ドージコインの2時間足チャート分析
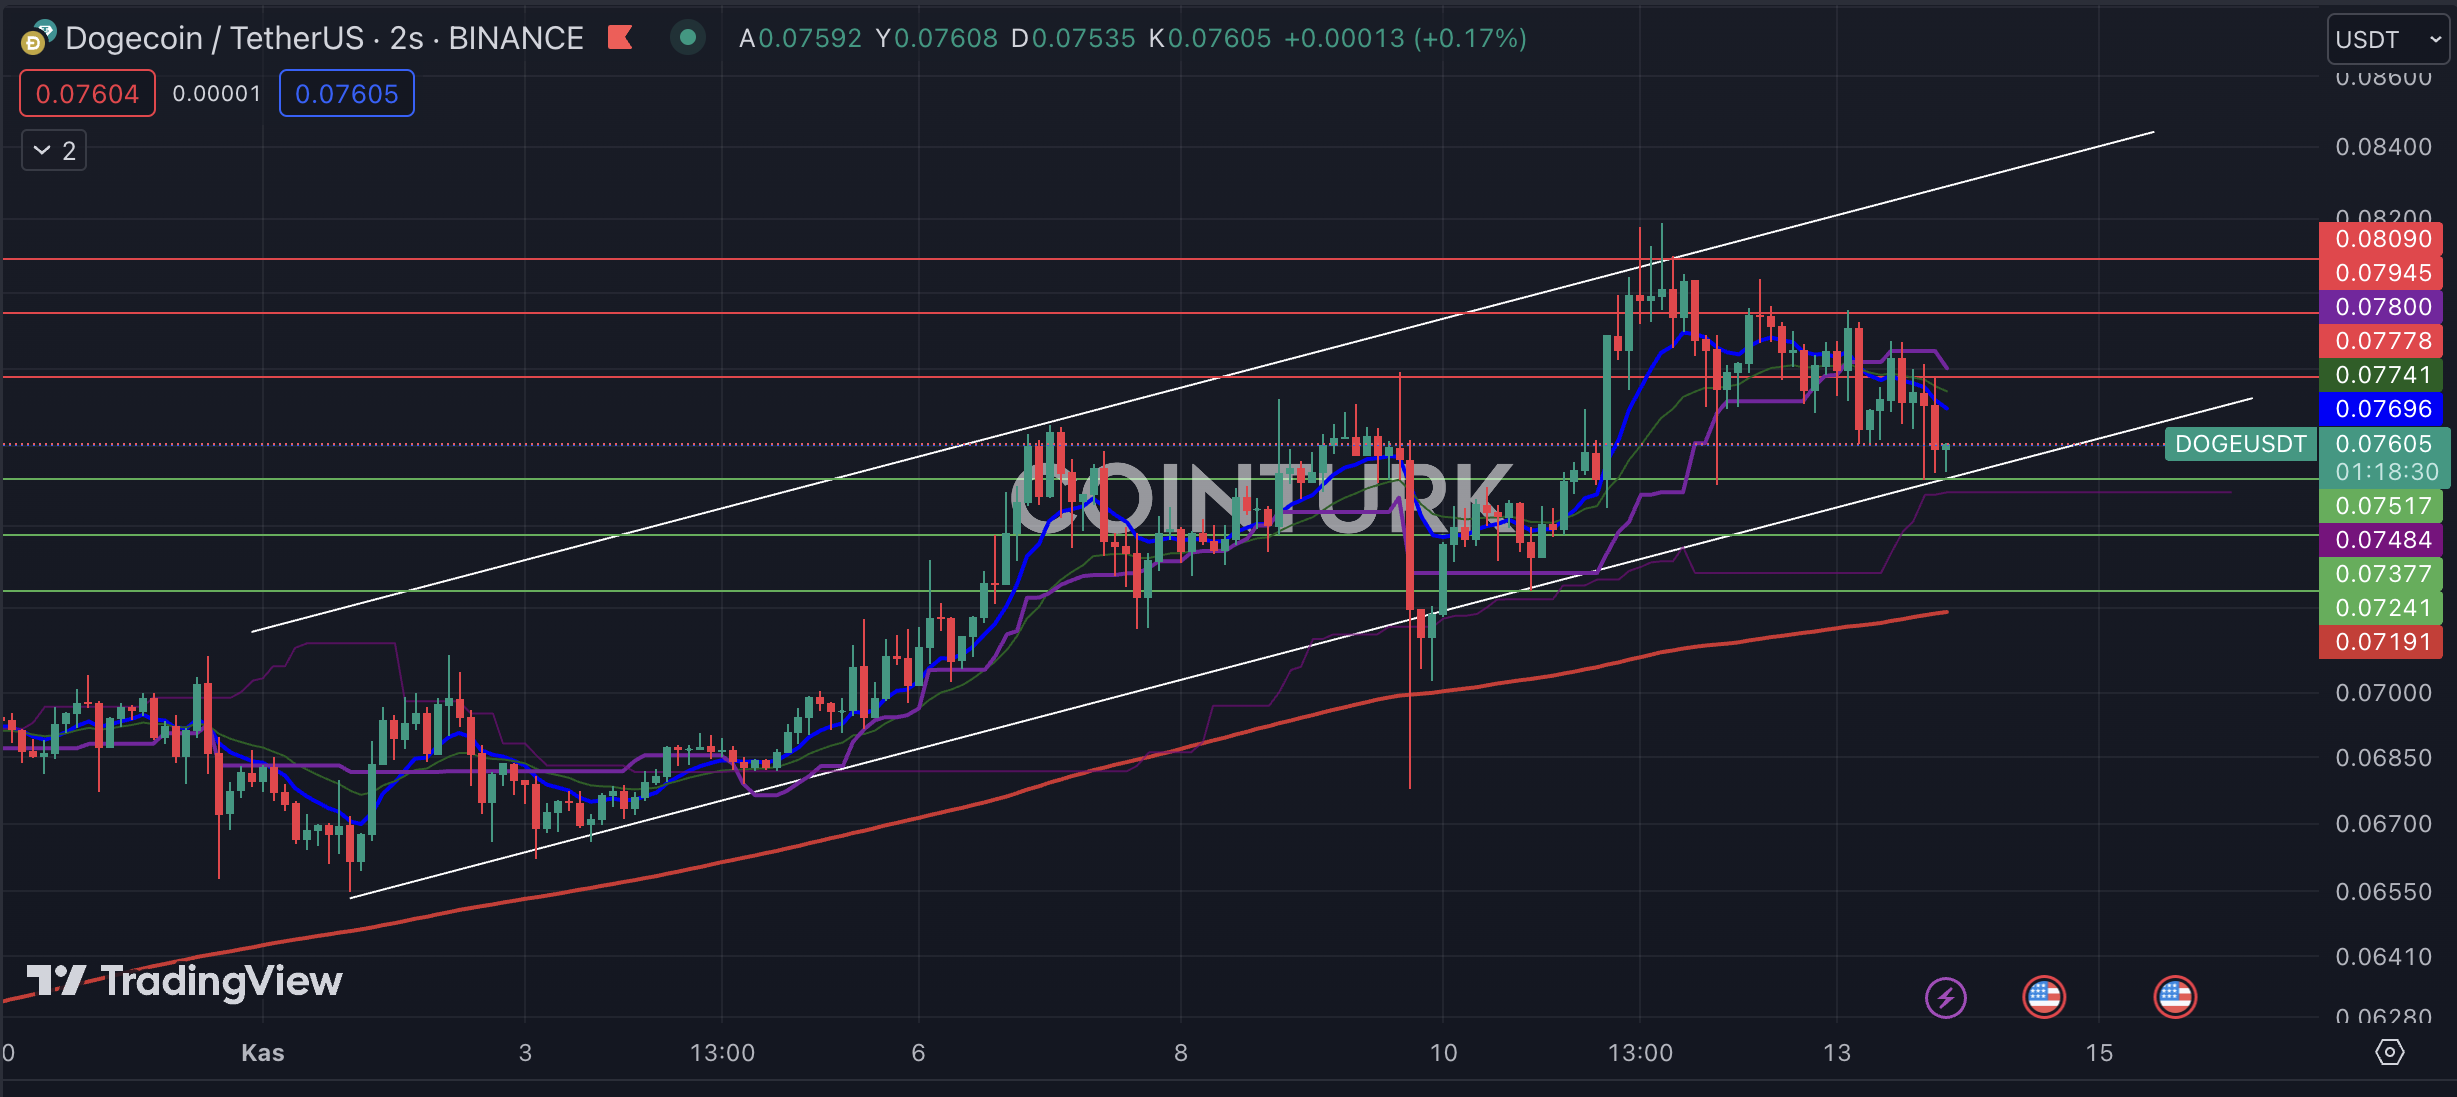
The first formation that stands out on the two-hour chart for DOGE is an ascending channel pattern. The breakdown of support on November 10th and three consecutive bar closures below this formation indicate a bear trap for investors. However, the presence of DOGE above the support line in recent bar closures suggests a significant waiting period.
DOGE の 2 時間足チャートで目立つ最初のフォーメーションは、上昇チャネル パターンです。 11月10日のサポートの内訳と、このフォーメーションを下回る3回連続のバークローズは、投資家にとって弱気の罠であることを示しています。しかし、最近のバーの閉鎖でDOGEがサポートラインを上回っていることは、かなりの待機期間が必要であることを示唆しています。
The crucial support levels to watch for DOGE on the two-hour chart are $0.07517, $0.07377, and $0.07241. If the bar closes below the $0.07517 level, it will disrupt the formation structure.
2時間足チャートでDOGEに注目すべき重要なサポートレベルは、0.07517ドル、0.07377ドル、0.07241ドルです。バーが0.07517ドルのレベルを下回って終了すると、フォーメーション構造が混乱します。
Regarding resistance levels, the important levels to observe for DOGE on the two-hour chart are $0.07778, $0.07945, and $0.08090. A bar closure above the major obstacle of $0.08090 will ignite a new upward trend for DOGE.
レジスタンスレベルに関して、2時間足チャートのDOGEで観察すべき重要なレベルは、0.07778ドル、0.07945ドル、0.08090ドルです。主要な障害である0.08090ドルを超えてバーが引けると、DOGEの新たな上昇トレンドが始まるだろう。

続きを読む: https://en.coin-turk.com/analysis-of-dogecoin-charts-diving-into-technical-indicators/


 BlockchainReporter
 Optimisus
 DogeHome
 Crypto News Land
 Optimisus
 Crypto News Land
 Crypto News Land
 Optimisus


