


Technical analysis is an essential tool for investors in the cryptocurrency market, especially those who trade in the futures market. So, what does technical analysis tell us about Dogecoin, which is currently trading at $0.07606? Let’s delve into a detailed chart analysis, examining important support and resistance levels.
技术分析是加密货币市场投资者,尤其是期货市场交易者的必备工具。那么,对于目前交易价格为 0.07606 美元的狗狗币,技术分析告诉我们什么?让我们深入研究详细的图表分析,检查重要的支撑位和阻力位。
Dogecoin Daily Chart Analysis
狗狗币每日图表分析
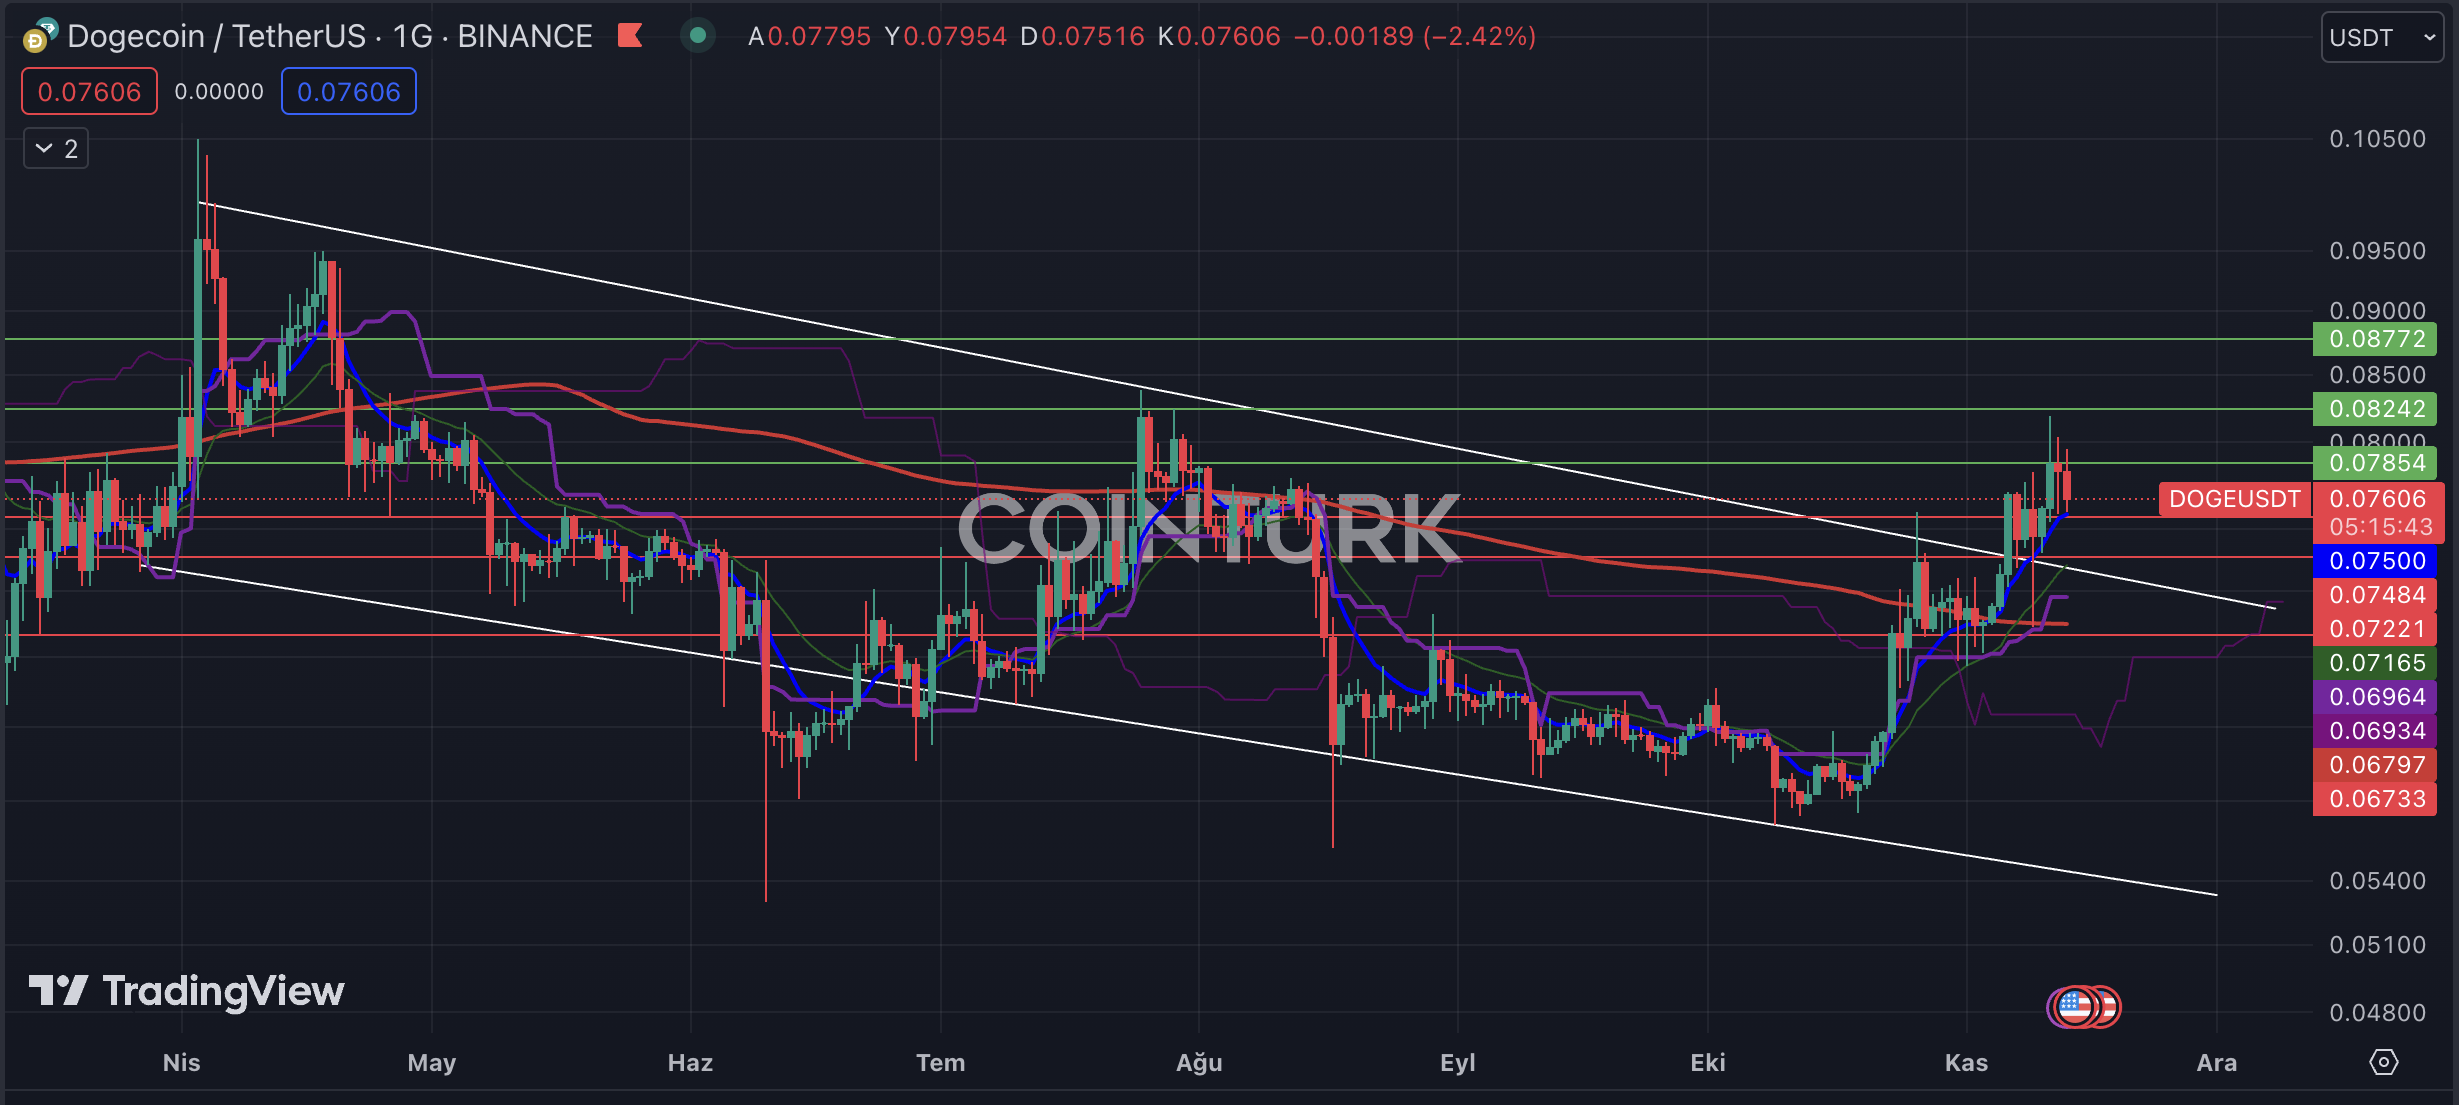
The first notable formation on the daily chart of Dogecoin is a descending channel pattern. This structure was surpassed when the resistance line was broken during the recent uptrend. Despite the dominance of selling pressure today, this formation may lead to a positive trend in the future.
狗狗币日线图上第一个值得注意的形态是下降通道形态。在最近的上升趋势中,当阻力线被突破时,该结构被突破。尽管今天抛售压力占主导地位,但这种形成可能会导致未来的积极趋势。
The crucial support levels to watch for DOGE on the daily chart are $0.07484, $0.07221, and $0.06733. If the daily closing price falls below the $0.06733 level, it could lead to a return to the formation zone and a price below the EMA 200 (red line), resulting in a significant loss of momentum for DOGE.
DOGE 在日线图上值得关注的关键支撑位是 0.07484 美元、0.07221 美元和 0.06733 美元。如果每日收盘价跌破 0.06733 美元的水平,可能会导致价格回到形成区域并低于 EMA 200(红线),从而导致 DOGE 动力大幅丧失。
On the other hand, the important resistance levels to monitor for DOGE on the daily chart are $0.07854, $0.08242, and $0.08772. If the daily closing price exceeds the $0.08242 level, it could trigger an upward trend for DOGE.
另一方面,日线图上需要监控的 DOGE 重要阻力位为 0.07854 美元、0.08242 美元和 0.08772 美元。如果每日收盘价超过 0.08242 美元的水平,可能会引发 DOGE 的上涨趋势。
Dogecoin Two-Hour Chart Analysis
狗狗币两小时图分析
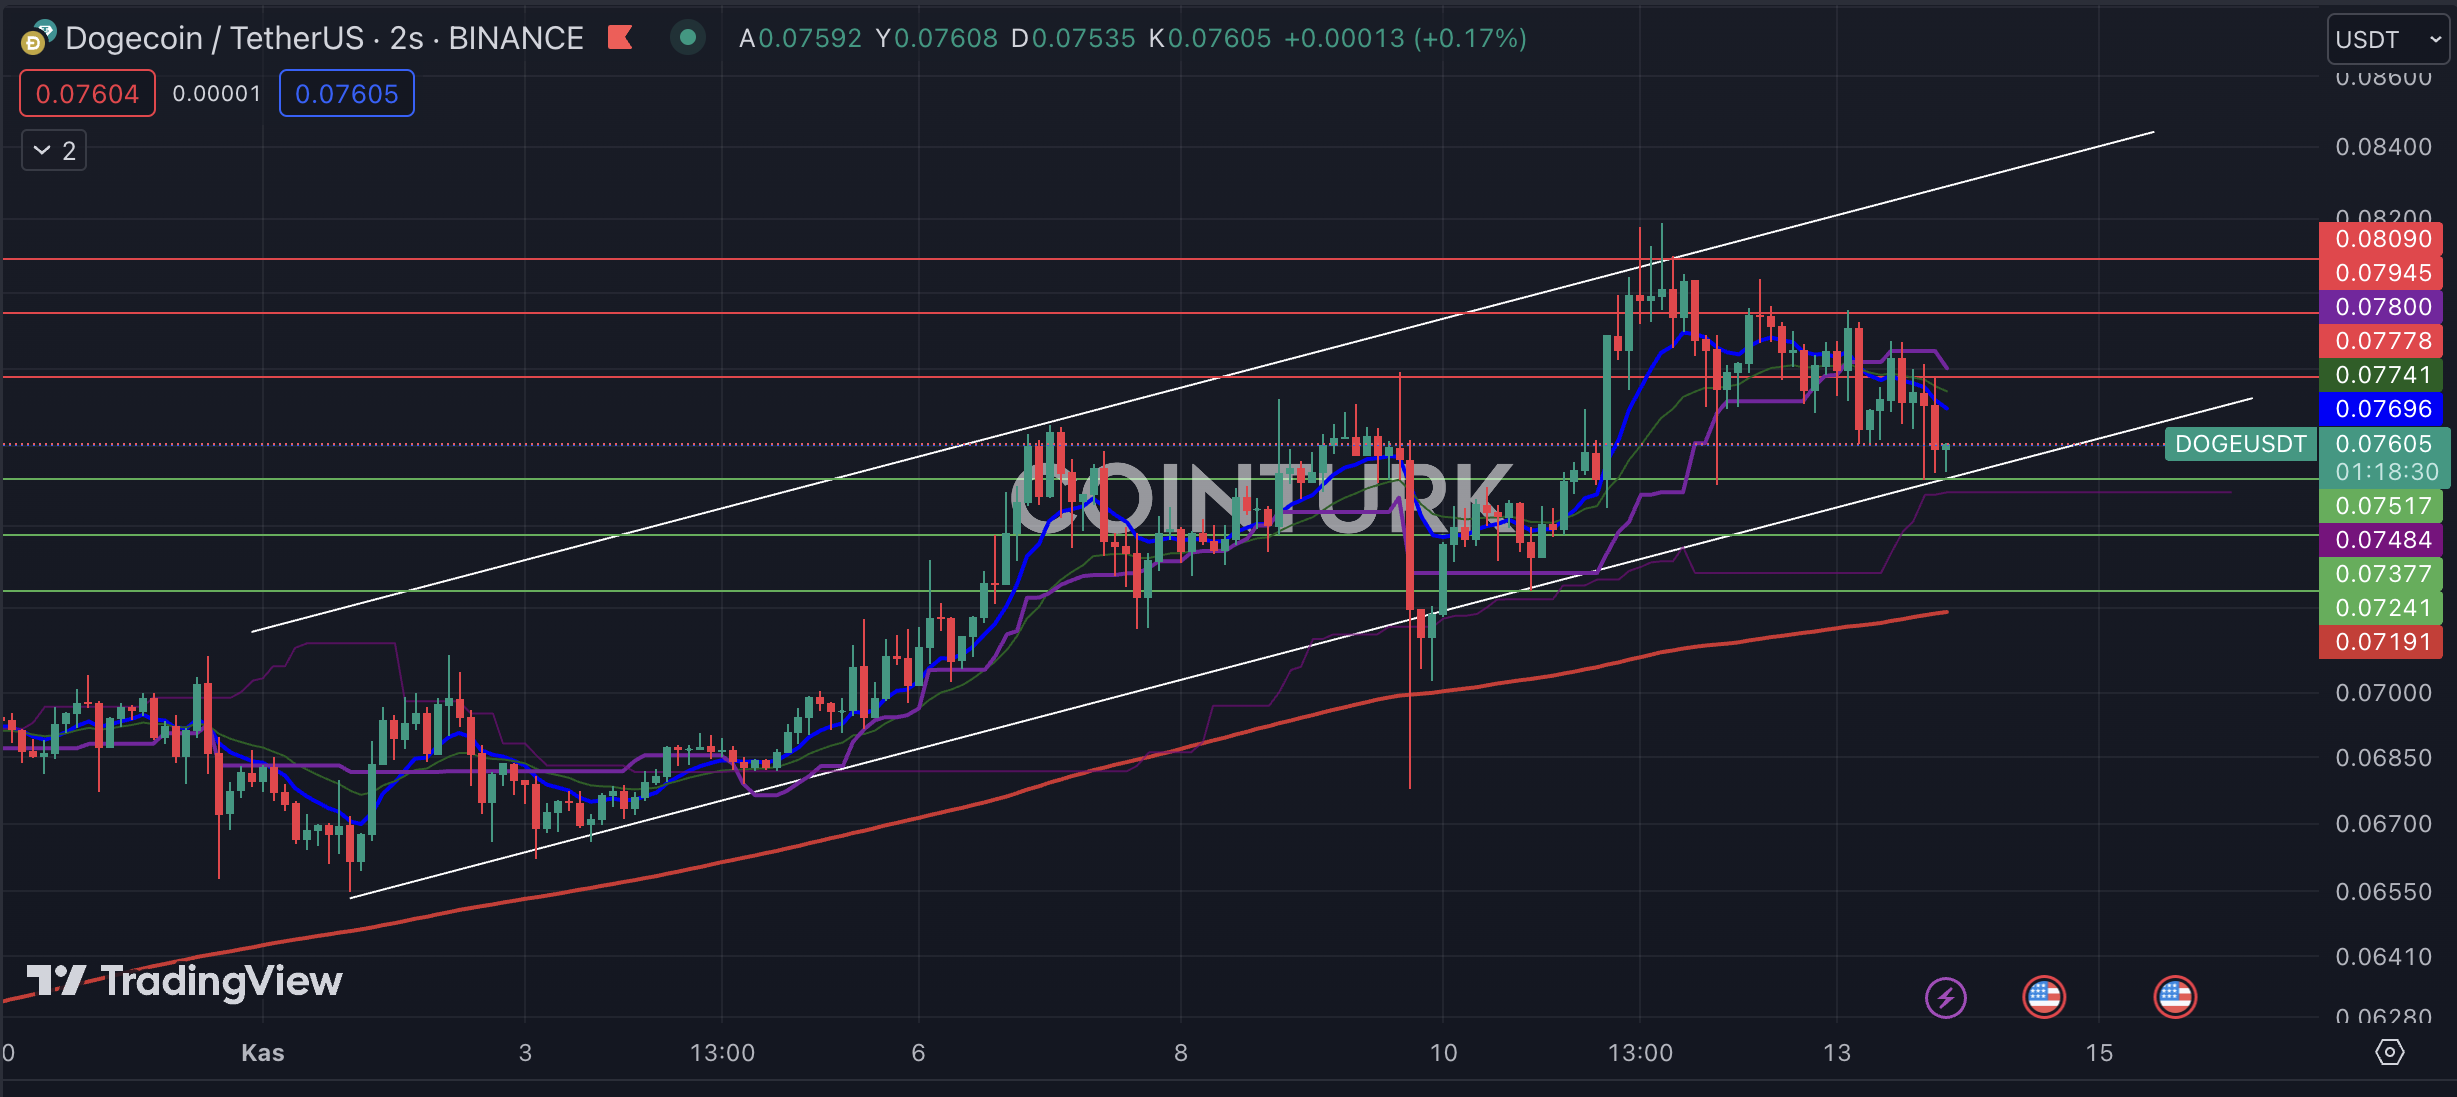
The first formation that stands out on the two-hour chart for DOGE is an ascending channel pattern. The breakdown of support on November 10th and three consecutive bar closures below this formation indicate a bear trap for investors. However, the presence of DOGE above the support line in recent bar closures suggests a significant waiting period.
DOGE 两小时图表上第一个突出的形态是上升通道形态。 11 月 10 日支撑位的崩溃以及连续三个柱线收盘价低于该形态表明投资者陷入了熊市陷阱。然而,在最近的柱线关闭中,DOGE 出现在支撑线上方,表明等待期很长。
The crucial support levels to watch for DOGE on the two-hour chart are $0.07517, $0.07377, and $0.07241. If the bar closes below the $0.07517 level, it will disrupt the formation structure.
两小时图表上需要关注的 DOGE 关键支撑位为 0.07517 美元、0.07377 美元和 0.07241 美元。如果该柱线收于 0.07517 美元以下,则会扰乱形态结构。
Regarding resistance levels, the important levels to observe for DOGE on the two-hour chart are $0.07778, $0.07945, and $0.08090. A bar closure above the major obstacle of $0.08090 will ignite a new upward trend for DOGE.
关于阻力位,两小时图表上需要观察的 DOGE 重要阻力位为 0.07778 美元、0.07945 美元和 0.08090 美元。收盘价高于 0.08090 美元的主要障碍将引发 DOGE 的新上升趋势。
继续阅读:https://en.coin-turk.com/analysis-of-dogecoin-charts-diving-into-technical-indicators/
 Coincu
 Crypto Intelligence
 Optimisus
 DogeHome
 ItsBitcoinWorld
 Optimisus
 Inside Bitcoins
 CoinDesk
 Crypto Daily™


