Technical analysis is an essential tool for investors in the cryptocurrency market, especially those who trade in the futures market. So, what does technical analysis tell us about Dogecoin, which is currently trading at $0.07606? Let’s delve into a detailed chart analysis, examining important support and resistance levels.
Die technische Analyse ist ein wesentliches Instrument für Anleger auf dem Kryptowährungsmarkt, insbesondere für diejenigen, die auf dem Terminmarkt handeln. Was sagt uns die technische Analyse also über Dogecoin, der derzeit bei 0,07606 US-Dollar gehandelt wird? Lassen Sie uns in eine detaillierte Diagrammanalyse eintauchen und wichtige Unterstützungs- und Widerstandsniveaus untersuchen.
Dogecoin Daily Chart Analysis
Tägliche Dogecoin-Chartanalyse
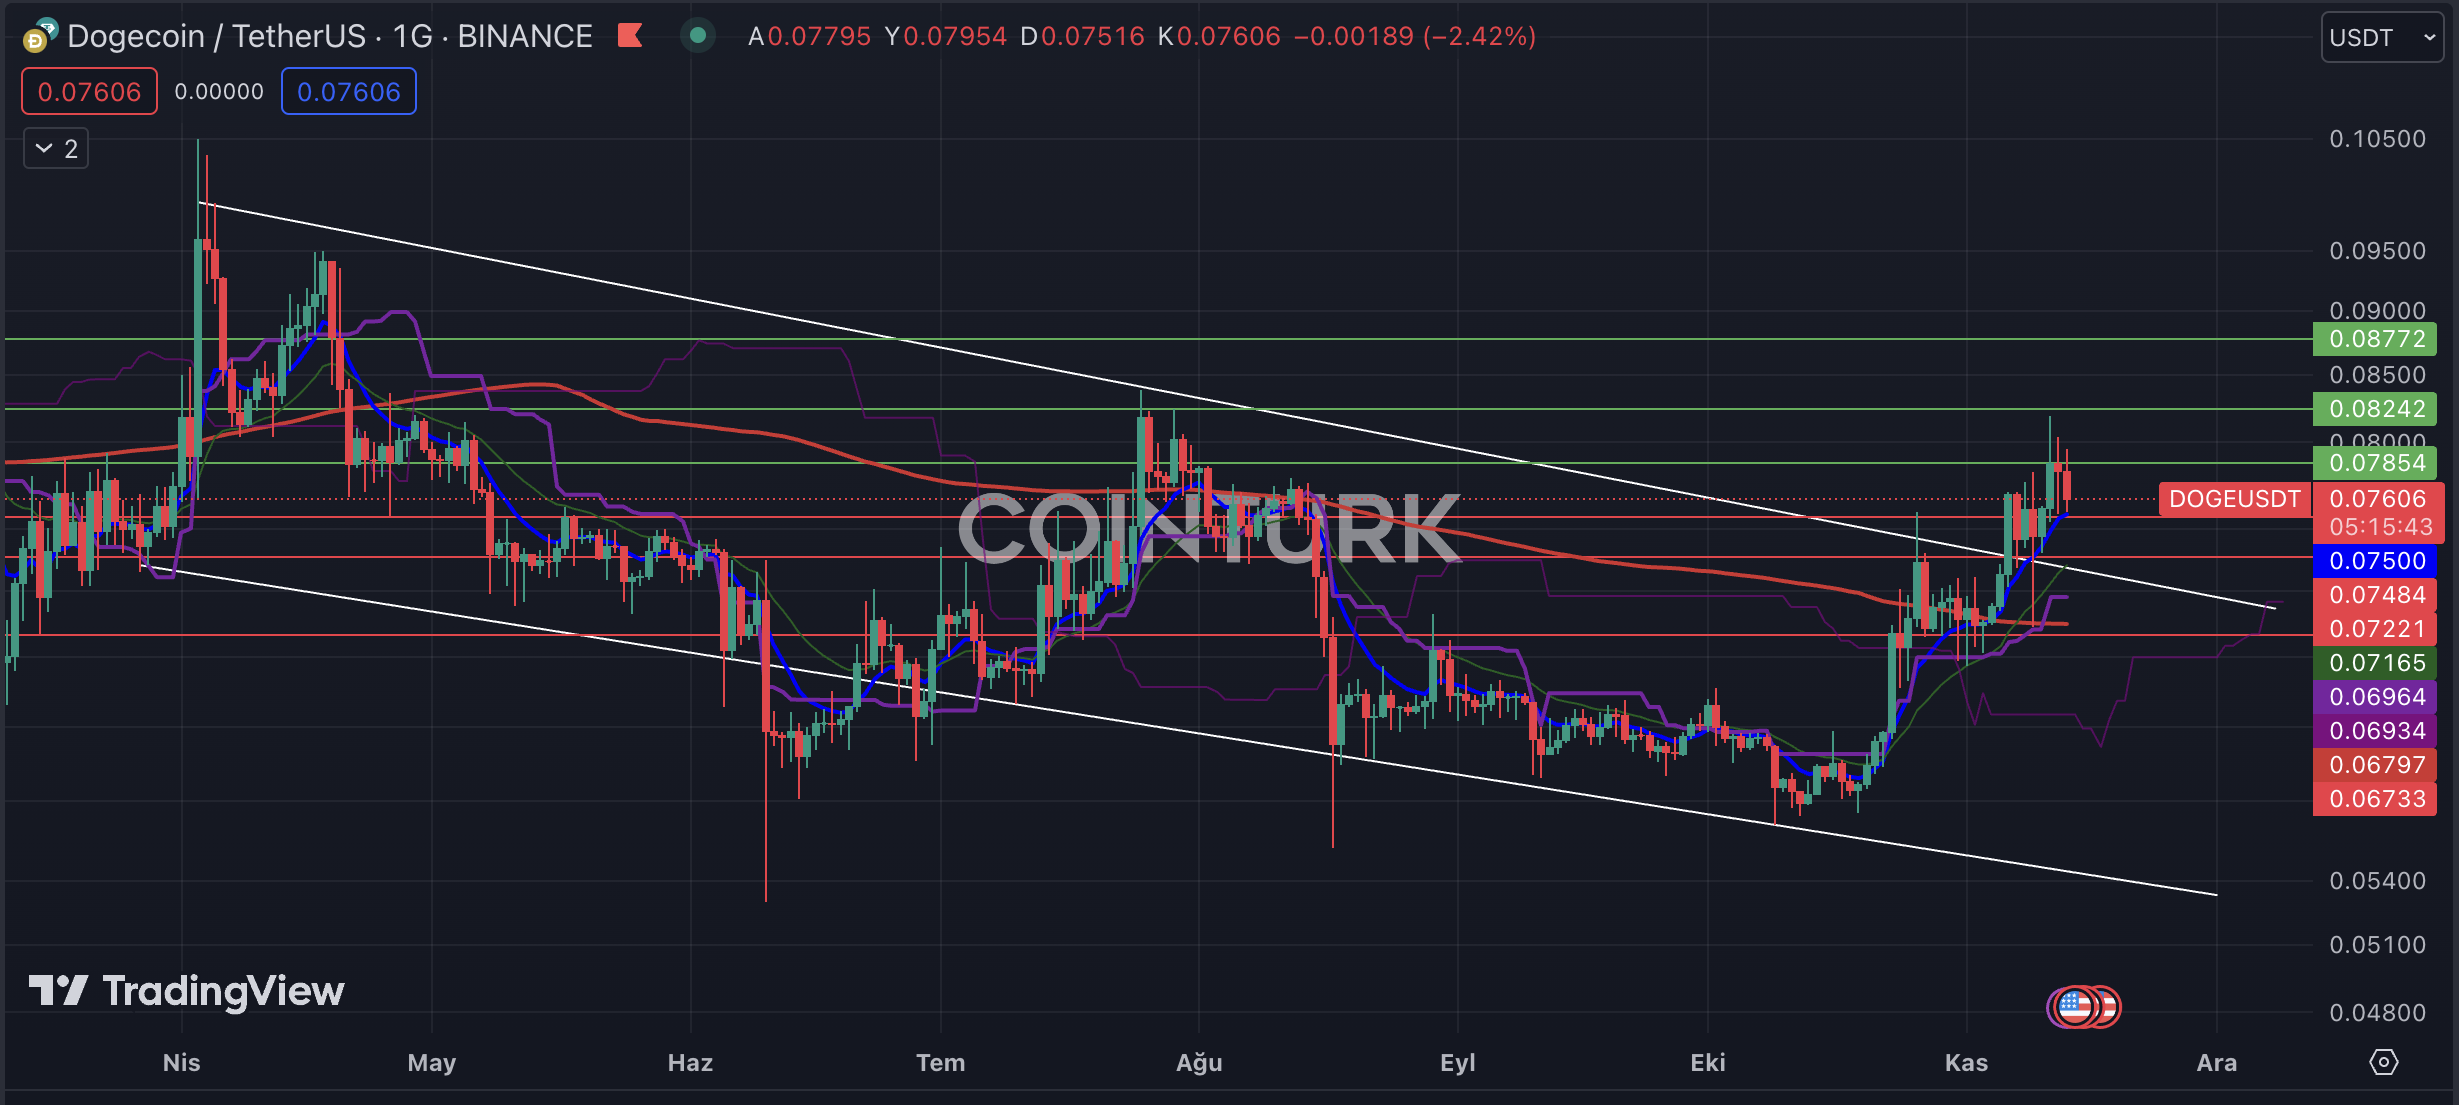
The first notable formation on the daily chart of Dogecoin is a descending channel pattern. This structure was surpassed when the resistance line was broken during the recent uptrend. Despite the dominance of selling pressure today, this formation may lead to a positive trend in the future.
Die erste bemerkenswerte Formation auf dem Tages-Chart von Dogecoin ist ein absteigendes Kanalmuster. Diese Struktur wurde übertroffen, als die Widerstandslinie während des jüngsten Aufwärtstrends durchbrochen wurde. Obwohl heute der Verkaufsdruck vorherrscht, könnte diese Formation in Zukunft zu einem positiven Trend führen.
The crucial support levels to watch for DOGE on the daily chart are $0.07484, $0.07221, and $0.06733. If the daily closing price falls below the $0.06733 level, it could lead to a return to the formation zone and a price below the EMA 200 (red line), resulting in a significant loss of momentum for DOGE.
Die entscheidenden Unterstützungsniveaus für DOGE auf dem Tages-Chart sind 0,07484 $, 0,07221 $ und 0,06733 $. Sollte der Tagesschlusskurs unter das Niveau von 0,06733 US-Dollar fallen, könnte dies zu einer Rückkehr in die Formationszone und einem Preis unter dem EMA 200 (rote Linie) führen, was zu einem erheblichen Schwungverlust für DOGE führen würde.
On the other hand, the important resistance levels to monitor for DOGE on the daily chart are $0.07854, $0.08242, and $0.08772. If the daily closing price exceeds the $0.08242 level, it could trigger an upward trend for DOGE.
Andererseits sind die wichtigen Widerstandsniveaus, die es für DOGE auf dem Tages-Chart zu überwachen gilt, 0,07854 $, 0,08242 $ und 0,08772 $. Sollte der Tagesschlusskurs die Marke von 0,08242 $ überschreiten, könnte dies einen Aufwärtstrend für DOGE auslösen.

Dogecoin Two-Hour Chart Analysis
Analyse des zweistündigen Dogecoin-Charts
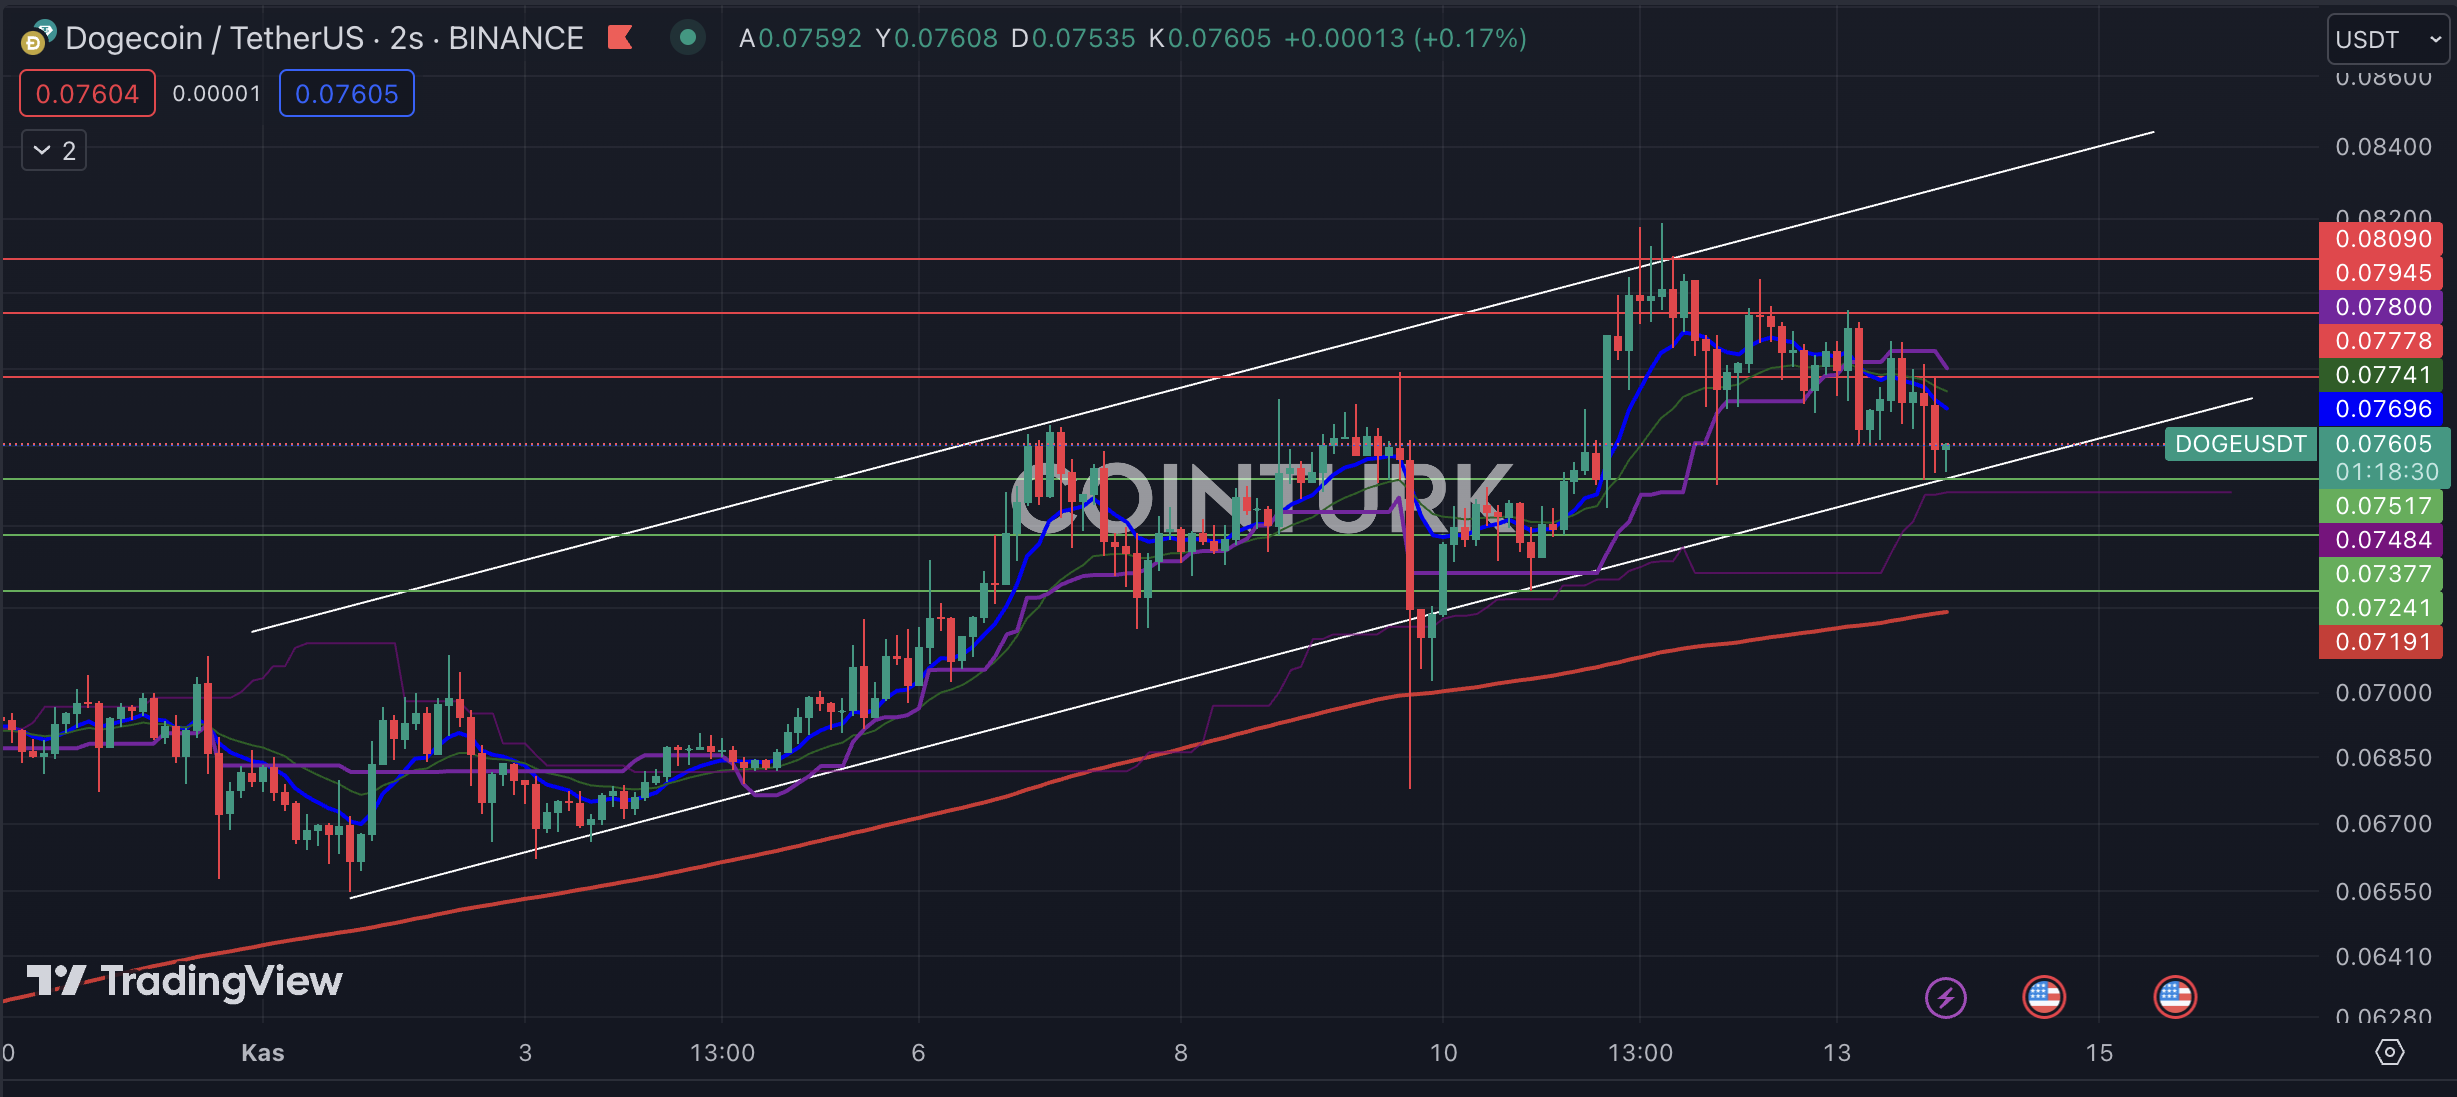
The first formation that stands out on the two-hour chart for DOGE is an ascending channel pattern. The breakdown of support on November 10th and three consecutive bar closures below this formation indicate a bear trap for investors. However, the presence of DOGE above the support line in recent bar closures suggests a significant waiting period.
Die erste Formation, die auf dem Zwei-Stunden-Chart von DOGE auffällt, ist ein aufsteigendes Kanalmuster. Der Zusammenbruch der Unterstützung am 10. November und drei aufeinanderfolgende Balkenschließungen unterhalb dieser Formation deuten auf eine Bärenfalle für Anleger hin. Das Vorhandensein von DOGE über der Unterstützungslinie bei den jüngsten Börsenschließungen deutet jedoch auf eine erhebliche Wartezeit hin.
The crucial support levels to watch for DOGE on the two-hour chart are $0.07517, $0.07377, and $0.07241. If the bar closes below the $0.07517 level, it will disrupt the formation structure.
Die entscheidenden Unterstützungsniveaus für DOGE auf dem Zwei-Stunden-Chart sind 0,07517 $, 0,07377 $ und 0,07241 $. Wenn der Balken unter dem Niveau von 0,07517 $ schließt, wird die Formationsstruktur gestört.
Regarding resistance levels, the important levels to observe for DOGE on the two-hour chart are $0.07778, $0.07945, and $0.08090. A bar closure above the major obstacle of $0.08090 will ignite a new upward trend for DOGE.
Was die Widerstandsniveaus betrifft, sind die wichtigen Niveaus, die es für DOGE auf dem Zwei-Stunden-Chart zu beobachten gilt, 0,07778 $, 0,07945 $ und 0,08090 $. Ein Kursschluss über dem Haupthindernis von 0,08090 US-Dollar wird einen neuen Aufwärtstrend für DOGE auslösen.

Weiterlesen: https://en.coin-turk.com/analysis-of-dogecoin-charts-diving-into-technical-indicators/


 Optimisus
 Optimisus
 Optimisus
 Thecryptoupdates
 DogeHome
 The Crypto Times
 Coincu
 Optimisus
 Coin_Gabbar


