Crypto Price Prediction: In January, the crypto market led by Bitcoin was on a rollercoaster. The anticipation for spot BTC ETFs in Q4 ignited a commendable rally even in altcoins.
However, at the peak of the green light news from the Securities and Exchange Commission (SEC), a minor uptick in the price of Bitcoin to $49,000 culminated in sell-the-news activities and coupled with the subsequent market doldrums saw the largest digital asset plummet below $39,000.
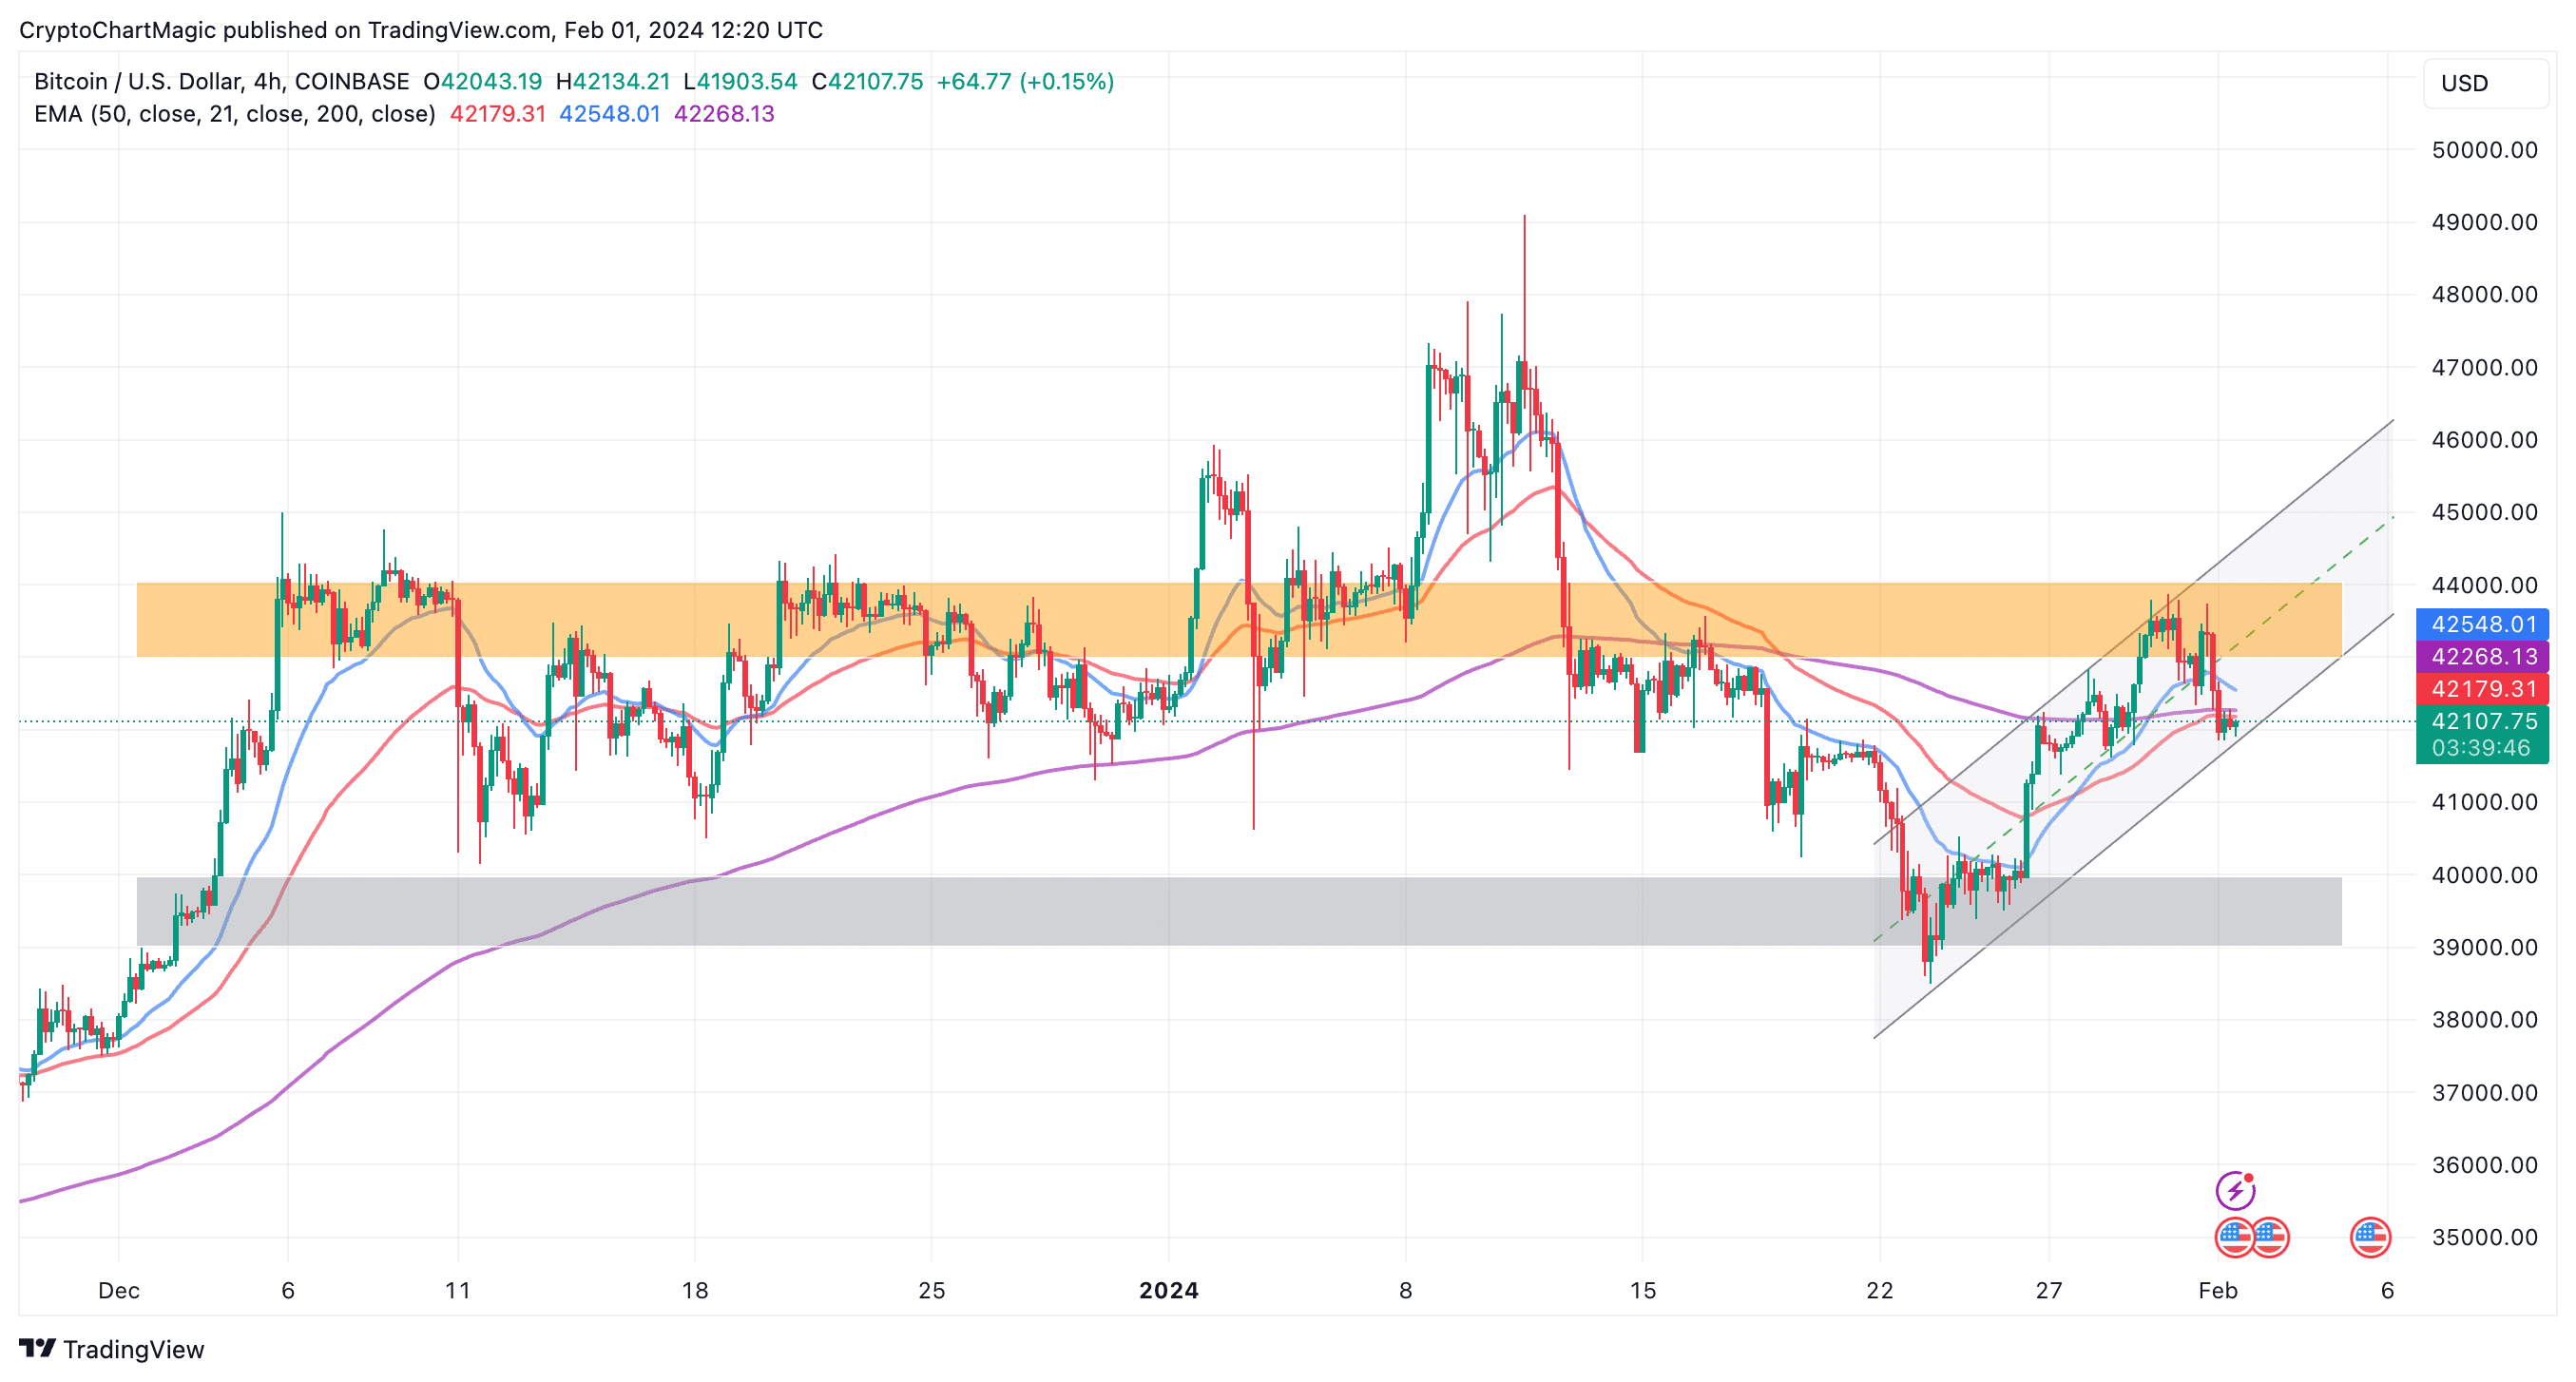
Although the last week of January was marked by widespread recoveries, Bitcoin is stuck under range resistance at $43,000. Similarly, Ethereum is back to trading in the range between $2,200 and $2,400 following a major spike to $28,000.
For many traders, the pullback after the spot ETF approval was a significant setback. However, experts like the founder of MN Trading, Michaël van de Poppe reckons the correction is healthy and that the best way to navigate is to buy dips.
Jerome Powell spoke about lowering interest rates, but is going to implement this at a later point than the markets were expecting.
Let's face reality: rates and yields have peaked. The trend is downwards, which means that the dips are to be bought for the time being. pic.twitter.com/oMy6ryUwiQ
— Michaël van de Poppe (@CryptoMichNL) February 1, 2024
1. Assessing Bitcoin (BTC) Price Technical Structure, Are Dips Profitable?
It is not an easy task to time market bottoms, especially in the crypto industry. Investors are safe to buy in key ranges following a correction from a recent peak.
For instance, Bitcoin’s slump under $39,000 presented important buy zones. A dollar-cost averaging strategy if applied professionally would ensure that no dips are missed, especially with the halving in a little over two months.
Analysts at Rekt Capital pointed out via a post on X that while BTC rebounded above $43,000, it was not able to break the range resistance around $43,800.
Reflecting this bearish outlook is the Relative Strength Index (RSI), which holds below its downtrend resistance. For Bitcoin to come out of the downtrend, the RSI needs to move higher.
Bitcoin was able to revisit its red Range High resistance (~$43800) but has since rejected to form a Lower High (black)
In the meantime, the RSI is still at its downtrend resistance
The RSI needs to break this downtrend if price is to move higher$BTC #Crypto #Bitcoin https://t.co/da6foTzPwg pic.twitter.com/S8e3lpxZyj
— Rekt Capital (@rektcapital) February 1, 2024
Support provided by the falling channel’s lower boundary may help keep Bitcoin buoyant above $42,000 but due to resistance at the 50 EMA and the 200 EMA, it would be a tall order to resume the uptrend.

In the foreseeable future, Bitcoin price might settle between the colored bands on the chart consolidating. A pre-halving rally will break the trend, pushing for a debut above $50,000.
Read also: What Is The Price Prediction For ETH In February 2024?
ApeCoin (APE) Price On The Move Above $1.5
Traders are doubling down on their efforts to buy into ApeCoin. In 24 hours, the web3 token increased 8% to $1.51, underlining the growing interest in the token backing a staggering 107% spike in the trading volume to $85 million.
ApeCoin boasts a market cap of $558 million, placing it at #102 among other cryptocurrencies.
A buy signal from the Moving Average Convergence Divergence (MACD) indicator crossover implies that the trend reversal is just getting started.
With a break above the red band on the chart, APE could steady the uptrend to above $5.

Captain Faibik, a renowned trader agreed with APE’s bullish theory via a post on X. Based on the daily chart he shared, ApeCoin “seems like bottomed out & ready to break the major trendline,” hinting at a massive move above $5.
$APE #Apecoin Seems like bottomed out & Ready to Break the Major Trendline..📈 pic.twitter.com/1GOtytFC2b
— Captain Faibik (@CryptoFaibik) February 1, 2024
Celestia (TIA) Eyes $20
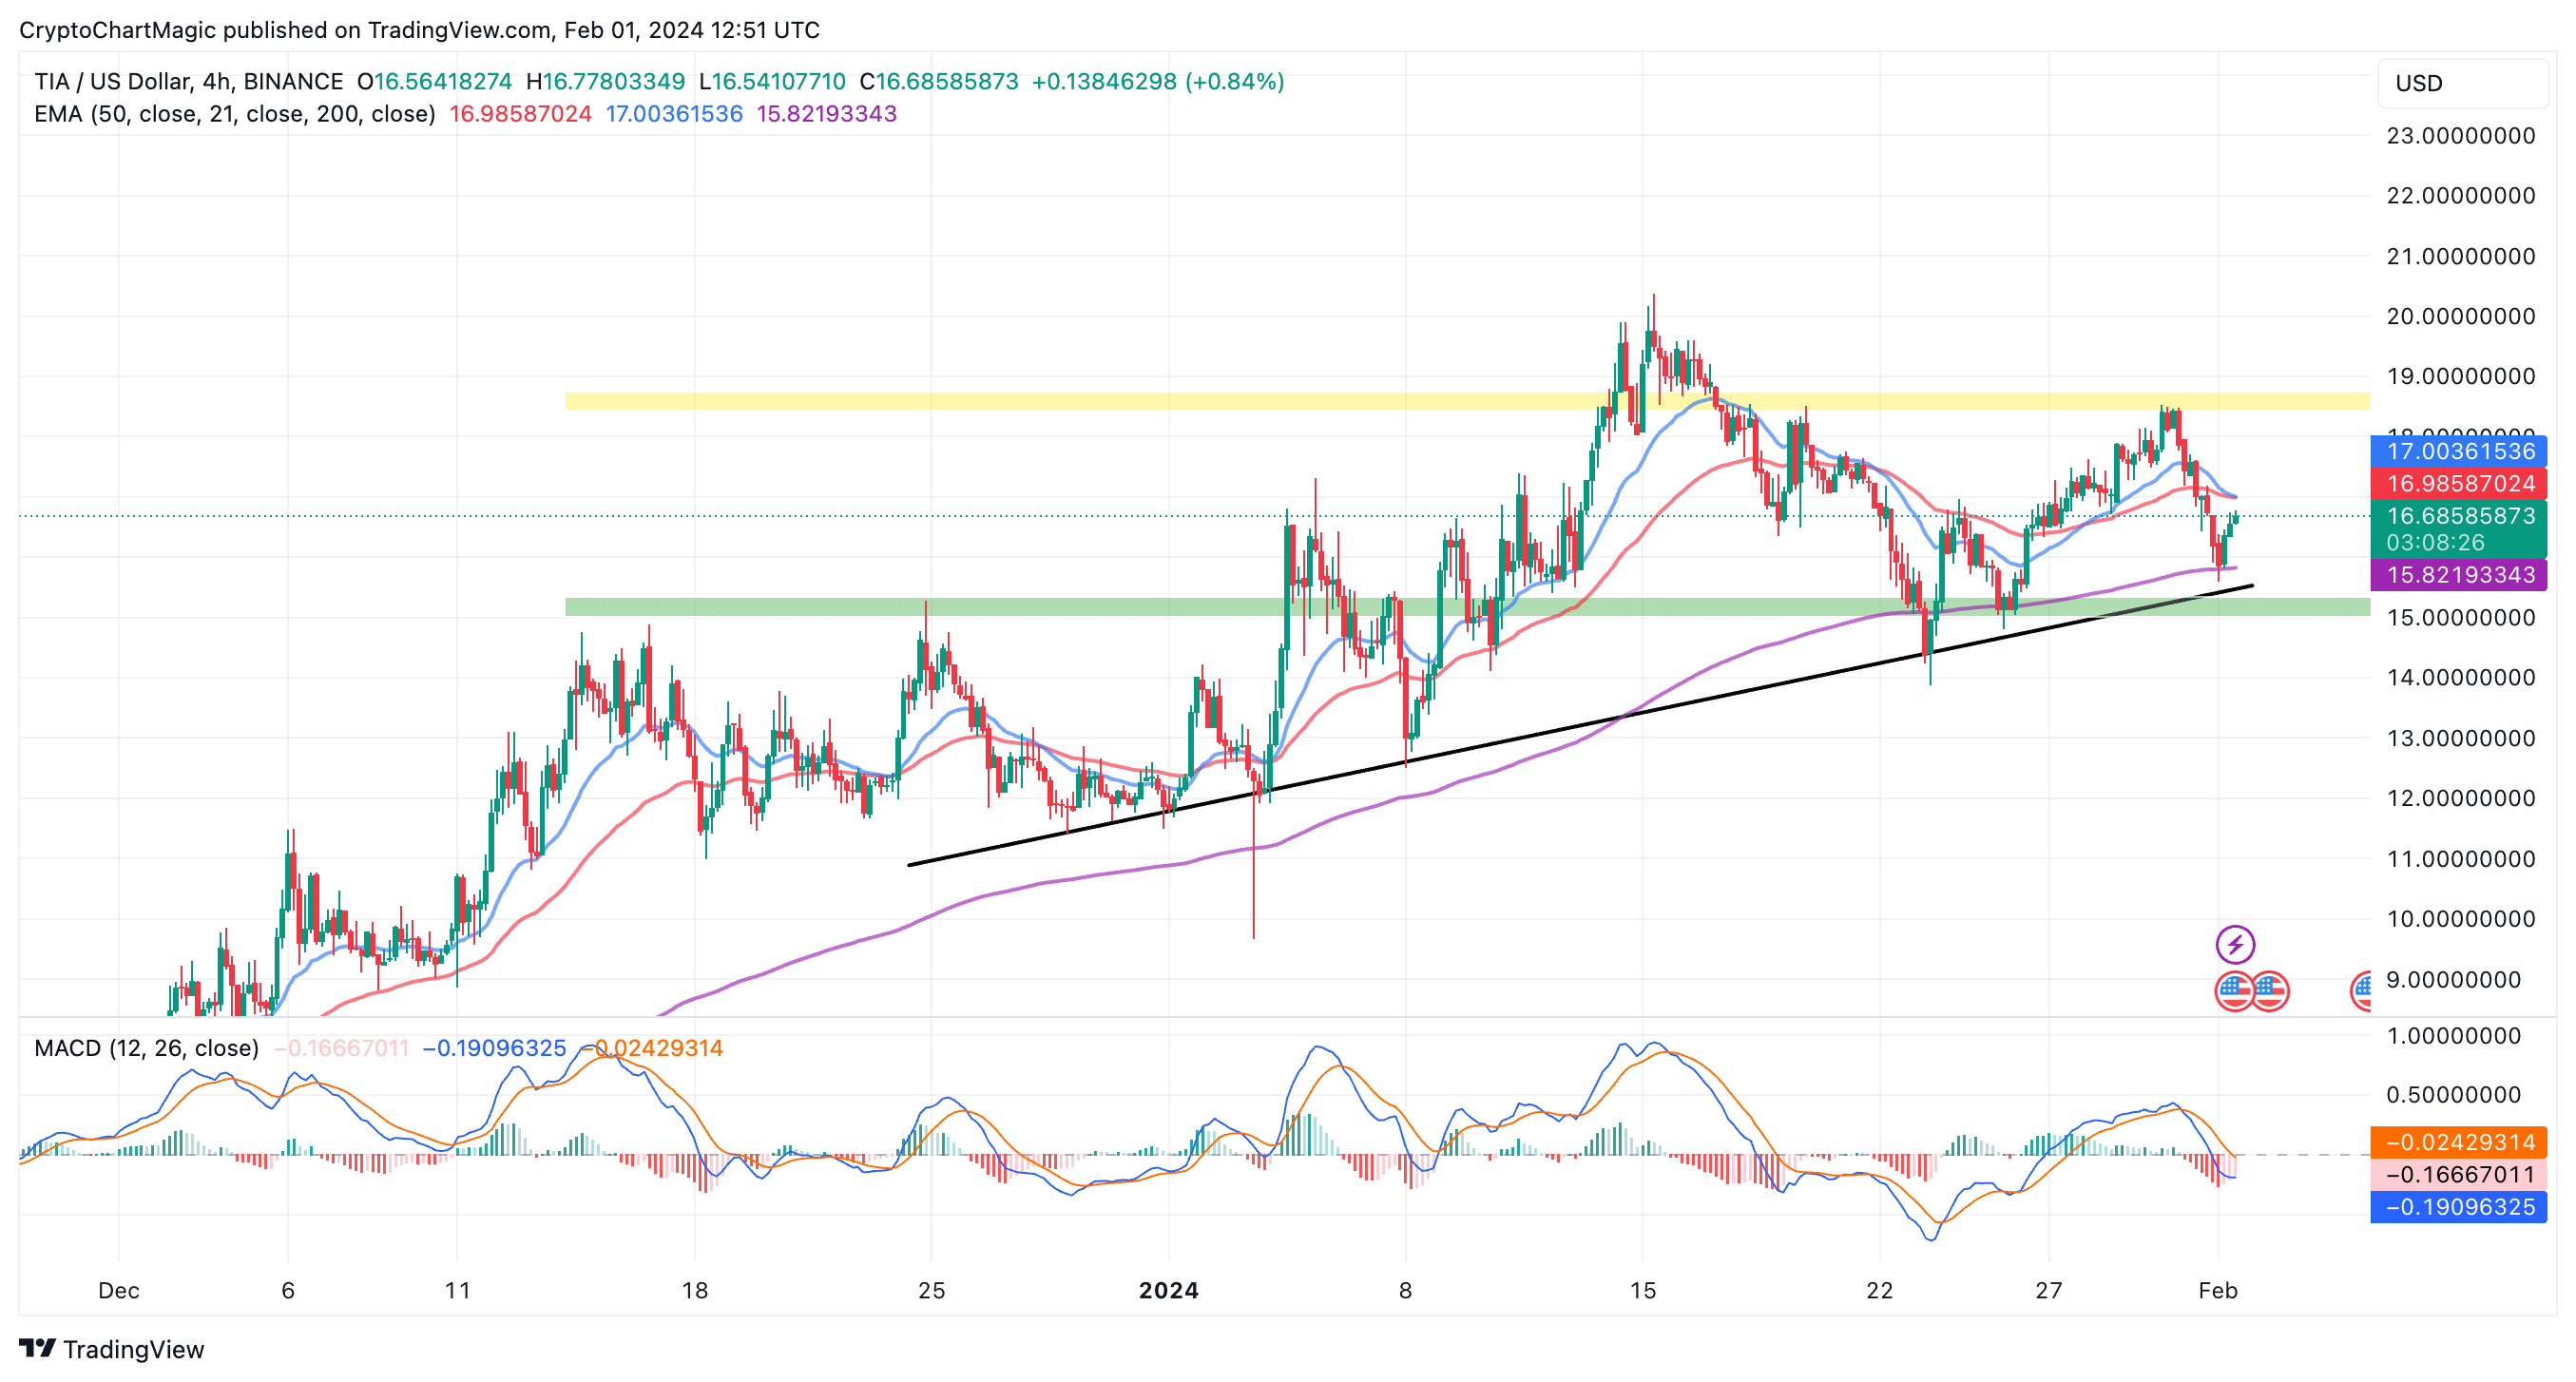
After retesting range low support at $15, TIA is holding at $16.75 during US business hours on Thursday. A narrowed technical outlook also places Celestia in a wide range between $15 and $18.5 (yellow band).
Ascending to the range high resistance at $18.5 is possible but TIA could encounter delay at $17 — a confluence level formed by the 50 EMA and the 20 EMA.
On the downside, the 20 EMA at $15.82 will come in handy to reduce the impact of the selling pressure toward the range of low support.
Traders may want to closely watch out for a buy signal from the MACD. As the blue MACD line crosses above the red signal line, a signal to buy TIA will manifest. There’s a high probability Celestia will retest $20 in the next few days as opposed to sliding to $12.


 Optimisus
 Optimisus
 Optimisus
 Thecryptoupdates
 DogeHome
 The Crypto Times
 Coincu
 Optimisus
 Coin_Gabbar


