

Crypto Price Prediction: In January, the crypto market led by Bitcoin was on a rollercoaster. The anticipation for spot BTC ETFs in Q4 ignited a commendable rally even in altcoins.
仮想通貨価格の予測: 1 月、ビットコインが主導する仮想通貨市場はジェットコースターにありました。第4四半期のスポットBTC ETFへの期待により、アルトコインでも称賛に値する上昇が起こりました。
However, at the peak of the green light news from the Securities and Exchange Commission (SEC), a minor uptick in the price of Bitcoin to $49,000 culminated in sell-the-news activities and coupled with the subsequent market doldrums saw the largest digital asset plummet below $39,000.
しかし、証券取引委員会(SEC)からのゴーサインニュースのピーク時に、ビットコインの価格が49,000ドルまで若干上昇したことで、売り込み活動が最高潮に達し、その後の市場の低迷と相まって、最大のデジタル資産が発生しました。 39,000ドルを下回る急落。
Although the last week of January was marked by widespread recoveries, Bitcoin is stuck under range resistance at $43,000. Similarly, Ethereum is back to trading in the range between $2,200 and $2,400 following a major spike to $28,000.
1月の最終週は広範な回復が見られたものの、ビットコインは43,000ドルのレンジ抵抗の下で立ち往生している。同様に、イーサリアムも28,000ドルへの大幅な急騰の後、2,200ドルから2,400ドルの範囲での取引に戻っています。
For many traders, the pullback after the spot ETF approval was a significant setback. However, experts like the founder of MN Trading, Michaël van de Poppe reckons the correction is healthy and that the best way to navigate is to buy dips.
多くのトレーダーにとって、スポットETF承認後の反動は大きな挫折だった。しかし、MNトレーディングの創設者ミカエル・ファン・デ・ポッペ氏のような専門家は、調整は健全であり、乗り切る最善の方法は押し目を買うことだと考えている。
Jerome Powell spoke about lowering interest rates, but is going to implement this at a later point than the markets were expecting.
ジェローム・パウエル議長は金利引き下げについて語ったが、市場の予想よりも遅い時点で実施される予定だ。
Let's face reality: rates and yields have peaked. The trend is downwards, which means that the dips are to be bought for the time being. pic.twitter.com/oMy6ryUwiQ
現実を直視しましょう。金利と利回りはピークに達しています。トレンドは下降傾向なので、当面は押し目買いとなります。 pic.twitter.com/oMy6ryUwiQ
— Michaël van de Poppe (@CryptoMichNL) February 1, 2024
— ミカエル・ヴァン・デ・ポッペ (@CryptoMichNL) 2024 年 2 月 1 日
1. Assessing Bitcoin (BTC) Price Technical Structure, Are Dips Profitable?
1. ビットコイン(BTC)価格の技術構造の評価、ディップスは儲かるのか?
It is not an easy task to time market bottoms, especially in the crypto industry. Investors are safe to buy in key ranges following a correction from a recent peak.
特に仮想通貨業界では、市場の底値を見極めるのは簡単なことではありません。投資家は、最近のピークからの調整を受けて主要なレンジで購入するのが安全です。
For instance, Bitcoin’s slump under $39,000 presented important buy zones. A dollar-cost averaging strategy if applied professionally would ensure that no dips are missed, especially with the halving in a little over two months.
たとえば、ビットコインの39,000ドル以下の下落は重要な買いゾーンを示しました。ドルコスト平均戦略を専門的に適用すれば、特に 2 か月強で半減する場合には、押し目を見逃すことはありません。
Analysts at Rekt Capital pointed out via a post on X that while BTC rebounded above $43,000, it was not able to break the range resistance around $43,800.
レクト・キャピタルのアナリストらは、Xへの投稿を通じて、BTCが4万3000ドルを超えて反発したものの、4万3800ドル付近のレンジ抵抗を突破できなかったと指摘した。
Reflecting this bearish outlook is the Relative Strength Index (RSI), which holds below its downtrend resistance. For Bitcoin to come out of the downtrend, the RSI needs to move higher.
この弱気見通しを反映しているのが、相対力指数(RSI)であり、下降トレンドの抵抗線を下回っている。ビットコインが下降トレンドから抜け出すには、RSIが上昇する必要があります。
#BTC
Bitcoin was able to revisit its red Range High resistance (~$43800) but has since rejected to form a Lower High (black)
ビットコインは、赤色のレンジ高値レジスタンス(約43,800ドル)を再訪することができましたが、その後、下限高値(黒色)を形成することを拒否しました。
In the meantime, the RSI is still at its downtrend resistance
その間、RSIは依然として下降トレンドの抵抗線にあります
The RSI needs to break this downtrend if price is to move higher$BTC #Crypto #Bitcoin https://t.co/da6foTzPwg pic.twitter.com/S8e3lpxZyj
価格が上昇する場合、RSIはこの下降傾向を打破する必要がある$BTC #Crypto #Bitcoin https://t.co/da6foTzPwg pic.twitter.com/S8e3lpxZyj
— Rekt Capital (@rektcapital) February 1, 2024
— Rekt Capital (@rektcapital) 2024 年 2 月 1 日
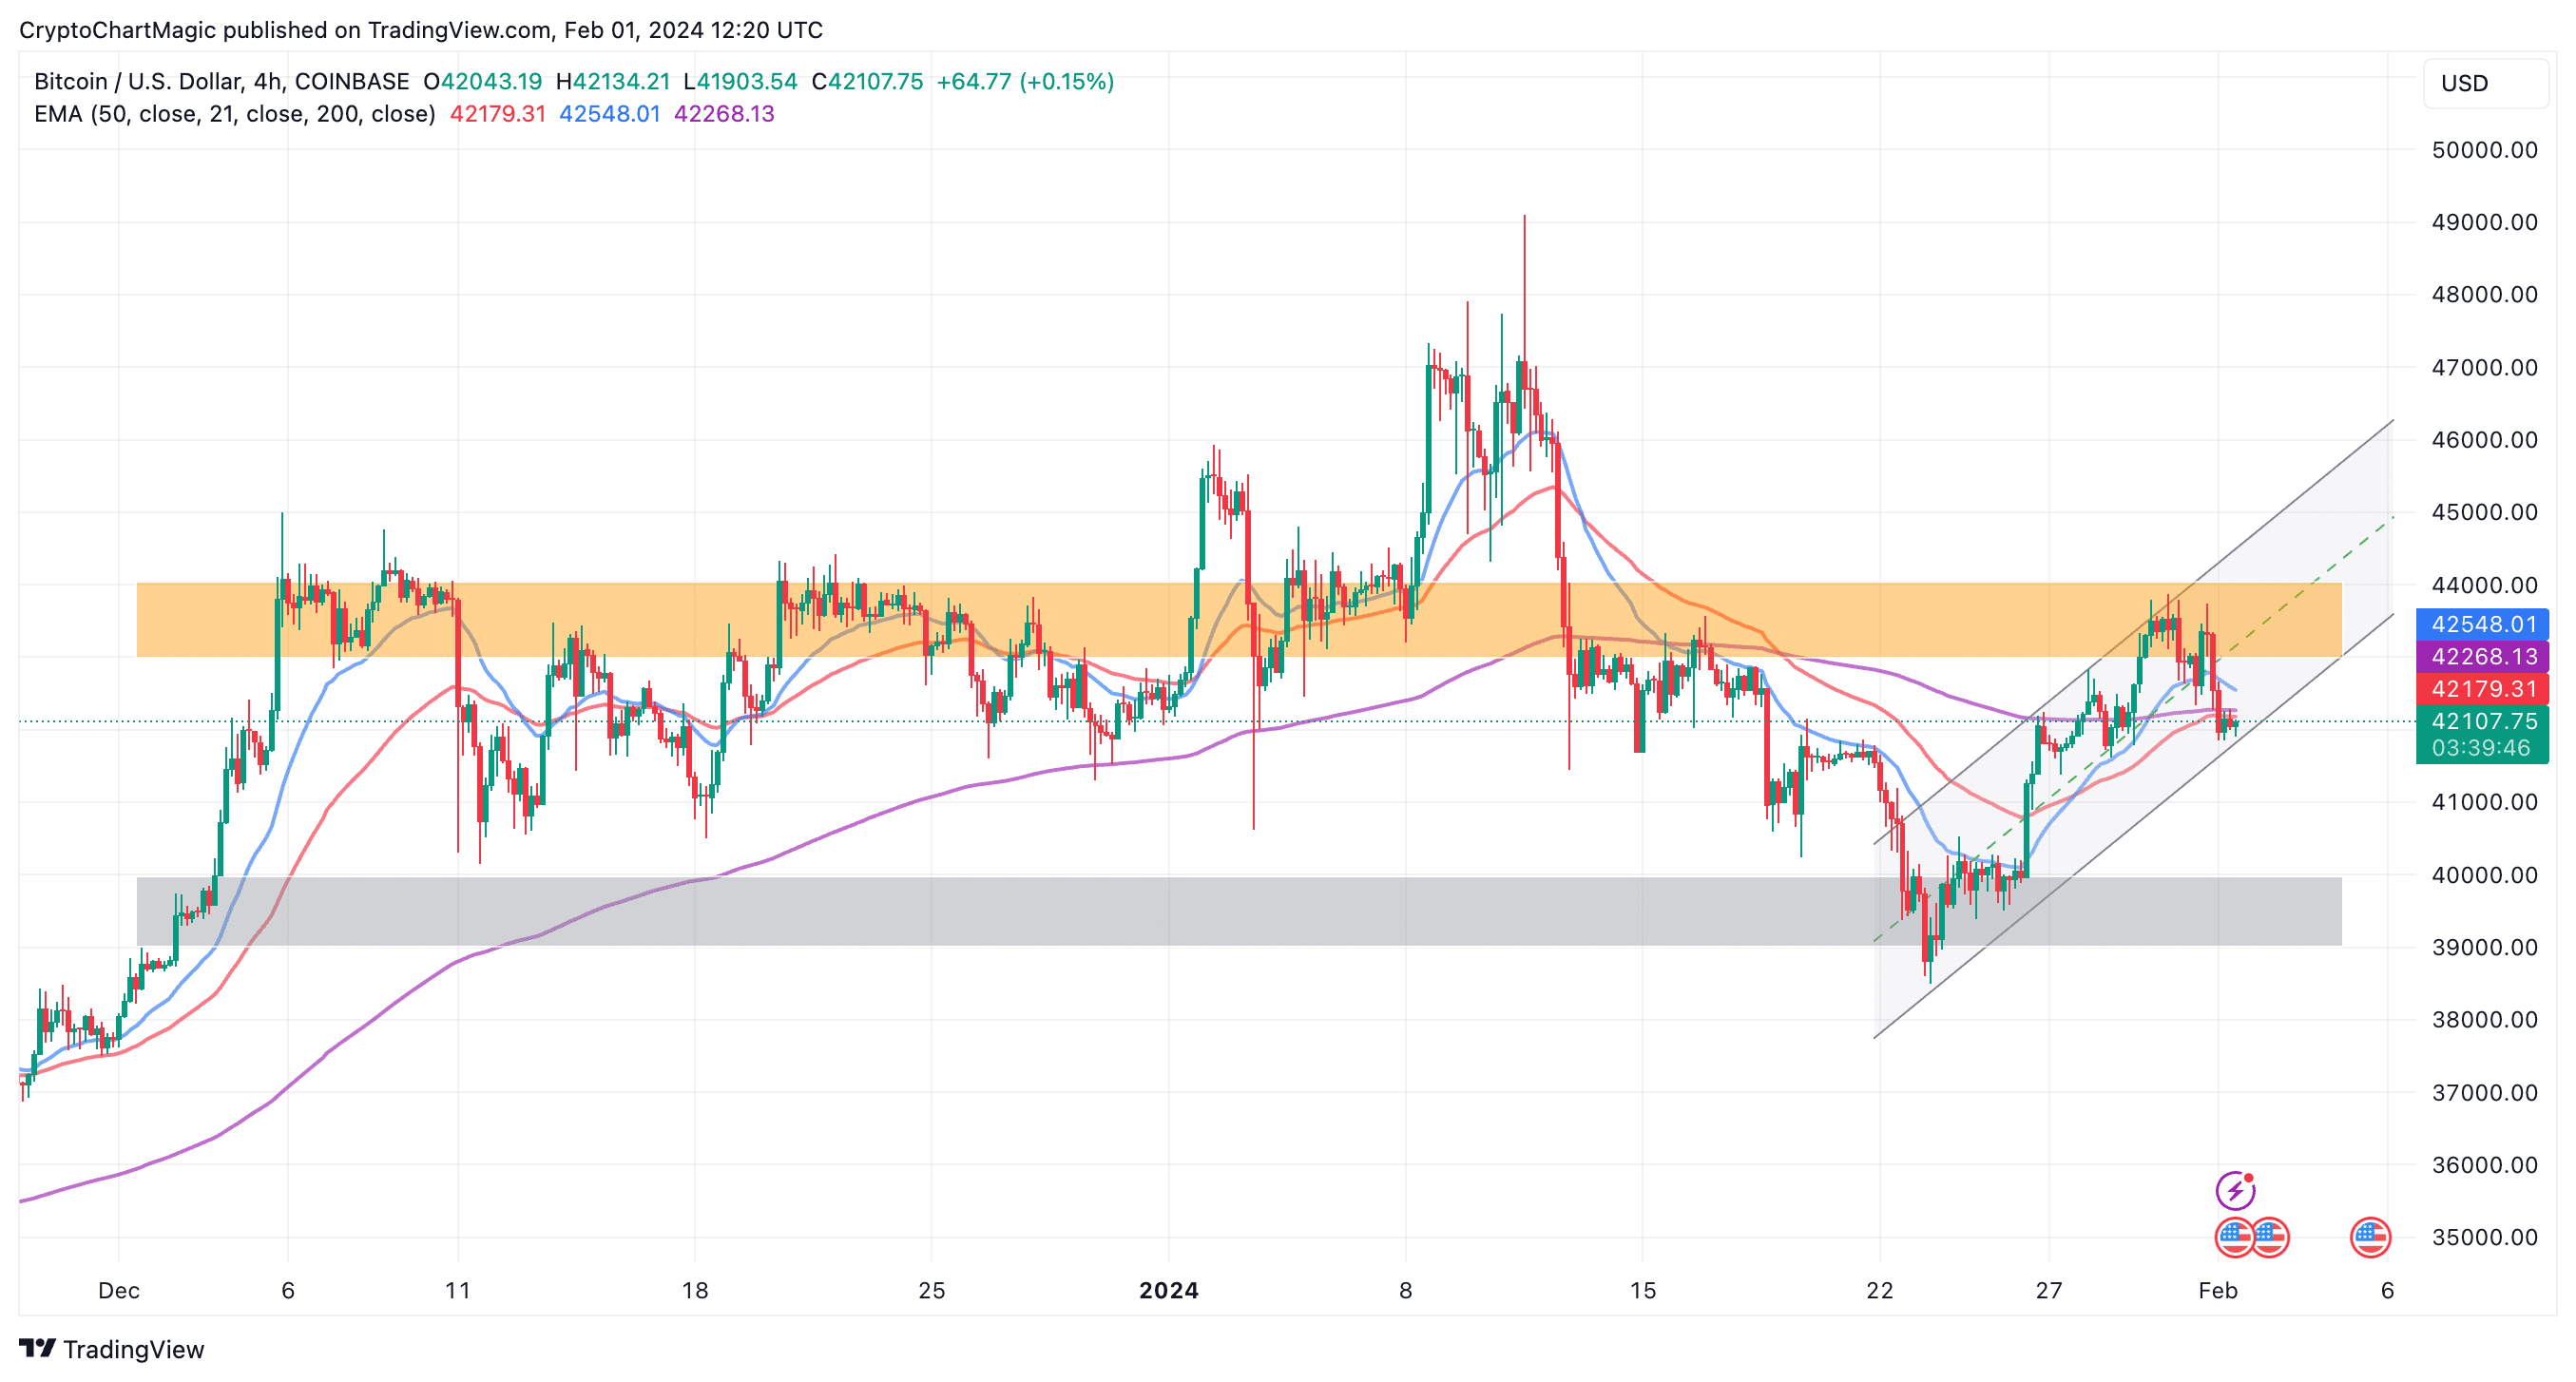
Support provided by the falling channel’s lower boundary may help keep Bitcoin buoyant above $42,000 but due to resistance at the 50 EMA and the 200 EMA, it would be a tall order to resume the uptrend.
下落チャネルの下限によってもたらされるサポートは、ビットコインを42,000ドル以上に浮かせ続けるのに役立つかもしれないが、50EMAと200EMAに抵抗があるため、上昇トレンドを再開するのは至難の業だろう。
BTC価格チャート |トレーディングビュー
In the foreseeable future, Bitcoin price might settle between the colored bands on the chart consolidating. A pre-halving rally will break the trend, pushing for a debut above $50,000.
近い将来、ビットコイン価格はチャート上の色分けされた帯の間で落ち着き、統合される可能性があります。半減期前の上昇相場はトレンドを打ち破り、デビューが5万ドルを超える可能性がある。
Read also: What Is The Price Prediction For ETH In February 2024?
こちらもお読みください: 2024 年 2 月の ETH の価格予測は何ですか?
ApeCoin (APE) Price On The Move Above $1.5
エイプコイン(APE)の価格は1.5ドルを超えて上昇中
Traders are doubling down on their efforts to buy into ApeCoin. In 24 hours, the web3 token increased 8% to $1.51, underlining the growing interest in the token backing a staggering 107% spike in the trading volume to $85 million.
トレーダーらはApeCoinへの買い入れに力を入れている。 24 時間で、web3 トークンは 8% 上昇して 1.51 ドルとなり、取引高が 107% 増加して 8,500 万ドルに達したという驚異的な急増を裏付けるトークンへの関心の高まりを強調しています。
ApeCoin boasts a market cap of $558 million, placing it at #102 among other cryptocurrencies.
ApeCoin は時価総額 5 億 5,800 万ドルを誇り、他の仮想通貨の中で 102 位にランクされています。
A buy signal from the Moving Average Convergence Divergence (MACD) indicator crossover implies that the trend reversal is just getting started.
移動平均収束ダイバージェンス (MACD) 指標のクロスオーバーからの買いシグナルは、トレンド反転が始まったばかりであることを意味します。
With a break above the red band on the chart, APE could steady the uptrend to above $5.
チャートの赤いバンドを上抜ければ、APEは上昇トレンドを5ドル以上に安定させる可能性がある。
APEの価格チャート |トレーディングビュー
Captain Faibik, a renowned trader agreed with APE’s bullish theory via a post on X. Based on the daily chart he shared, ApeCoin “seems like bottomed out & ready to break the major trendline,” hinting at a massive move above $5.
有名なトレーダーであるキャプテン・ファイビック氏は、Xへの投稿を通じてAPEの強気理論に同意した。同氏が共有した日足チャートによると、エイプコインは「底を打ち、主要トレンドラインを突破する準備ができているようだ」と、5ドルを超える大規模な動きを示唆している。
$APE #Apecoin Seems like bottomed out & Ready to Break the Major Trendline..📈 pic.twitter.com/1GOtytFC2b
$APE #Apecoin は底を打ったようで、主要トレンドラインを突破する準備ができています..📈 pic.twitter.com/1GOtytFC2b
— Captain Faibik (@CryptoFaibik) February 1, 2024
— キャプテン・ファイビック (@CryptoFaibik) 2024 年 2 月 1 日
Celestia (TIA) Eyes $20
セレスティア (TIA) アイズ $20
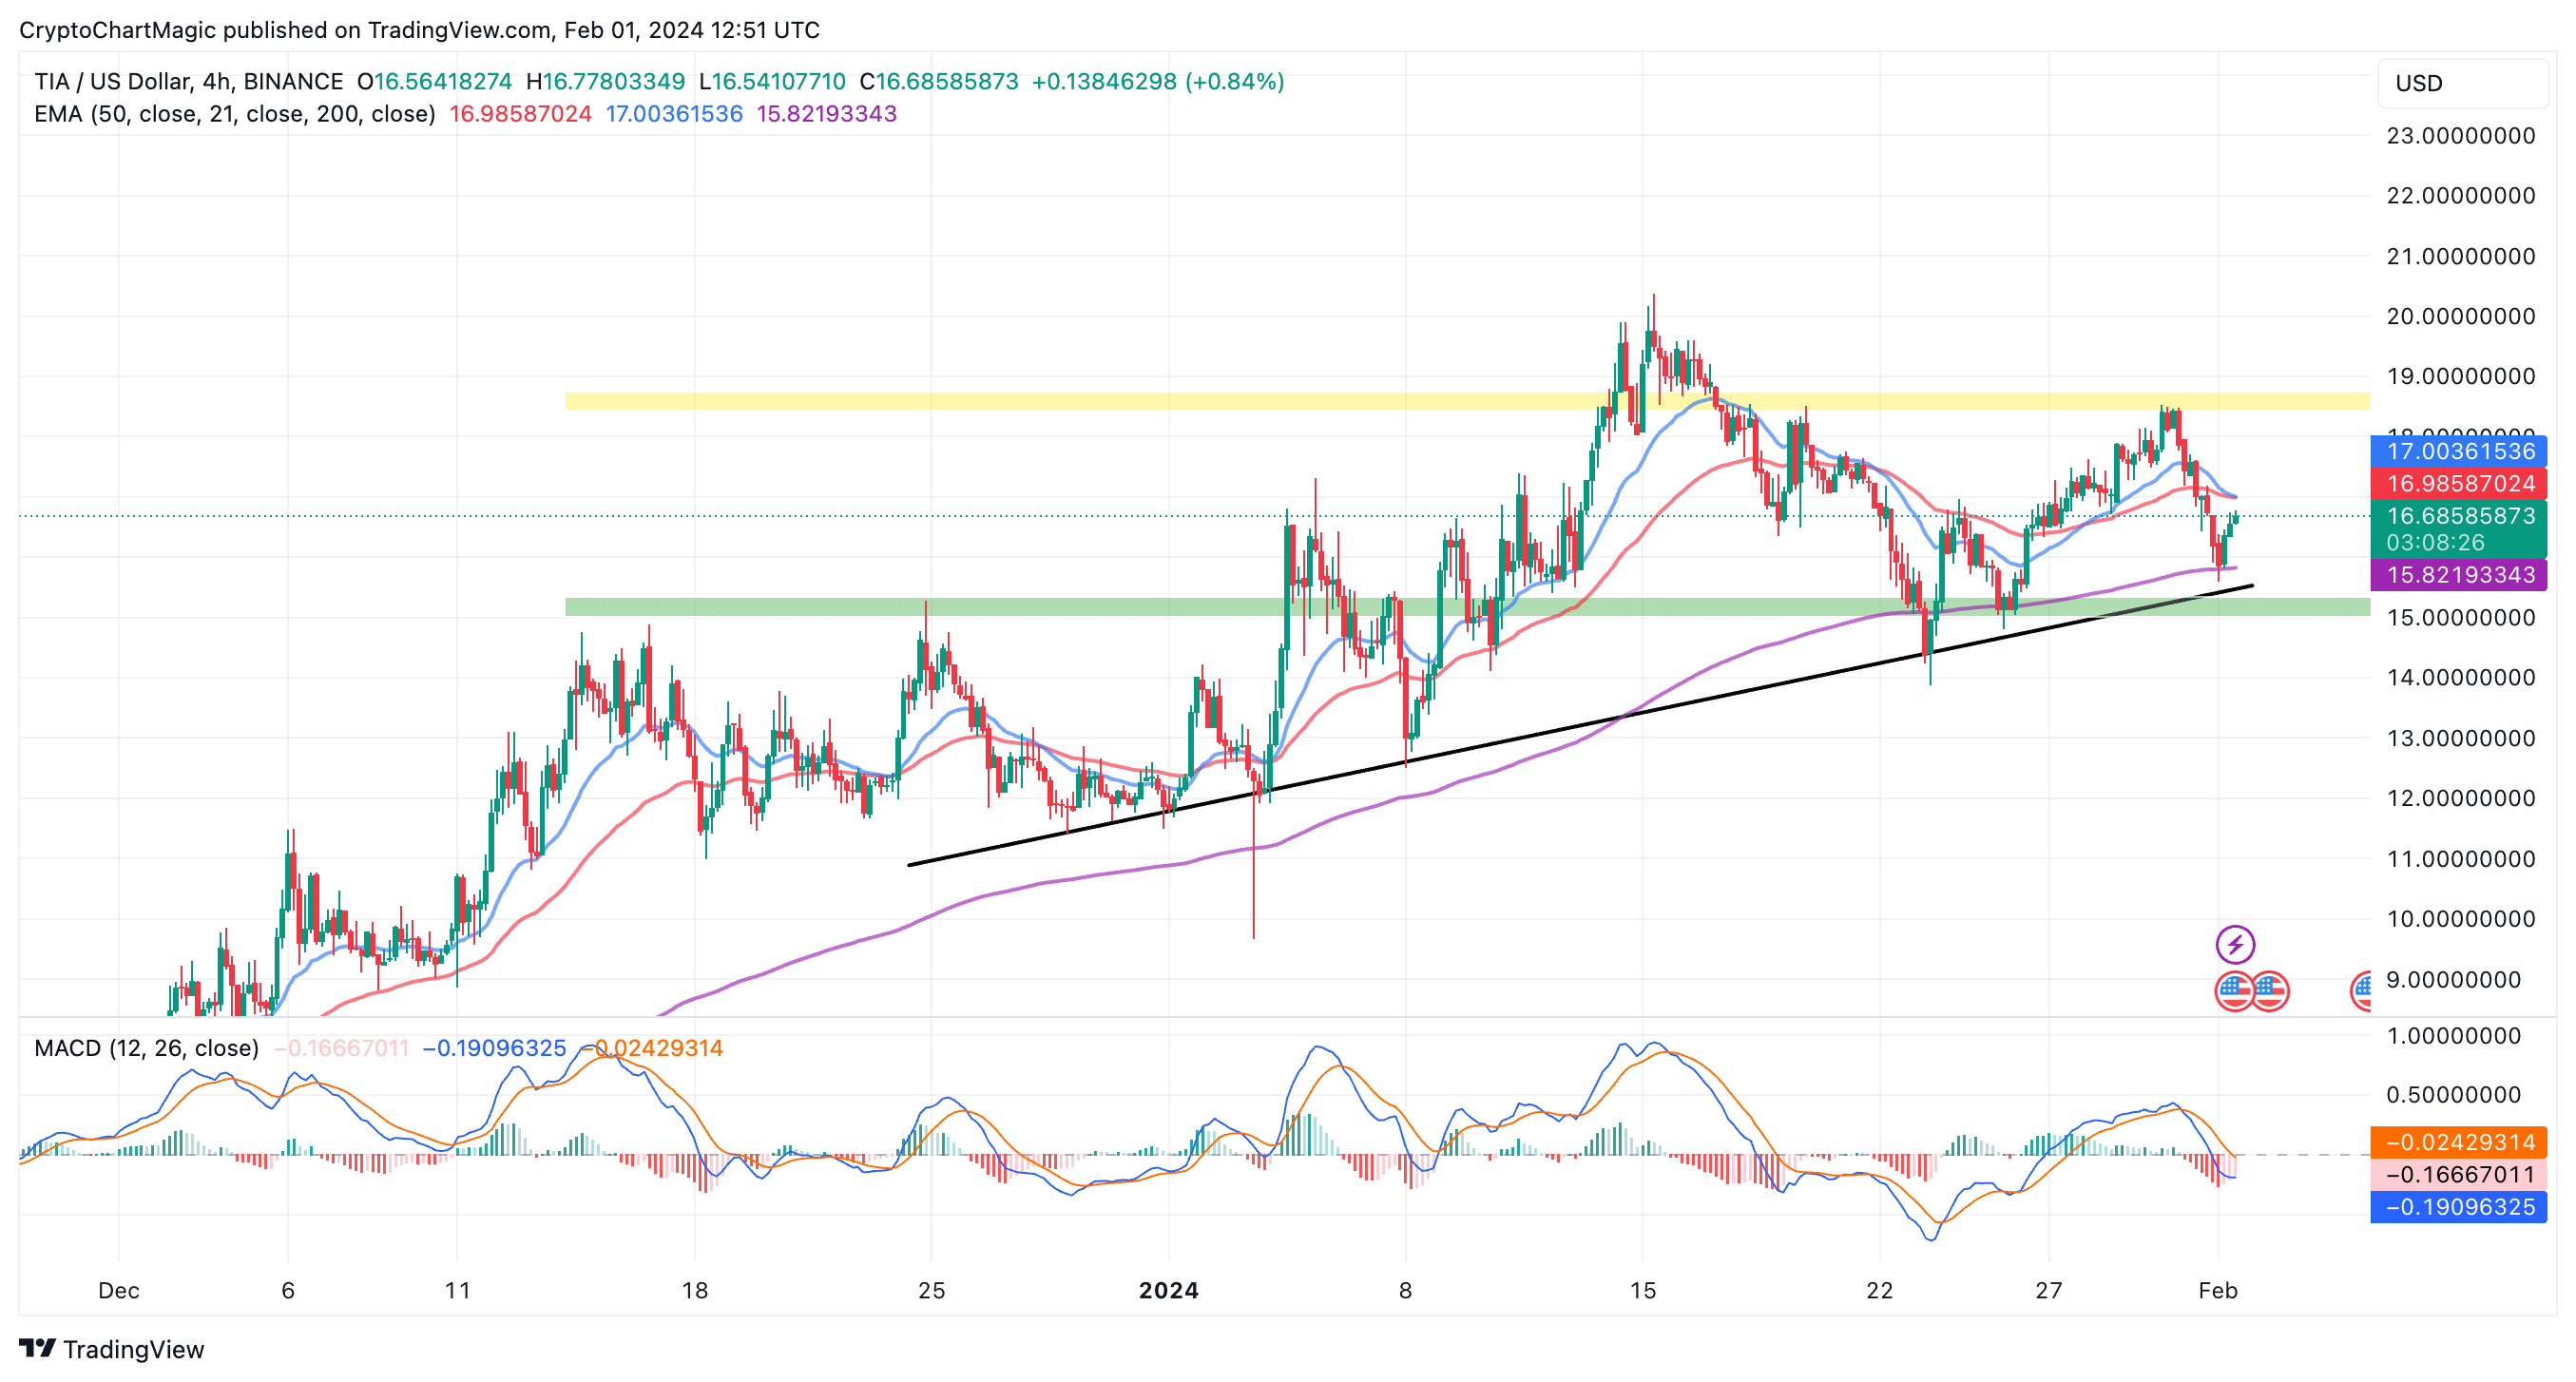
After retesting range low support at $15, TIA is holding at $16.75 during US business hours on Thursday. A narrowed technical outlook also places Celestia in a wide range between $15 and $18.5 (yellow band).
レンジの下位サポートである15ドルを再テストした後、TIAは木曜日の米国営業時間中16.75ドルを維持している。技術的な見通しを狭くすると、Celestia の価格は 15 ドルから 18.5 ドル(黄色の帯)の間の広い範囲になります。
Ascending to the range high resistance at $18.5 is possible but TIA could encounter delay at $17 — a confluence level formed by the 50 EMA and the 20 EMA.
18.5ドルのレンジ高抵抗まで上昇する可能性はあるが、TIAは17ドル(50EMAと20EMAによって形成される合流レベル)で遅延に遭遇する可能性がある。
On the downside, the 20 EMA at $15.82 will come in handy to reduce the impact of the selling pressure toward the range of low support.
下値としては、15.82ドルの20EMAは、低いサポートの範囲への売り圧力の影響を軽減するのに役立ちます。
Traders may want to closely watch out for a buy signal from the MACD. As the blue MACD line crosses above the red signal line, a signal to buy TIA will manifest. There’s a high probability Celestia will retest $20 in the next few days as opposed to sliding to $12.
トレーダーはMACDからの買いシグナルを注意深く監視する必要があるかもしれません。青いMACDラインが赤いシグナルラインの上を横切ると、TIAを買うシグナルが現れます。 Celestia が今後数日以内に 12 ドルにスライドするのではなく、20 ドルを再テストする可能性が高くなります。
Related Articles
関連記事
- Will SUI Price Hit New All-Time High In February Amid TVL Expansion?
- Dogecoin Price To Pump To $1 In February If Network Activity Keeps Surging
- Top 3 Altcoins To Buy Today January 31: Ethereum (ETH), XRP, Dogecoin (DOGE)
TVL拡大の中でSUI価格は2月に史上最高値を更新するか?
ネットワーク活動が急増し続ければ、ドージコインの価格は2月に1ドルに上昇する見通し
1月31日に今日購入すべきトップ3のアルトコイン:イーサリアム(ETH)、XRP、ドージコイン(DOGE)
 CoinPedia News
 CoinPedia News
 CoinsProbe
 DogeHome
 crypto.news
 Thecryptoupdates
 crypto.news
 BlockchainReporter
 Optimisus


