

Crypto Price Prediction: In January, the crypto market led by Bitcoin was on a rollercoaster. The anticipation for spot BTC ETFs in Q4 ignited a commendable rally even in altcoins.
加密貨幣價格預測:一月份,以比特幣為首的加密貨幣市場起伏。第四季對現貨 BTC ETF 的預期甚至引發了山寨幣的值得稱讚的反彈。
However, at the peak of the green light news from the Securities and Exchange Commission (SEC), a minor uptick in the price of Bitcoin to $49,000 culminated in sell-the-news activities and coupled with the subsequent market doldrums saw the largest digital asset plummet below $39,000.
然而,在美國證券交易委員會 (SEC) 批准訊息的高峰期,比特幣價格小幅上漲至 49,000 美元,最終導致拋售訊息活動,加上隨後的市場低迷,比特幣成為最大的數位資產暴跌至39,000美元以下。
Although the last week of January was marked by widespread recoveries, Bitcoin is stuck under range resistance at $43,000. Similarly, Ethereum is back to trading in the range between $2,200 and $2,400 following a major spike to $28,000.
儘管 1 月最後一周出現了廣泛的復甦,但比特幣仍受困於 43,000 美元的區間阻力位。同樣,以太坊在大幅飆升至 28,000 美元之後又回到了 2,200 美元至 2,400 美元之間的交易區間。
For many traders, the pullback after the spot ETF approval was a significant setback. However, experts like the founder of MN Trading, Michaël van de Poppe reckons the correction is healthy and that the best way to navigate is to buy dips.
對於許多交易者來說,現貨 ETF 批准後的回檔是一個重大挫折。然而,MN Trading 創始人 Michaël van de Poppe 等專家認為,調整是健康的,最好的應對方式是逢低買進。
Jerome Powell spoke about lowering interest rates, but is going to implement this at a later point than the markets were expecting.
傑羅姆·鮑威爾談到了降息,但實施時間將晚於市場預期。
Let's face reality: rates and yields have peaked. The trend is downwards, which means that the dips are to be bought for the time being. pic.twitter.com/oMy6ryUwiQ
讓我們面對現實:利率和收益率已經見頂。趨勢是向下的,這意味著暫時逢低買入。 pic.twitter.com/oMy6ryUwiQ
— Michaël van de Poppe (@CryptoMichNL) February 1, 2024
— Michaël van de Poppe (@CryptoMichNL) 2024 年 2 月 1 日
1. Assessing Bitcoin (BTC) Price Technical Structure, Are Dips Profitable?
1. 評估比特幣(BTC)價格技術結構,下跌是否有利可圖?
It is not an easy task to time market bottoms, especially in the crypto industry. Investors are safe to buy in key ranges following a correction from a recent peak.
要把握市場底部的時機並不是一件容易的事,尤其是在加密貨幣產業。在近期高峰迴調後,投資者可以安全地在關鍵區間買入。
For instance, Bitcoin’s slump under $39,000 presented important buy zones. A dollar-cost averaging strategy if applied professionally would ensure that no dips are missed, especially with the halving in a little over two months.
例如,比特幣跌破 39,000 美元就出現了重要的買入區域。如果專業地應用美元成本平均策略,將確保不會錯過任何下跌,尤其是在兩個多月後減半的情況下。
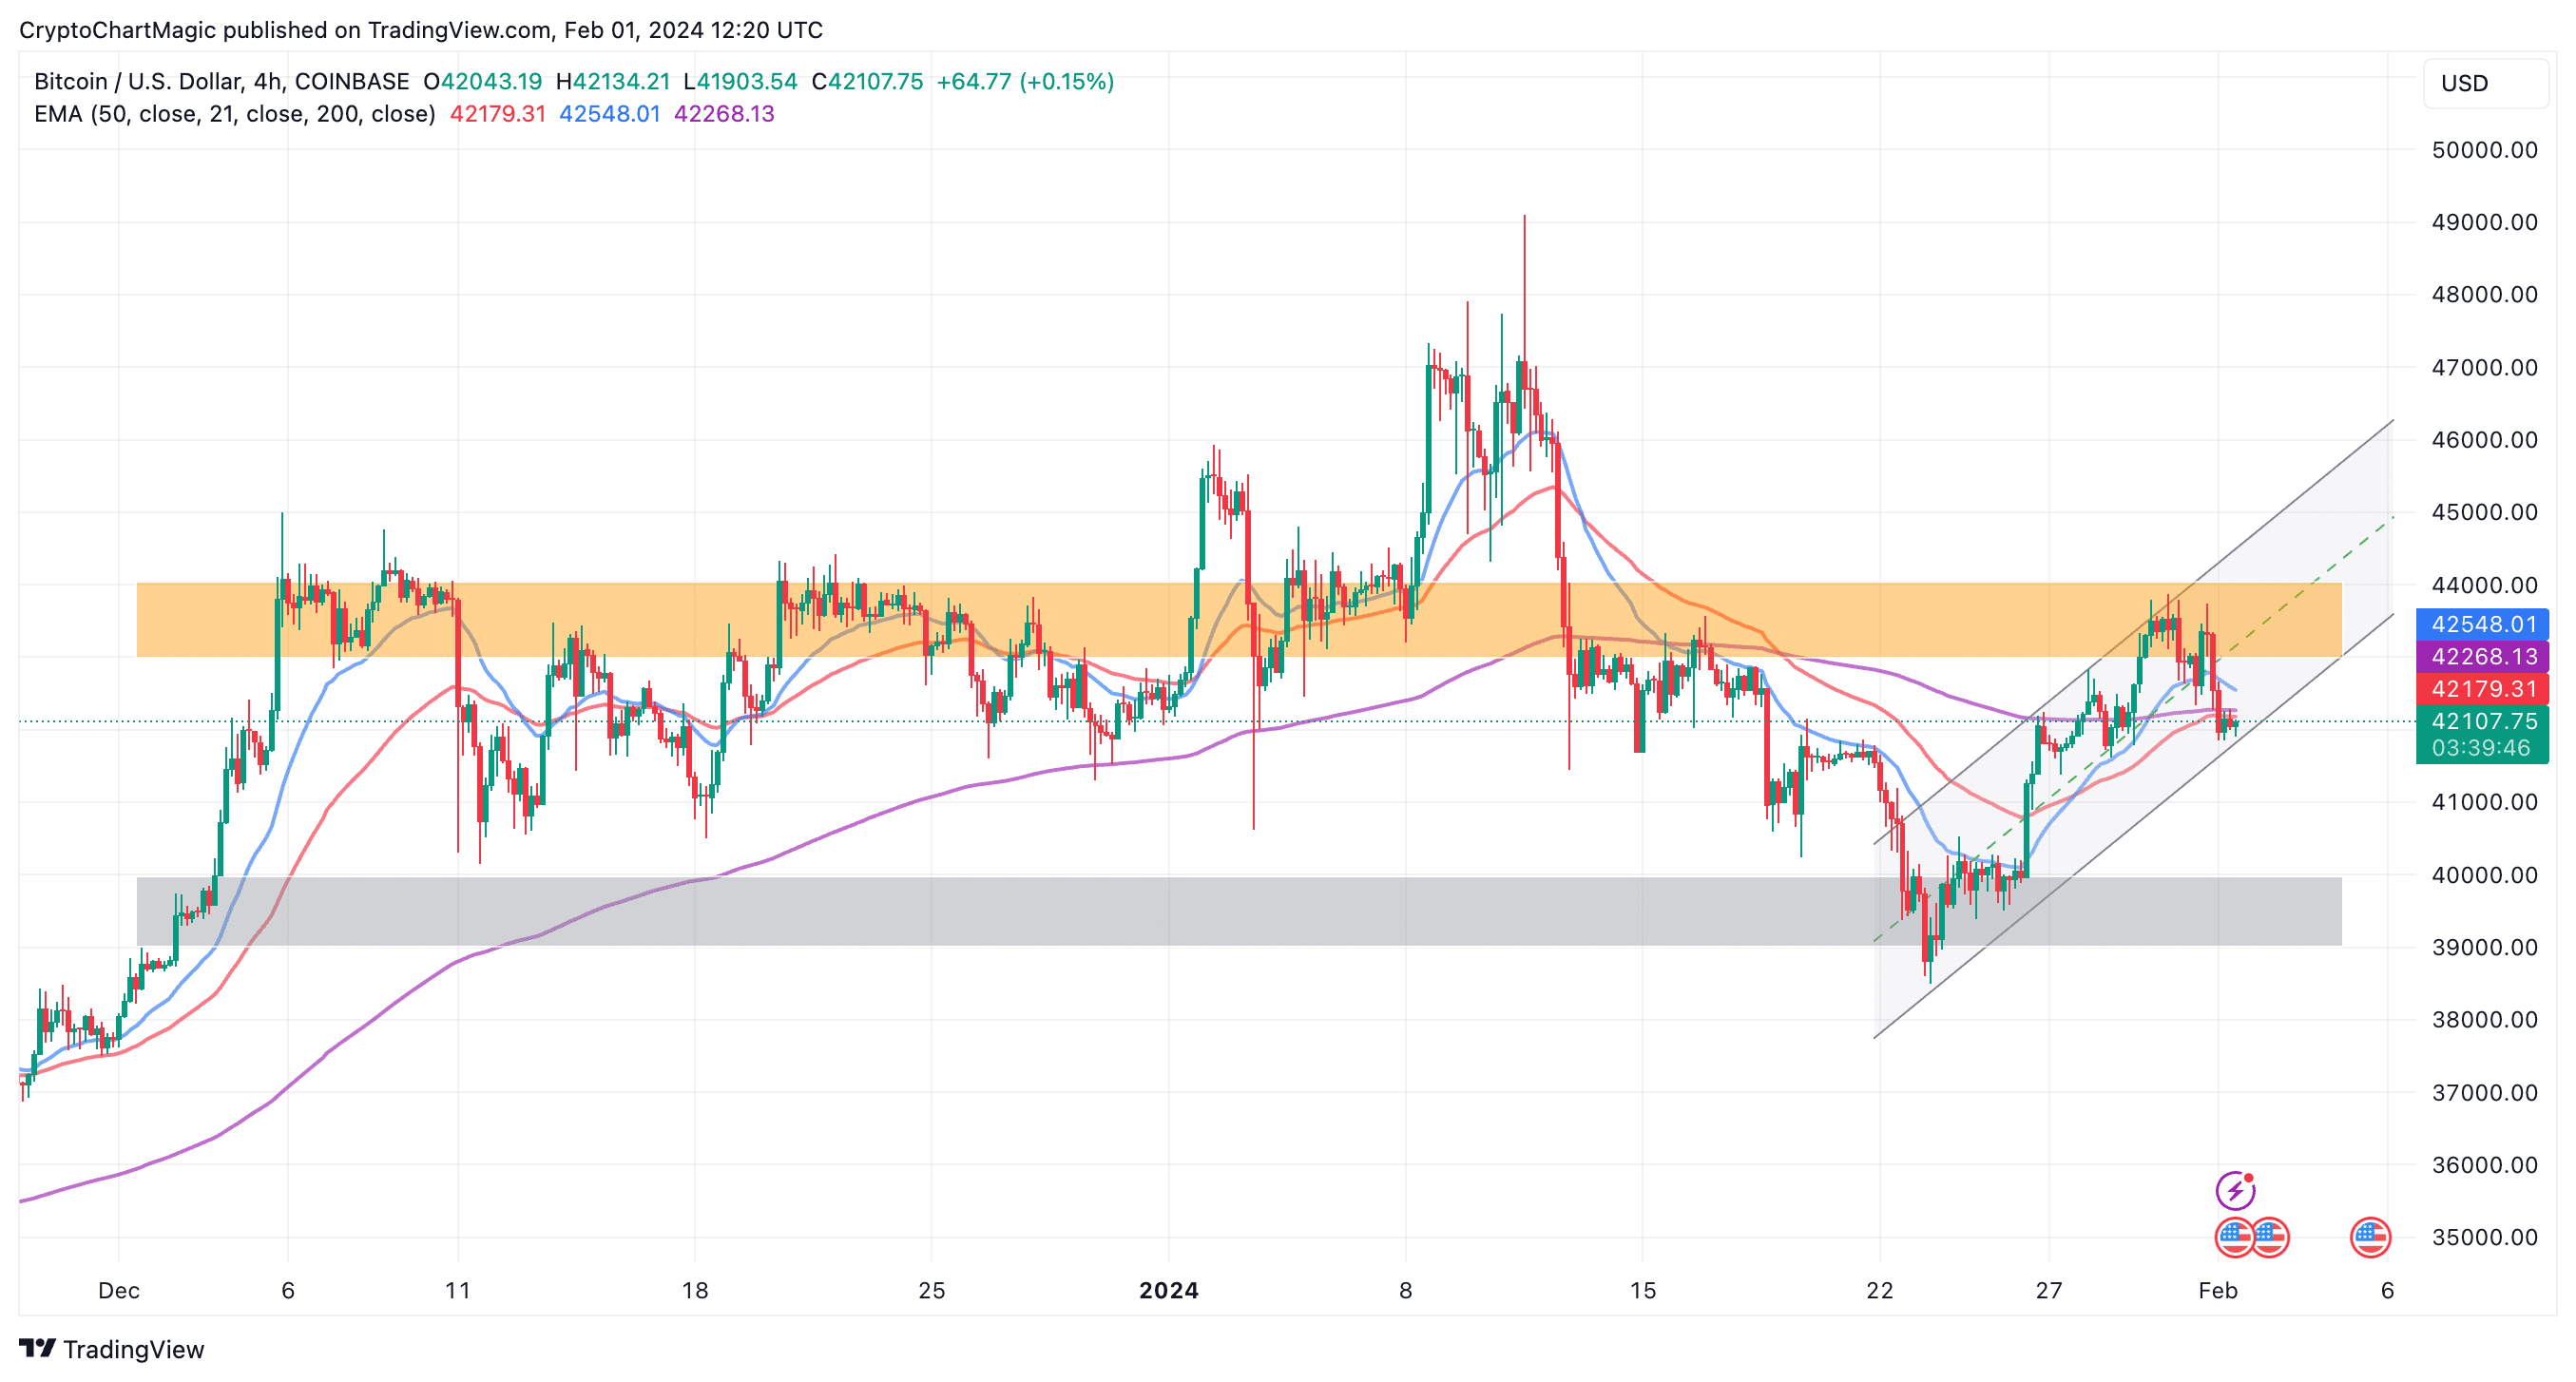
Analysts at Rekt Capital pointed out via a post on X that while BTC rebounded above $43,000, it was not able to break the range resistance around $43,800.
Rekt Capital分析師透過X發文指出,雖然BTC反彈至43,000美元上方,但未能突破43,800美元附近的區間阻力。
Reflecting this bearish outlook is the Relative Strength Index (RSI), which holds below its downtrend resistance. For Bitcoin to come out of the downtrend, the RSI needs to move higher.
相對強弱指數(RSI)反映了這種看跌前景,該指數保持在下降趨勢阻力位下方。為了讓比特幣走出下跌趨勢,RSI 需要走高。
#BTC
Bitcoin was able to revisit its red Range High resistance (~$43800) but has since rejected to form a Lower High (black)
比特幣能夠重新觸及其紅色範圍高點阻力位(約 43800 美元),但此後拒絕形成較低的高位(黑色)
In the meantime, the RSI is still at its downtrend resistance
同時,RSI 仍處於下行阻力位
The RSI needs to break this downtrend if price is to move higher$BTC #Crypto #Bitcoin https://t.co/da6foTzPwg pic.twitter.com/S8e3lpxZyj
如果價格要走高,RSI 需要打破這個下降趨勢$BTC #Crypto #Bitcoin https://t.co/da6foTzPwg pic.twitter.com/S8e3lpxZyj
— Rekt Capital (@rektcapital) February 1, 2024
— Rekt Capital (@rektcapital) 2024 年 2 月 1 日
Support provided by the falling channel’s lower boundary may help keep Bitcoin buoyant above $42,000 but due to resistance at the 50 EMA and the 200 EMA, it would be a tall order to resume the uptrend.
下降通道下限提供的支撐可能有助於比特幣保持在 42,000 美元上方,但由於 50 EMA 和 200 EMA 的阻力,恢復上升趨勢將是一項艱鉅的任務。
比特幣價格走勢圖 |交易視圖
In the foreseeable future, Bitcoin price might settle between the colored bands on the chart consolidating. A pre-halving rally will break the trend, pushing for a debut above $50,000.
在可預見的未來,比特幣價格可能會穩定在圖表上的彩色帶之間,進行盤整。減半前的反彈將打破這一趨勢,推動首次突破 5 萬美元。
Read also: What Is The Price Prediction For ETH In February 2024?
另請閱讀:2024 年 2 月 ETH 的價格預測是多少?
ApeCoin (APE) Price On The Move Above $1.5
ApeCoin (APE) 價格升至 1.5 美元以上
Traders are doubling down on their efforts to buy into ApeCoin. In 24 hours, the web3 token increased 8% to $1.51, underlining the growing interest in the token backing a staggering 107% spike in the trading volume to $85 million.
交易者正在加倍努力購買 ApeCoin。 24 小時內,web3 代幣上漲 8% 至 1.51 美元,突顯了人們對該代幣日益增長的興趣,支持交易量驚人地飆升 107% 至 8,500 萬美元。
ApeCoin boasts a market cap of $558 million, placing it at #102 among other cryptocurrencies.
ApeCoin 的市值為 5.58 億美元,在其他加密貨幣中排名第 102。
A buy signal from the Moving Average Convergence Divergence (MACD) indicator crossover implies that the trend reversal is just getting started.
移動平均線趨同分歧(MACD)指標交叉發出的買進訊號意味著趨勢反轉才剛開始。
With a break above the red band on the chart, APE could steady the uptrend to above $5.
如果 APE 突破圖表上的紅色帶,則可能將上升趨勢穩定在 5 美元以上。
APE 價格走勢圖 |交易視圖
Captain Faibik, a renowned trader agreed with APE’s bullish theory via a post on X. Based on the daily chart he shared, ApeCoin “seems like bottomed out & ready to break the major trendline,” hinting at a massive move above $5.
著名交易員 Captain Faibik 在 X 上發布同意 APE 的看漲理論。根據他分享的日線圖,ApeCoin“似乎已觸底並準備突破主要趨勢線”,暗示將大幅上漲至 5 美元以上。
$APE #Apecoin Seems like bottomed out & Ready to Break the Major Trendline..📈 pic.twitter.com/1GOtytFC2b
$APE #Apecoin 似乎已經觸底並準備打破主要趨勢線..📈 pic.twitter.com/1GOtytFC2b
— Captain Faibik (@CryptoFaibik) February 1, 2024
— 船長 Faibik (@CryptoFaibik) 2024 年 2 月 1 日
Celestia (TIA) Eyes $20
塞拉斯蒂婭 (TIA) 眼睛 20 美元
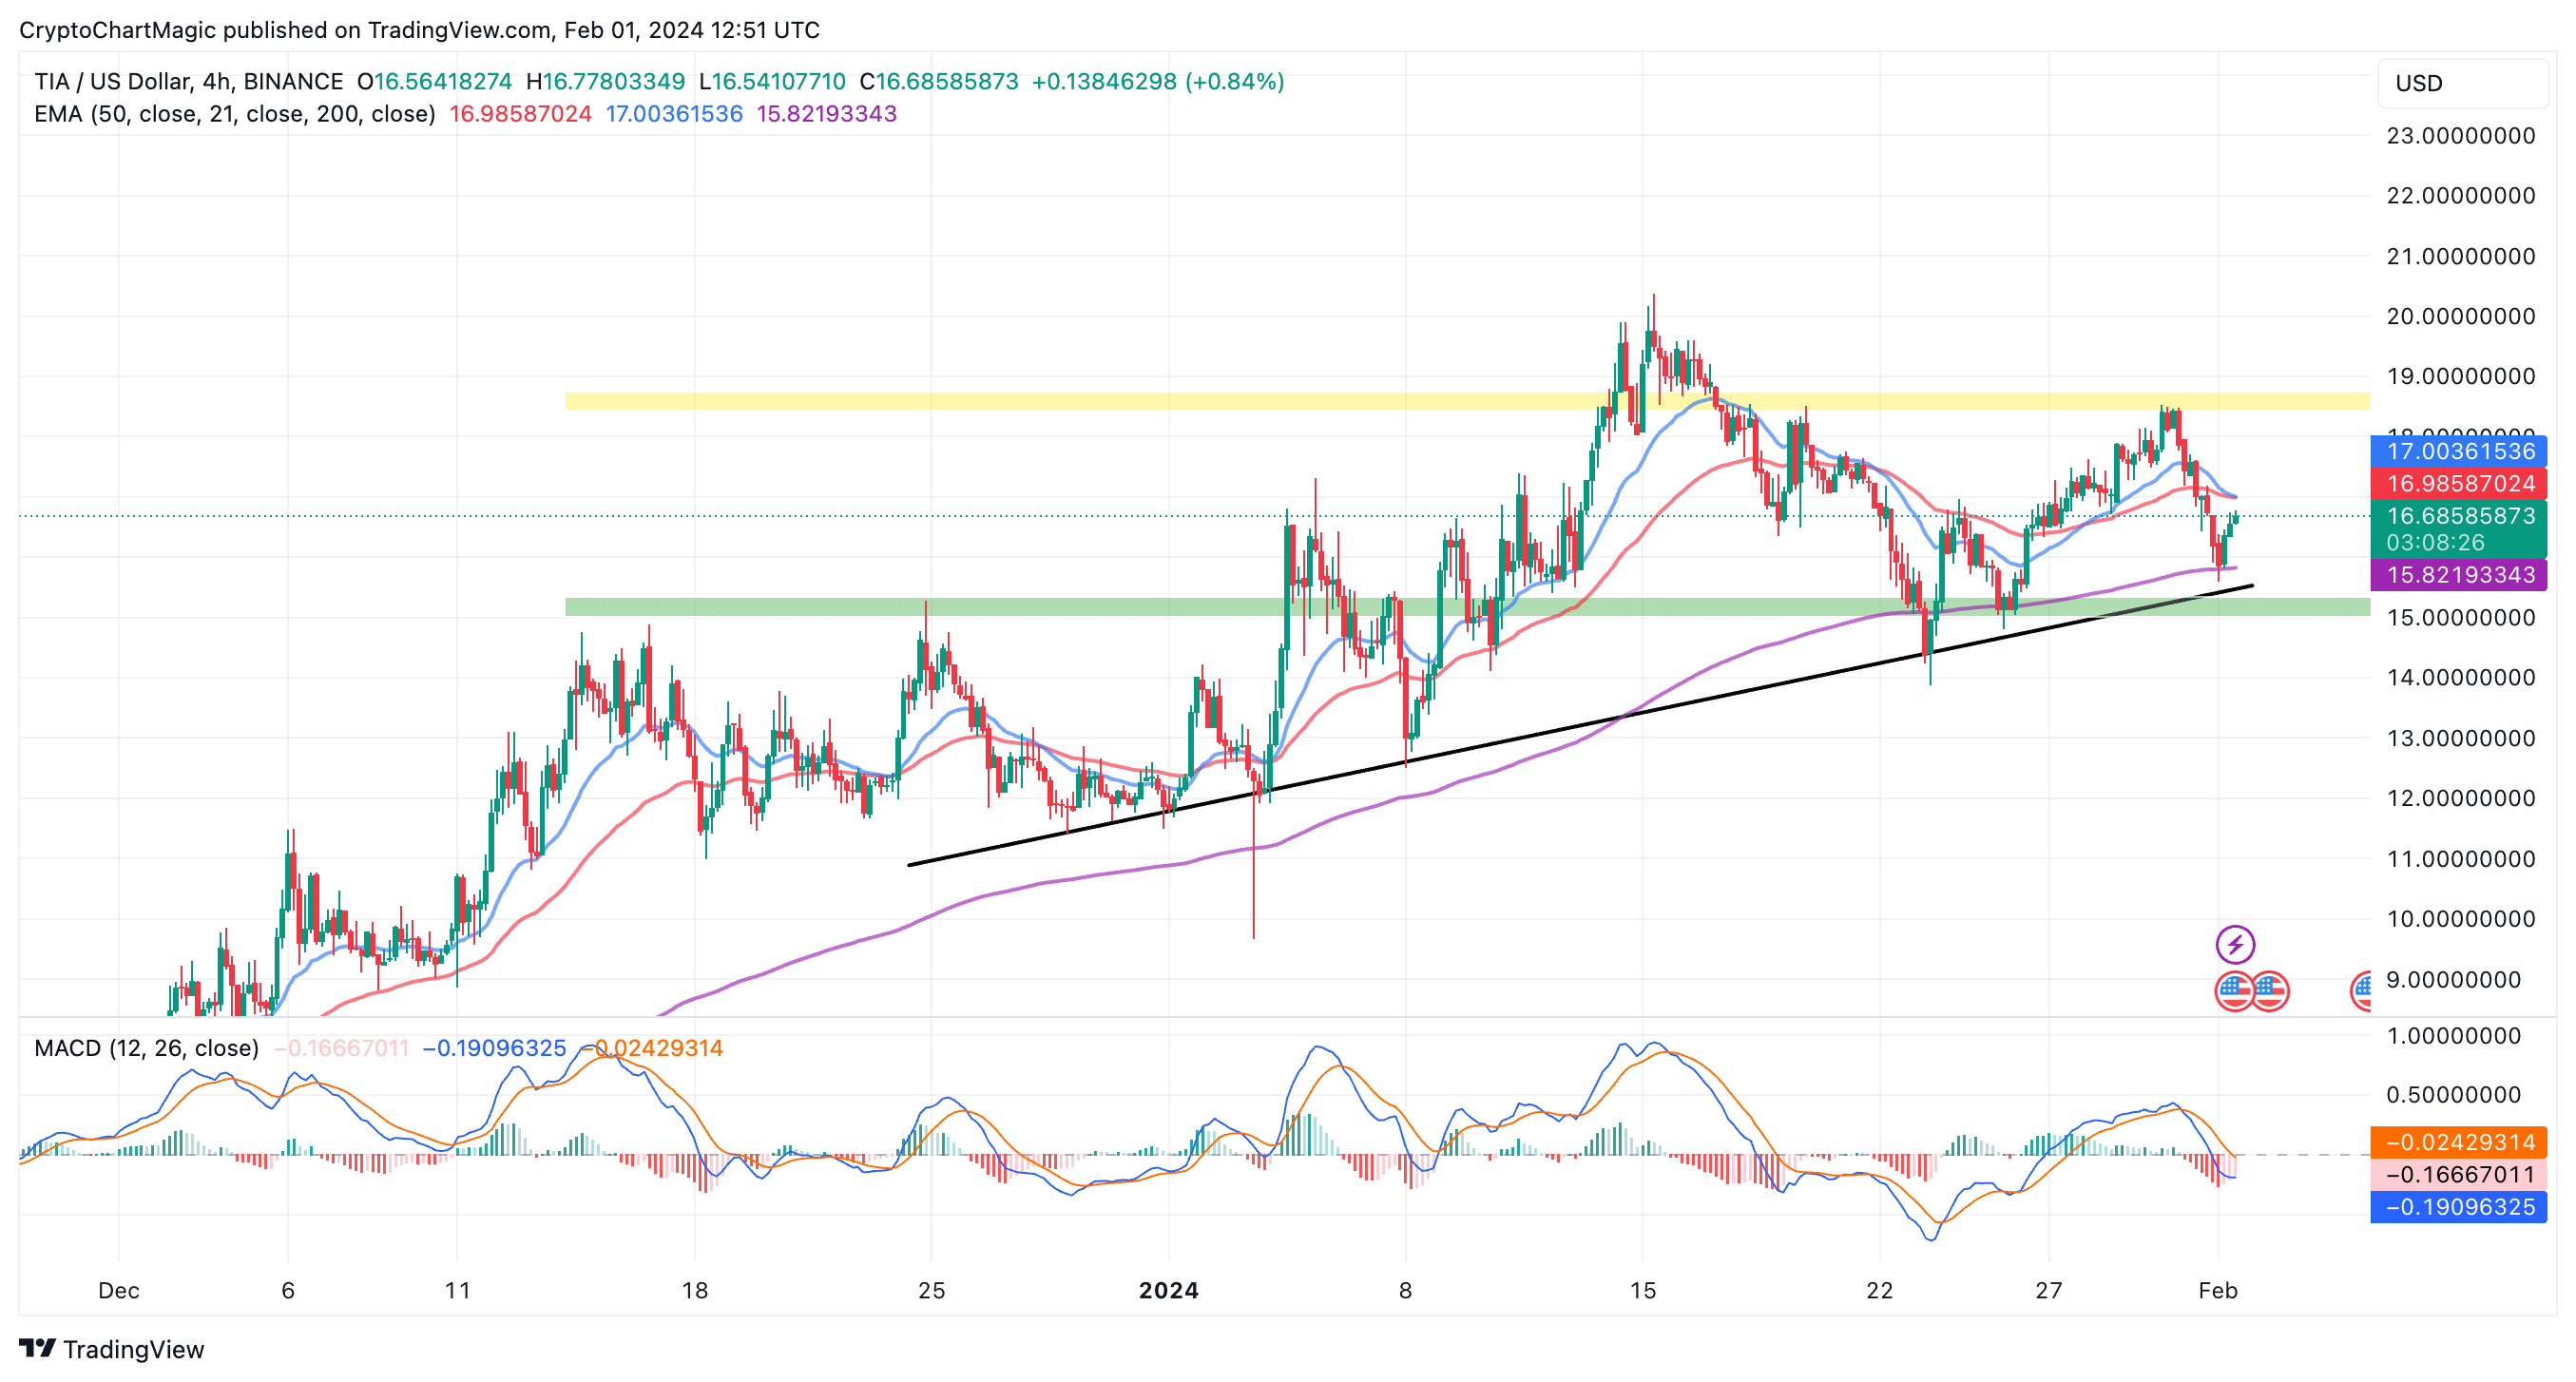
After retesting range low support at $15, TIA is holding at $16.75 during US business hours on Thursday. A narrowed technical outlook also places Celestia in a wide range between $15 and $18.5 (yellow band).
在重新測試 15 美元的區間低點支撐後,TIA 在周四美國營業時間內維持在 16.75 美元。縮小的技術前景也使 Celestia 處於 15 美元至 18.5 美元(黃色區域)之間的寬幅區間。
Ascending to the range high resistance at $18.5 is possible but TIA could encounter delay at $17 — a confluence level formed by the 50 EMA and the 20 EMA.
上升至 18.5 美元區間高阻力位是可能的,但 TIA 可能會在 17 美元(由 50 EMA 和 20 EMA 形成的匯合水平)遇到延遲。
On the downside, the 20 EMA at $15.82 will come in handy to reduce the impact of the selling pressure toward the range of low support.
下檔方面,20 EMA 15.82 美元將派上用場,以減少拋售壓力對低支撐位範圍的影響。
Traders may want to closely watch out for a buy signal from the MACD. As the blue MACD line crosses above the red signal line, a signal to buy TIA will manifest. There’s a high probability Celestia will retest $20 in the next few days as opposed to sliding to $12.
交易者可能需要密切關注 MACD 發出的買入訊號。當藍色 MACD 線穿過紅色訊號線時,買入 TIA 的訊號將會顯現。 Celestia 很可能會在接下來的幾天內重新測試 20 美元,而不是滑落至 12 美元。
Related Articles
相關文章
- Will SUI Price Hit New All-Time High In February Amid TVL Expansion?
- Dogecoin Price To Pump To $1 In February If Network Activity Keeps Surging
- Top 3 Altcoins To Buy Today January 31: Ethereum (ETH), XRP, Dogecoin (DOGE)
隨著 TVL 擴張,SUI 價格將在 2 月創下歷史新高嗎?
如果網路活動持續激增,狗狗幣價格將在 2 月飆升至 1 美元
1 月 31 日今日最值得購買的 3 種山寨幣:以太幣 (ETH)、XRP、狗狗幣 (DOGE)
 DogeHome
 Crypto News Land
 Optimisus
 Crypto News Land
 Crypto News Land
 Optimisus
 Cryptopolitan_News
 Optimisus


