

Crypto Price Prediction: In January, the crypto market led by Bitcoin was on a rollercoaster. The anticipation for spot BTC ETFs in Q4 ignited a commendable rally even in altcoins.
암호화폐 가격 예측: 1월 비트코인이 주도한 암호화폐 시장은 롤러코스터를 타고 있었습니다. 4분기 현물 BTC ETF에 대한 기대감은 알트코인에서도 칭찬할만한 상승세를 촉발했습니다.
However, at the peak of the green light news from the Securities and Exchange Commission (SEC), a minor uptick in the price of Bitcoin to $49,000 culminated in sell-the-news activities and coupled with the subsequent market doldrums saw the largest digital asset plummet below $39,000.
그러나 증권거래위원회(SEC)의 승인 소식이 정점에 이르렀을 때 비트코인 가격이 49,000달러로 소폭 상승하여 뉴스 판매 활동이 정점에 달했고 그에 따른 시장 침체와 결합하여 가장 큰 디지털 자산을 기록했습니다. 39,000달러 아래로 떨어졌습니다.
Although the last week of January was marked by widespread recoveries, Bitcoin is stuck under range resistance at $43,000. Similarly, Ethereum is back to trading in the range between $2,200 and $2,400 following a major spike to $28,000.
1월 마지막 주가 광범위한 회복세를 보였지만 비트코인은 43,000달러 선에서 저항을 받고 있습니다. 마찬가지로, 이더리움은 28,000달러로 급등한 후 다시 2,200~2,400달러 사이의 거래로 돌아왔습니다.
For many traders, the pullback after the spot ETF approval was a significant setback. However, experts like the founder of MN Trading, Michaël van de Poppe reckons the correction is healthy and that the best way to navigate is to buy dips.
많은 트레이더들에게 현물 ETF 승인 이후 하락세는 상당한 좌절이었습니다. 그러나 MN Trading의 창립자인 Michaël van de Poppe와 같은 전문가들은 조정이 건전하며 하락을 탐색하는 가장 좋은 방법은 하락세를 매수하는 것이라고 생각합니다.
Jerome Powell spoke about lowering interest rates, but is going to implement this at a later point than the markets were expecting.
제롬 파월(Jerome Powell)은 금리 인하에 대해 언급했지만 시장이 예상했던 것보다 나중에 이를 시행할 예정입니다.
Let's face reality: rates and yields have peaked. The trend is downwards, which means that the dips are to be bought for the time being. pic.twitter.com/oMy6ryUwiQ
현실을 직시합시다. 금리와 수익률이 정점에 이르렀습니다. 추세는 하락세입니다. 이는 당분간 하락세를 매수해야 함을 의미합니다. pic.twitter.com/oMy6ryUwiQ
— Michaël van de Poppe (@CryptoMichNL) February 1, 2024
— Michaël van de Poppe(@CryptoMichNL) 2024년 2월 1일
1. Assessing Bitcoin (BTC) Price Technical Structure, Are Dips Profitable?
1. 비트코인(BTC) 가격 기술 구조 평가, 딥스는 수익성이 있나요?
It is not an easy task to time market bottoms, especially in the crypto industry. Investors are safe to buy in key ranges following a correction from a recent peak.
특히 암호화폐 산업에서는 시장 바닥을 맞추는 것이 쉬운 일이 아닙니다. 투자자들은 최근 최고점에서 조정을 받은 후 주요 범위에서 매수해도 안전합니다.
For instance, Bitcoin’s slump under $39,000 presented important buy zones. A dollar-cost averaging strategy if applied professionally would ensure that no dips are missed, especially with the halving in a little over two months.
예를 들어, 39,000달러 미만의 비트코인 폭락은 중요한 구매 영역을 제시했습니다. 전문적으로 적용한다면 달러 비용 평균화 전략을 사용하면 특히 2개월 남짓 만에 절반으로 줄어드는 하락세를 놓치지 않을 수 있습니다.
Analysts at Rekt Capital pointed out via a post on X that while BTC rebounded above $43,000, it was not able to break the range resistance around $43,800.
Rekt Capital의 분석가들은 X의 게시물을 통해 BTC가 43,000달러 이상으로 반등했지만 43,800달러 부근의 범위 저항을 깨뜨릴 수 없었다고 지적했습니다.
Reflecting this bearish outlook is the Relative Strength Index (RSI), which holds below its downtrend resistance. For Bitcoin to come out of the downtrend, the RSI needs to move higher.
이러한 약세 전망을 반영하는 상대강도지수(RSI)는 하락 추세 저항선 아래를 유지하고 있습니다. 비트코인이 하락 추세에서 벗어나려면 RSI가 더 높아져야 합니다.
#BTC
Bitcoin was able to revisit its red Range High resistance (~$43800) but has since rejected to form a Lower High (black)
비트코인은 빨간색 범위 고저항(~$43800)을 다시 방문할 수 있었지만 이후 더 낮은 고점(검은색) 형성을 거부했습니다.
In the meantime, the RSI is still at its downtrend resistance
그 동안 RSI는 여전히 하락세 저항을 받고 있습니다.
The RSI needs to break this downtrend if price is to move higher$BTC #Crypto #Bitcoin https://t.co/da6foTzPwg pic.twitter.com/S8e3lpxZyj
가격이 $BTC #Crypto #Bitcoin https://t.co/da6foTzPwg pic.twitter.com/S8e3lpxZyj를 높이려면 RSI가 이 하락 추세를 깨뜨려야 합니다.
— Rekt Capital (@rektcapital) February 1, 2024
— Rekt Capital(@rektcapital) 2024년 2월 1일
Support provided by the falling channel’s lower boundary may help keep Bitcoin buoyant above $42,000 but due to resistance at the 50 EMA and the 200 EMA, it would be a tall order to resume the uptrend.
하락 채널의 하한 경계에서 제공되는 지원은 비트코인의 상승세를 $42,000 이상으로 유지하는 데 도움이 될 수 있지만 50 EMA 및 200 EMA의 저항으로 인해 상승 추세를 재개하기는 어려울 것입니다.
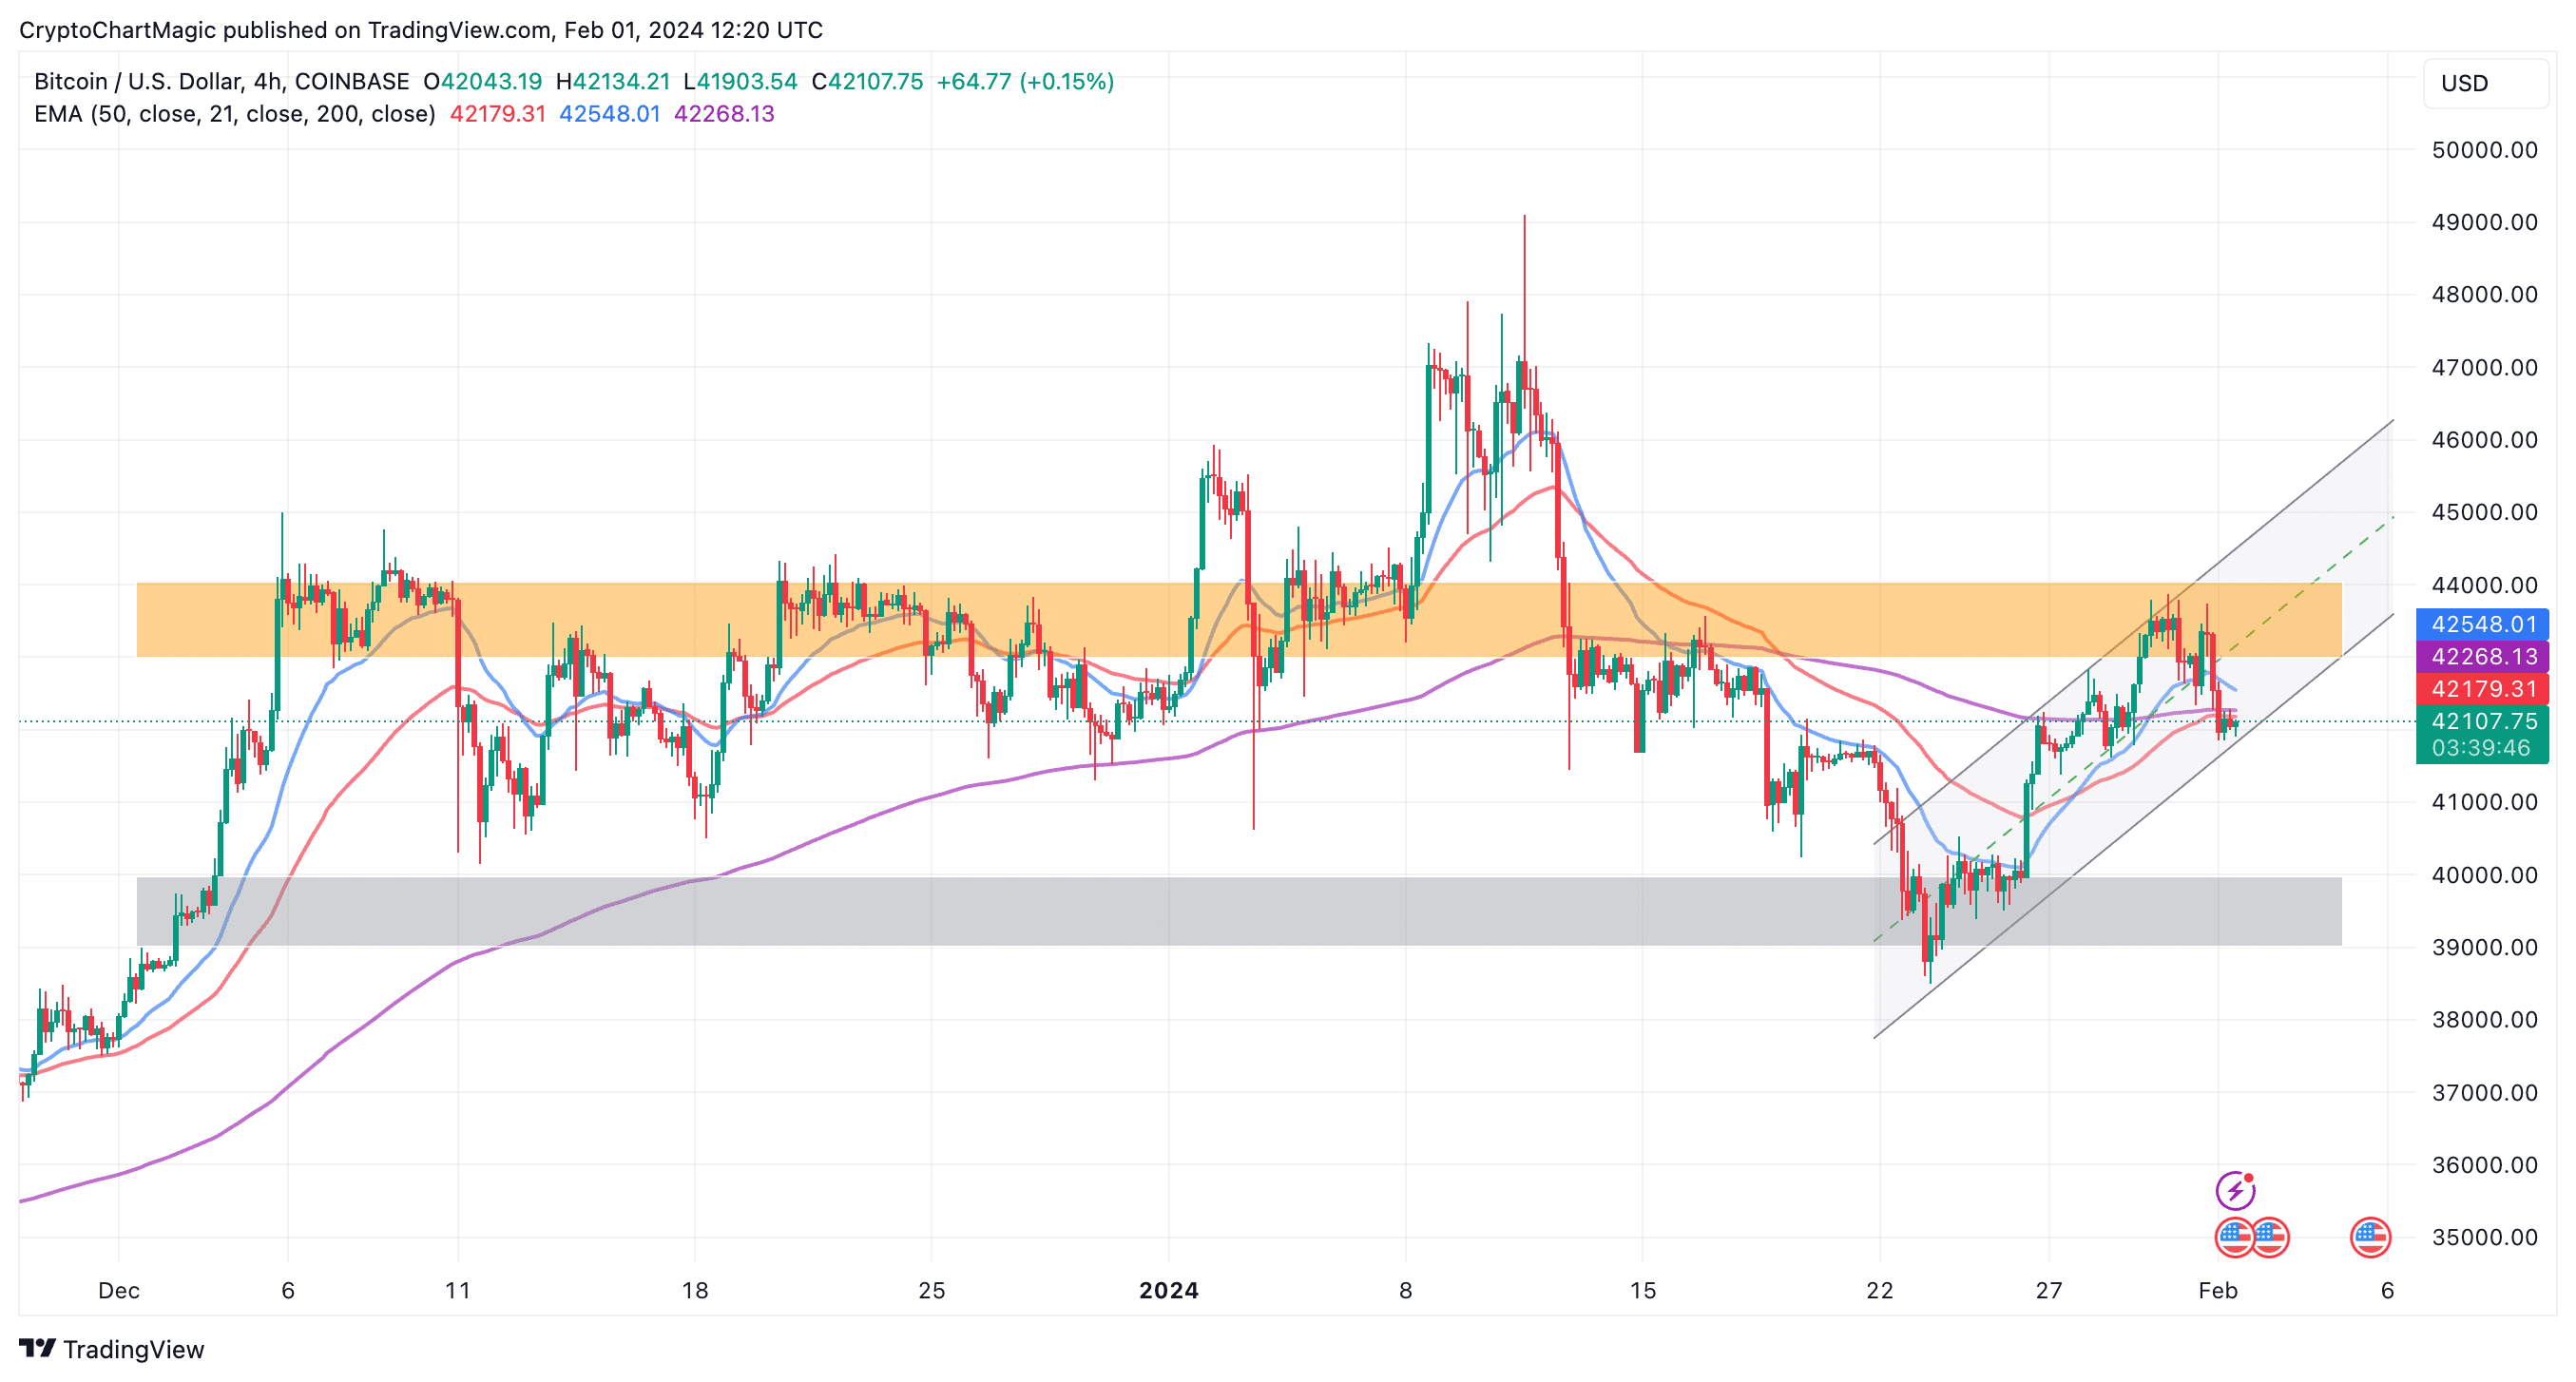
BTC 가격 차트 | 트레이딩뷰
In the foreseeable future, Bitcoin price might settle between the colored bands on the chart consolidating. A pre-halving rally will break the trend, pushing for a debut above $50,000.
가까운 미래에 비트코인 가격은 통합 차트의 색상 띠 사이에 정착할 수 있습니다. 반감기 전 랠리는 추세를 깨고 $50,000 이상으로 데뷔할 것입니다.
Read also: What Is The Price Prediction For ETH In February 2024?
또한 읽어 보세요: 2024년 2월 ETH의 가격 예측은 무엇입니까?
ApeCoin (APE) Price On The Move Above $1.5
ApeCoin (APE) 가격이 $1.5 이상으로 움직이고 있습니다.
Traders are doubling down on their efforts to buy into ApeCoin. In 24 hours, the web3 token increased 8% to $1.51, underlining the growing interest in the token backing a staggering 107% spike in the trading volume to $85 million.
거래자들은 ApeCoin을 구매하려는 노력을 두 배로 늘리고 있습니다. 24시간 만에 web3 토큰은 8% 증가한 1.51달러로 거래량이 107% 급증한 8,500만 달러를 뒷받침하는 토큰에 대한 관심이 높아지고 있음을 강조했습니다.
ApeCoin boasts a market cap of $558 million, placing it at #102 among other cryptocurrencies.
ApeCoin은 시가총액 5억 5,800만 달러를 자랑하며 다른 암호화폐 중 102위에 올랐습니다.
A buy signal from the Moving Average Convergence Divergence (MACD) indicator crossover implies that the trend reversal is just getting started.
MACD(Moving Average Convergence Divergence) 지표 크로스오버의 매수 신호는 추세 반전이 이제 막 시작되었음을 의미합니다.
With a break above the red band on the chart, APE could steady the uptrend to above $5.
차트의 빨간색 밴드를 벗어나면 APE는 상승 추세를 $5 이상으로 유지할 수 있습니다.
APE 가격 차트 | 트레이딩뷰
Captain Faibik, a renowned trader agreed with APE’s bullish theory via a post on X. Based on the daily chart he shared, ApeCoin “seems like bottomed out & ready to break the major trendline,” hinting at a massive move above $5.
유명한 트레이더인 Captain Faibik은 X에 대한 게시물을 통해 APE의 강세 이론에 동의했습니다. 그가 공유한 일일 차트에 따르면 ApeCoin은 "바닥을 치고 주요 추세선을 깨뜨릴 준비가 된 것 같습니다."라고 하며 5달러 이상의 엄청난 상승을 암시했습니다.
$APE #Apecoin Seems like bottomed out & Ready to Break the Major Trendline..📈 pic.twitter.com/1GOtytFC2b
$APE #Apecoin 바닥을 치고 주요 추세선을 돌파할 준비가 된 것 같습니다..📈 pic.twitter.com/1GOtytFC2b
— Captain Faibik (@CryptoFaibik) February 1, 2024
— Faibik 선장(@CryptoFaibik) 2024년 2월 1일
Celestia (TIA) Eyes $20
셀레스티아(TIA) 아이즈 $20
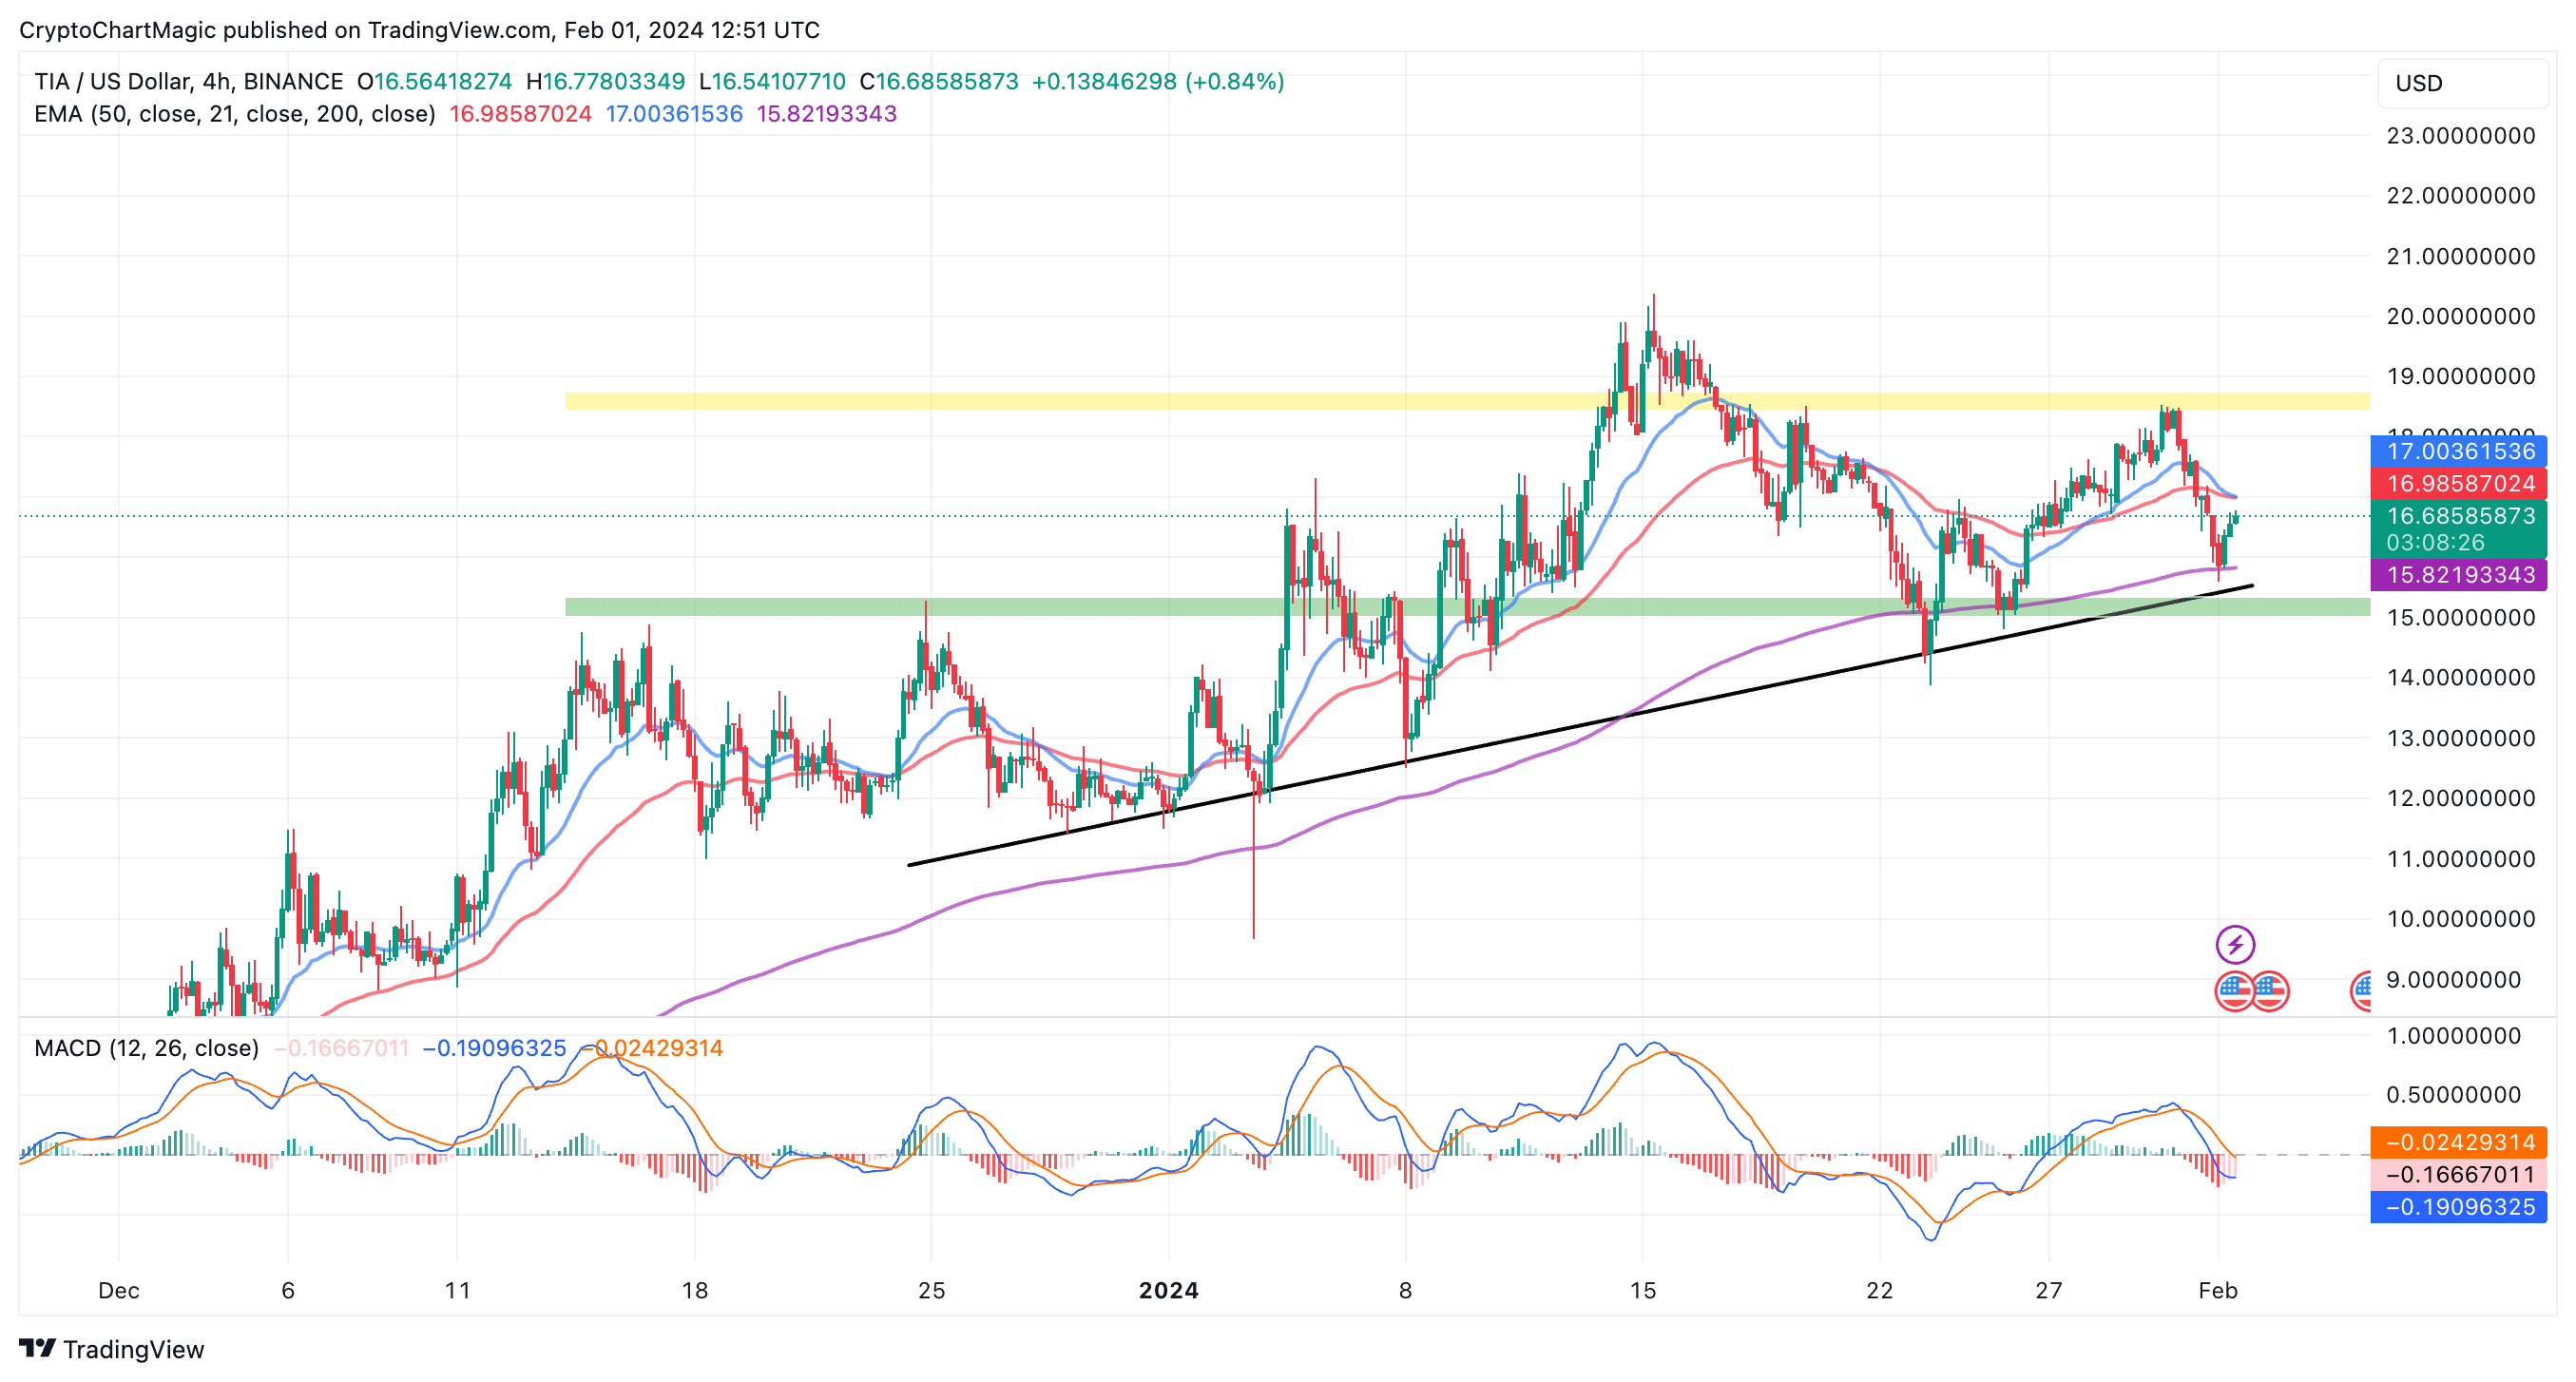
After retesting range low support at $15, TIA is holding at $16.75 during US business hours on Thursday. A narrowed technical outlook also places Celestia in a wide range between $15 and $18.5 (yellow band).
15달러의 낮은 지지 범위를 다시 테스트한 후 TIA는 목요일 미국 영업 시간 동안 16.75달러를 유지하고 있습니다. 기술적 전망이 좁아지면 Celestia는 15~18.5달러(노란색 띠) 사이의 넓은 범위에 있습니다.
Ascending to the range high resistance at $18.5 is possible but TIA could encounter delay at $17 — a confluence level formed by the 50 EMA and the 20 EMA.
$18.5의 높은 저항 범위로 상승하는 것이 가능하지만 TIA는 $17에서 지연이 발생할 수 있습니다. 이는 50 EMA와 20 EMA에 의해 형성된 합류 수준입니다.
On the downside, the 20 EMA at $15.82 will come in handy to reduce the impact of the selling pressure toward the range of low support.
단점이라면 $15.82의 20 EMA가 낮은 지지 범위에 대한 매도 압력의 영향을 줄이는 데 유용할 것입니다.
Traders may want to closely watch out for a buy signal from the MACD. As the blue MACD line crosses above the red signal line, a signal to buy TIA will manifest. There’s a high probability Celestia will retest $20 in the next few days as opposed to sliding to $12.
트레이더들은 MACD의 매수 신호를 면밀히 관찰하고 싶을 수도 있습니다. 파란색 MACD 선이 빨간색 신호 선 위로 교차하면 TIA 매수 신호가 나타납니다. Celestia가 12달러로 하락하는 대신 며칠 안에 20달러를 다시 테스트할 가능성이 높습니다.
Related Articles
관련 기사
- Will SUI Price Hit New All-Time High In February Amid TVL Expansion?
- Dogecoin Price To Pump To $1 In February If Network Activity Keeps Surging
- Top 3 Altcoins To Buy Today January 31: Ethereum (ETH), XRP, Dogecoin (DOGE)
TVL 확장 속에 SUI 가격이 2월에 사상 최고치를 기록할 것인가?
네트워크 활동이 계속 급증하면 Dogecoin 가격이 2월에 1달러로 상승합니다
1월 31일 오늘 구매할 상위 3개 알트코인: 이더리움(ETH), XRP, 도지코인(DOGE)
 CoinsProbe
 DogeHome
 crypto.news
 Thecryptoupdates
 crypto.news
 BlockchainReporter
 Optimisus
 CoinoMedia


