

Technical analysis is an essential indicator that investors in the cryptocurrency market, especially those trading in the futures market, need to constantly follow. So what does technical analysis tell us about Dogecoin, which is currently trading at $0.07412? Let’s delve into a detailed chart analysis, important support and resistance levels.
Dogecoin Chart Analysis
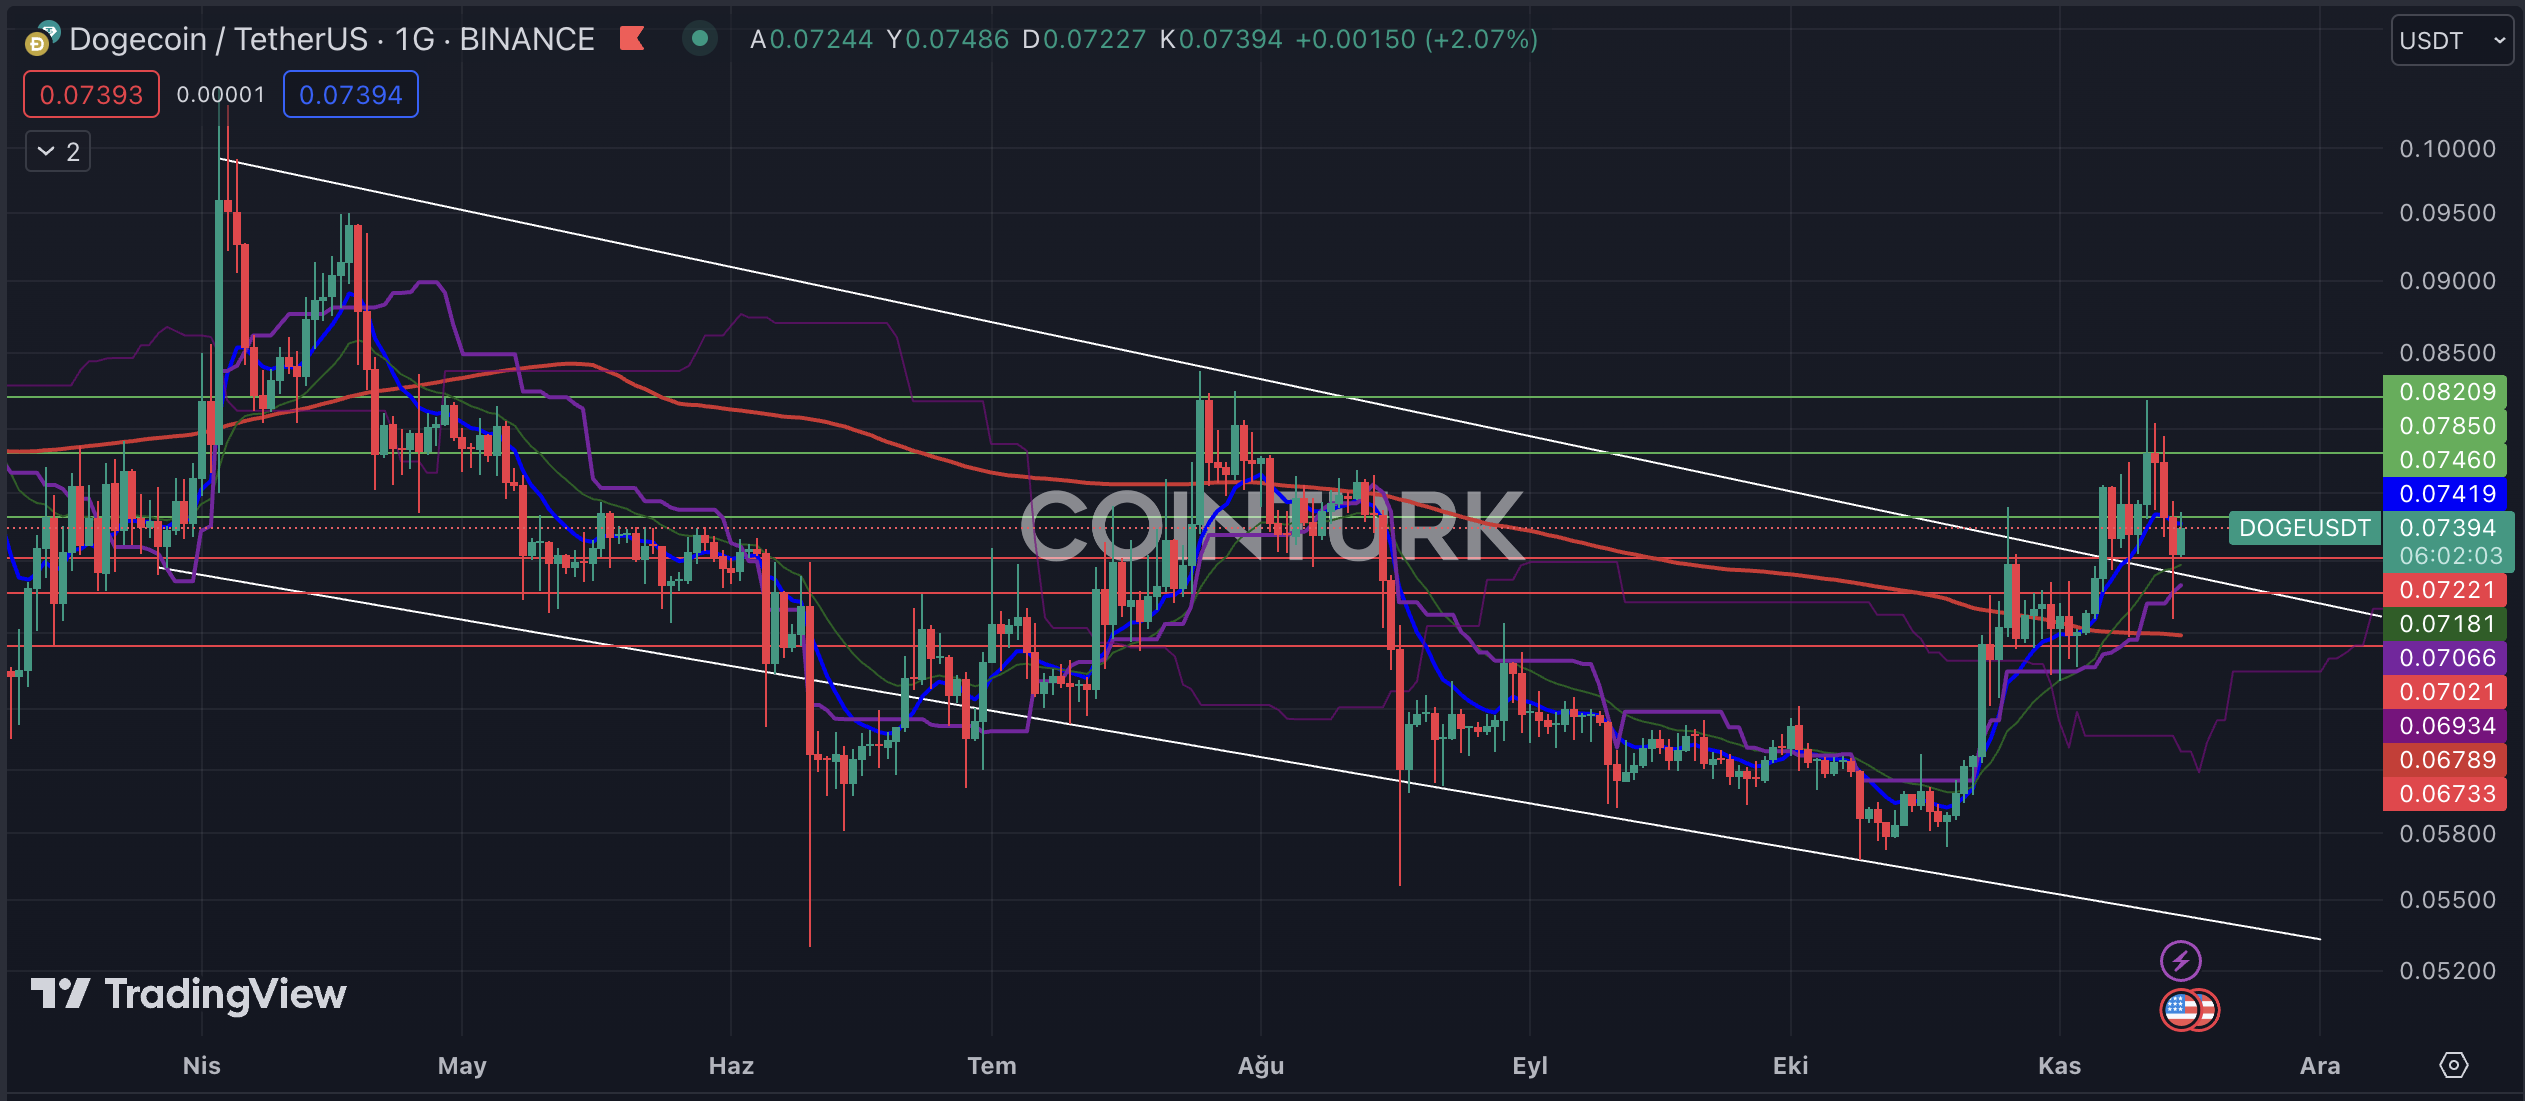
The notable formation structure on the daily chart of Dogecoin is a descending channel formation. With the recent breakout of resistance, DOGE has gained upward momentum, and the resistance line has served as a support line throughout the process. Despite two needle-like dips below the resistance line, the structure remained intact. However, this has resulted in significant losses for investors trading in the futures market.
The key support levels to watch for DOGE on the daily chart are $0.07221, $0.07021, and $0.06733. Particularly, if the daily bar closes below the intersection of the EMA 200 (red line) level and $0.06789, DOGE is likely to experience a significant loss in value, and the formation support line will be considered the target zone.
The key resistance levels to watch for DOGE on the daily chart are $0.07460, $0.07850, and $0.08209. Especially, if the daily bar closes above the significant obstacle at $0.08209, DOGE will gain momentum for further price increases.
Dogecoin Hourly Chart Analysis
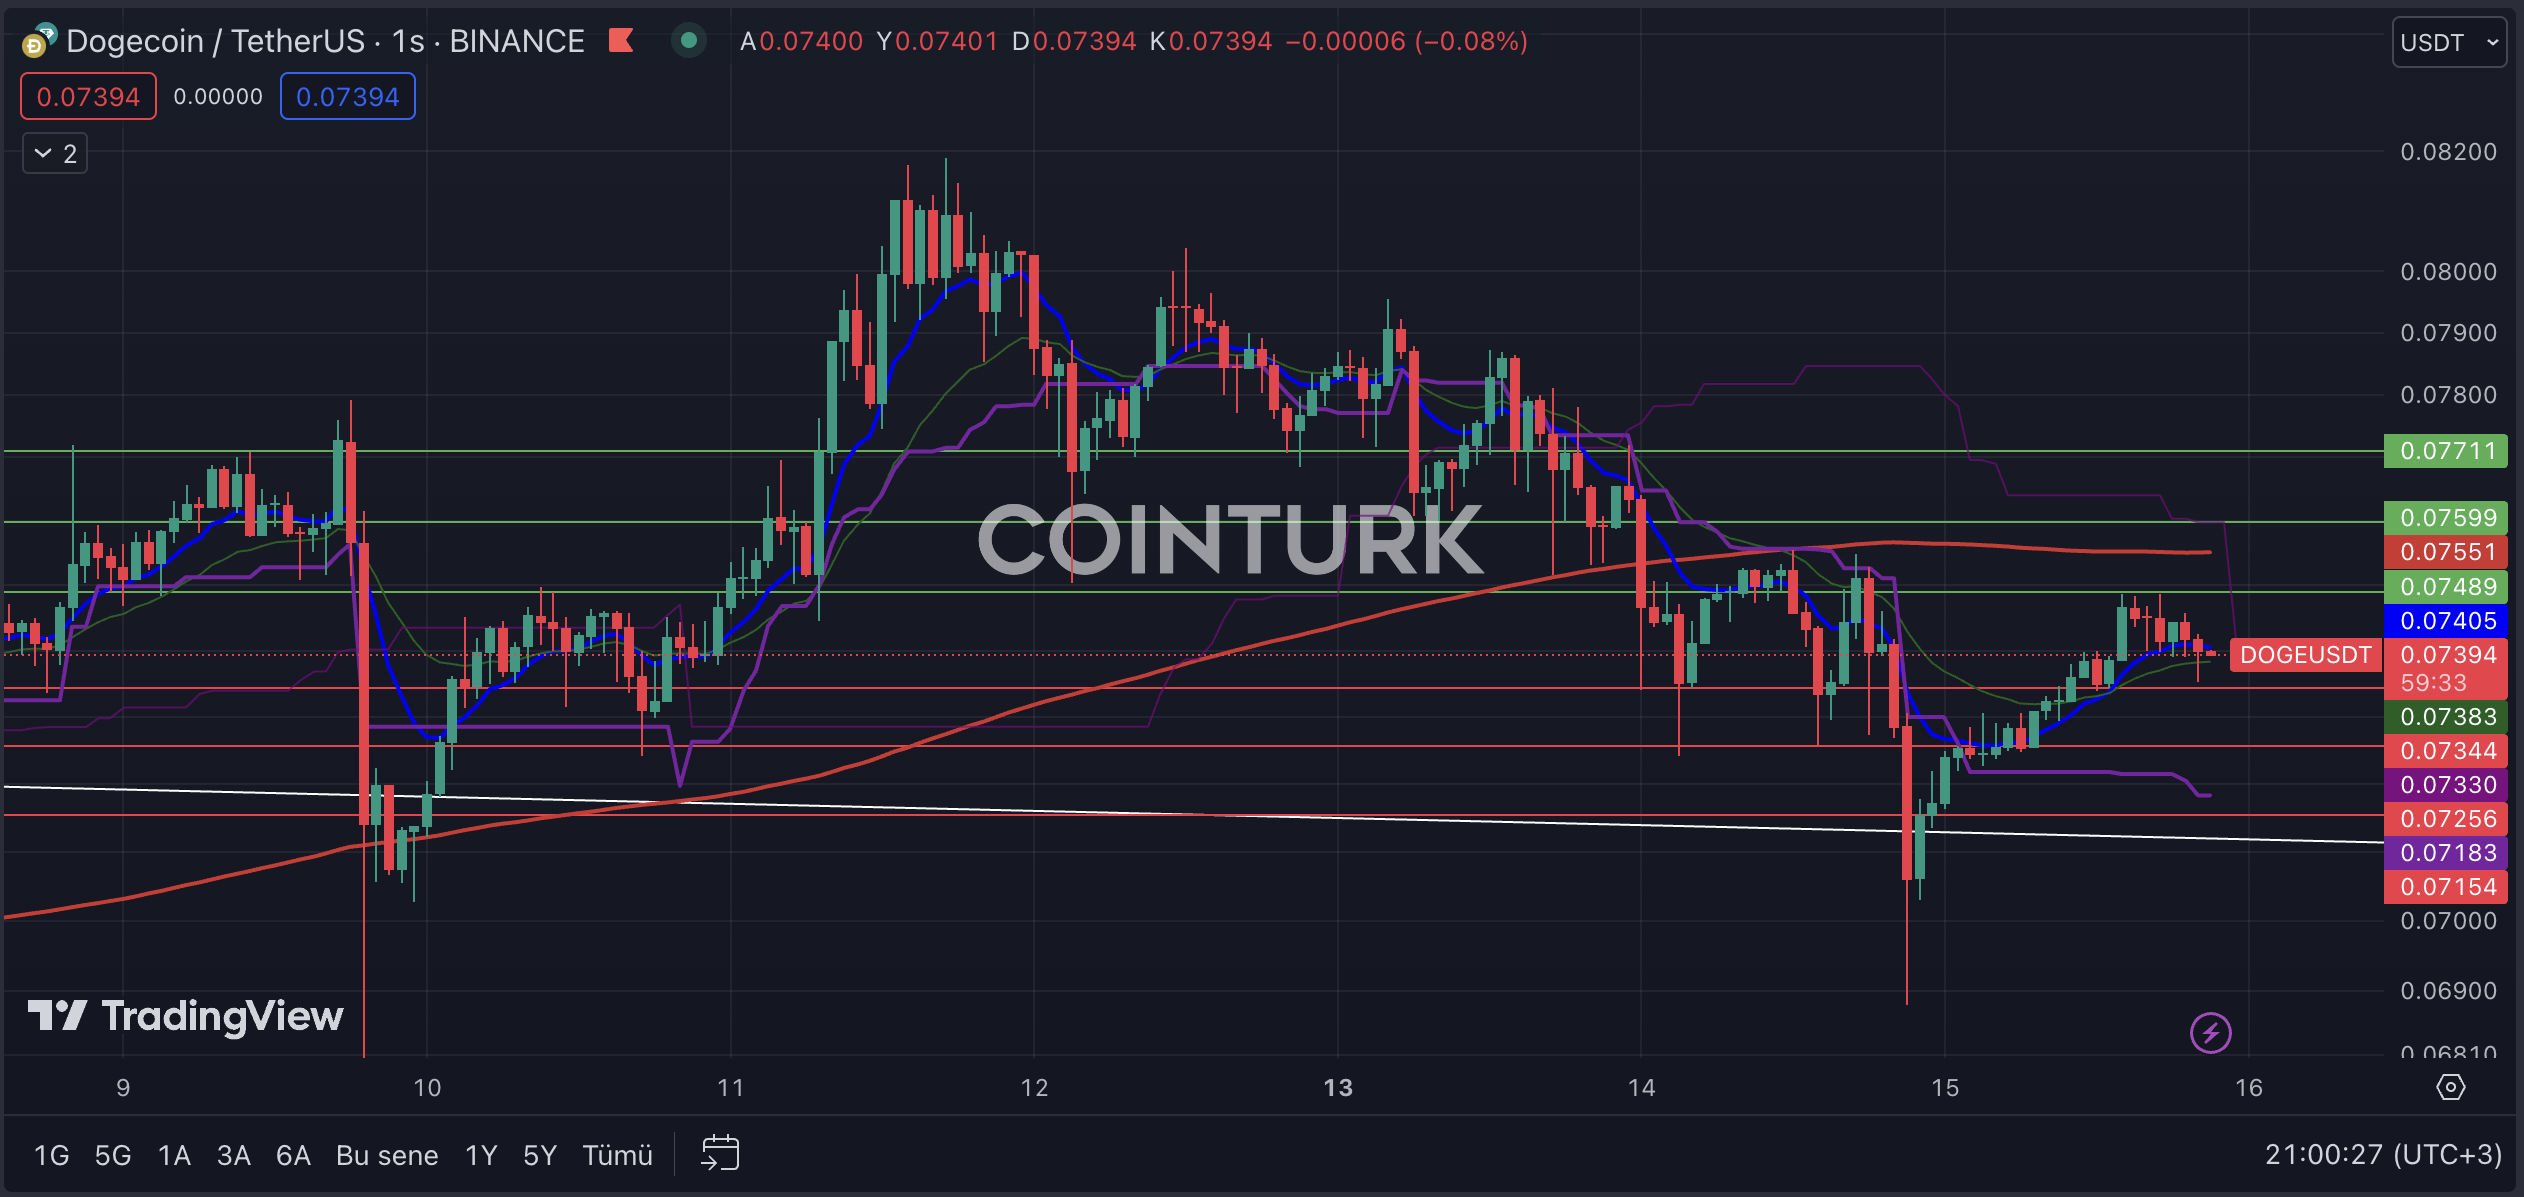
On the hourly chart, DOGE has been consolidating within a narrow range since November 9th, and a decrease in volatility has been observed. Although it is difficult to talk about a healthy formation structure at this point, DOGE staying below the EMA 200 (red line) level is a factor suppressing its short-term performance.
The key support levels to watch for DOGE on the hourly chart are $0.07344, $0.07256, and $0.07154. Particularly, if the hourly bar closes below $0.07154, it will result in a significant loss of a key support level.
The key resistance levels to watch for DOGE on the hourly chart are $0.07489, $0.07599, and $0.07711. Especially, if the bar closes above $0.07599, it will break the EMA 200 level and help DOGE gain momentum.
 DogeHome
 Thecryptoupdates
 The Bit Journal
 Times Tabloid
 CoinoMedia
 U_Today
 ETHNews
 crypto.news
 CoinPedia News


