
Technical analysis is an essential indicator that investors in the cryptocurrency market, especially those trading in the futures market, need to constantly follow. So what does technical analysis tell us about Dogecoin, which is currently trading at $0.07412? Let’s delve into a detailed chart analysis, important support and resistance levels.
기술적 분석은 암호화폐 시장의 투자자, 특히 선물 시장의 투자자가 지속적으로 따라야 하는 필수 지표입니다. 그렇다면 현재 0.07412달러에 거래되고 있는 Dogecoin에 대해 기술적 분석을 통해 우리는 무엇을 알 수 있을까요? 자세한 차트 분석, 중요한 지지 및 저항 수준을 살펴보겠습니다.
Dogecoin Chart Analysis
도지코인 차트 분석
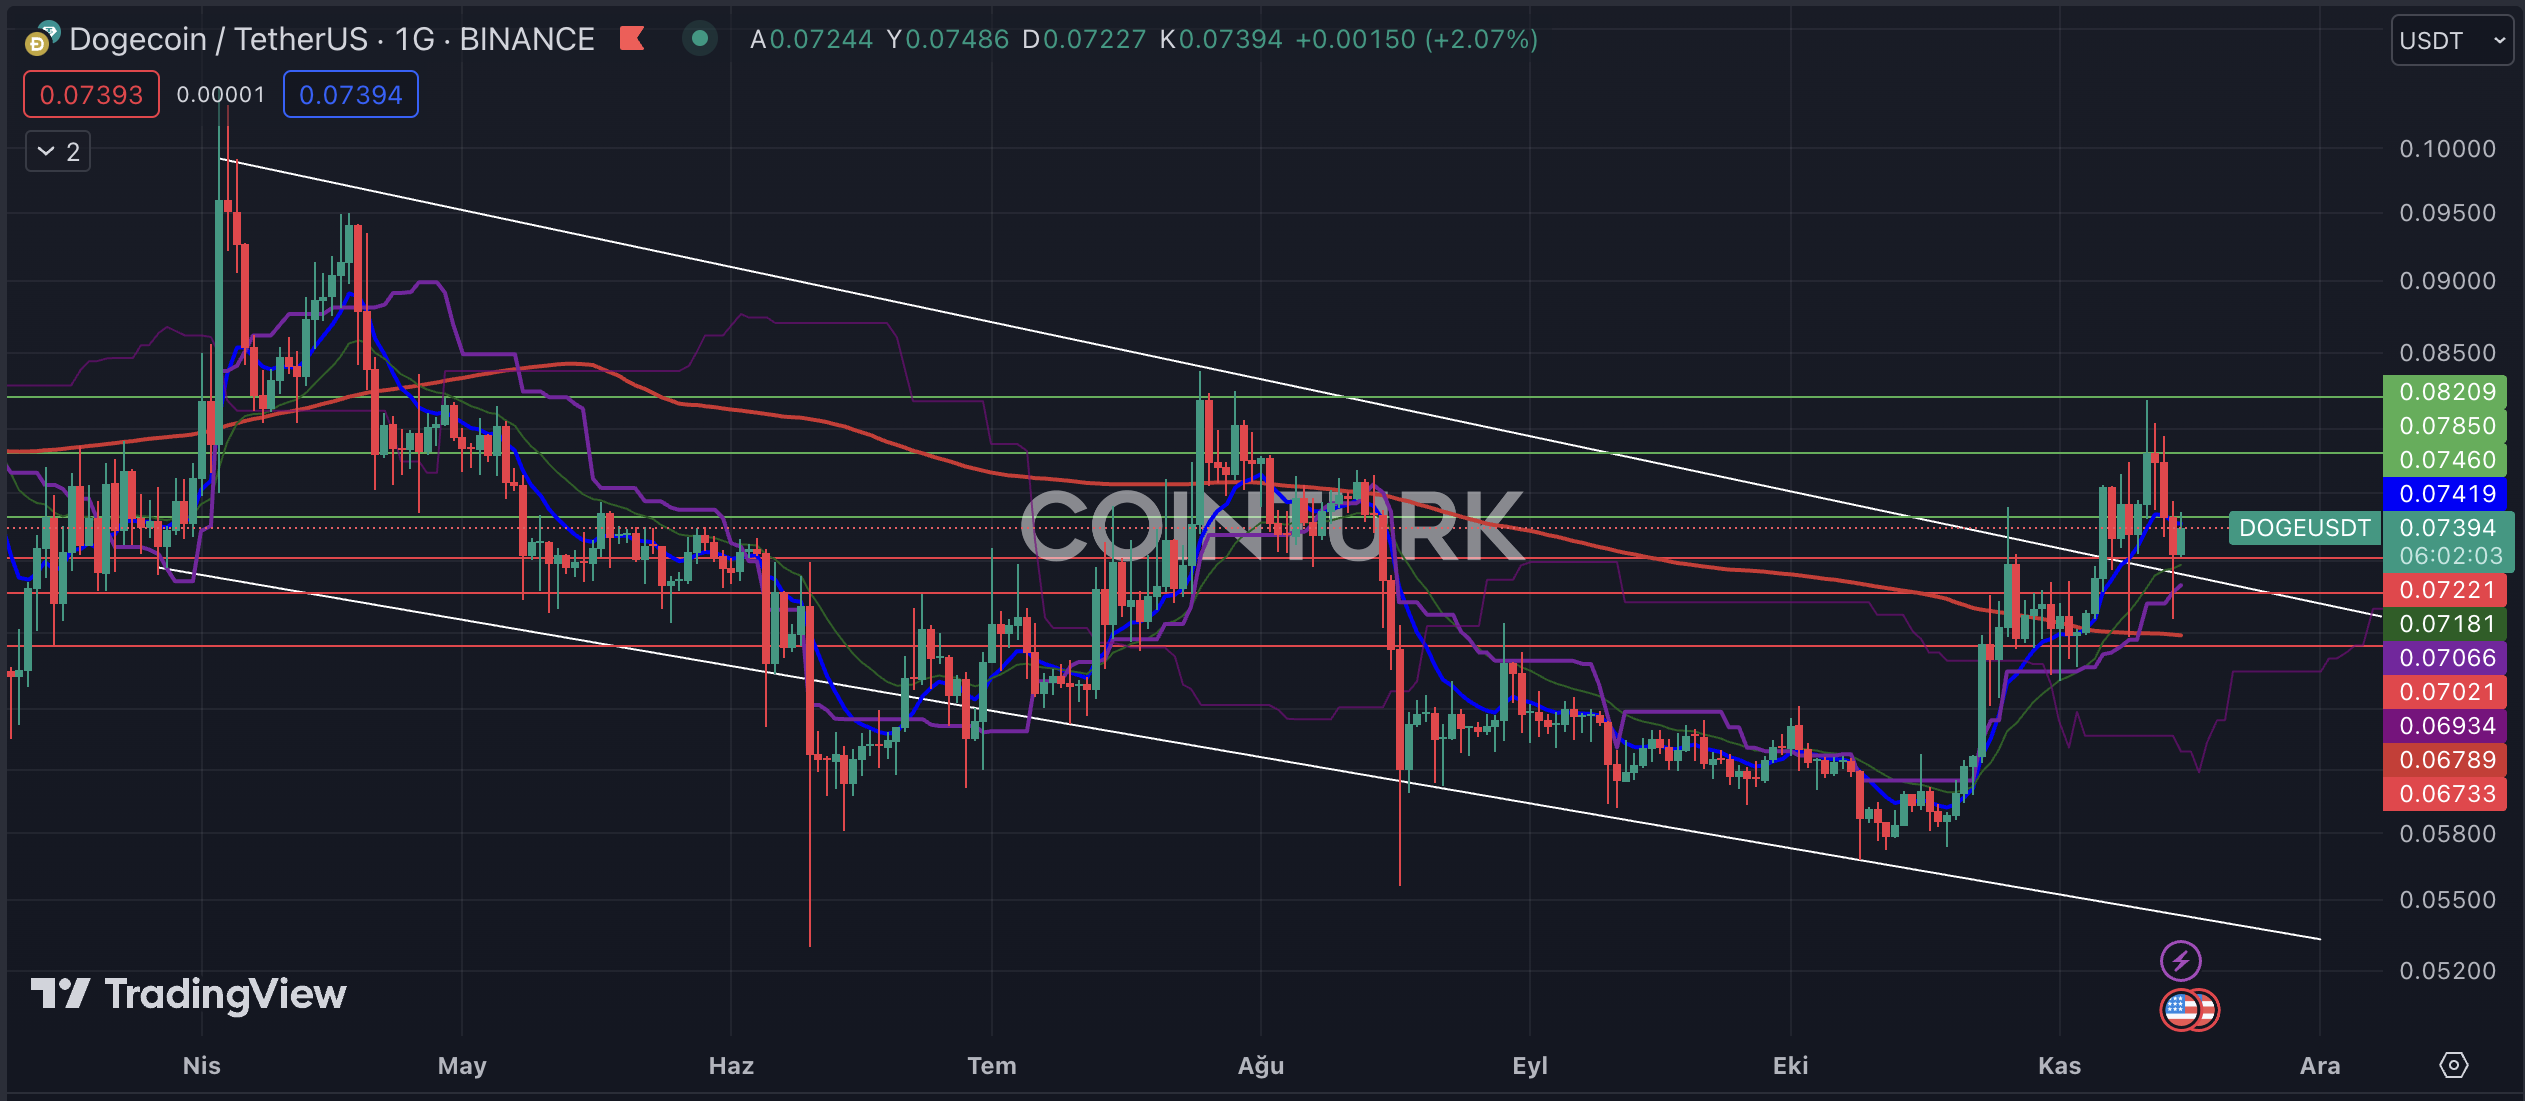
The notable formation structure on the daily chart of Dogecoin is a descending channel formation. With the recent breakout of resistance, DOGE has gained upward momentum, and the resistance line has served as a support line throughout the process. Despite two needle-like dips below the resistance line, the structure remained intact. However, this has resulted in significant losses for investors trading in the futures market.
Dogecoin의 일일 차트에서 주목할만한 형성 구조는 하강 채널 형성입니다. 최근 저항선이 돌파되면서 DOGE는 상승 모멘텀을 얻었으며 저항선은 전체 과정에서 지지선 역할을 했습니다. 저항선 아래로 바늘 모양의 두 번의 하락에도 불구하고 구조는 그대로 유지되었습니다. 그러나 이는 선물 시장에서 거래하는 투자자들에게 상당한 손실을 가져왔습니다.
The key support levels to watch for DOGE on the daily chart are $0.07221, $0.07021, and $0.06733. Particularly, if the daily bar closes below the intersection of the EMA 200 (red line) level and $0.06789, DOGE is likely to experience a significant loss in value, and the formation support line will be considered the target zone.
일일 차트에서 DOGE를 관찰할 주요 지원 수준은 $0.07221, $0.07021, $0.06733입니다. 특히 일일 막대가 EMA 200(빨간색 선) 수준과 $0.06789의 교차점 아래에서 닫히면 DOGE는 상당한 가치 손실을 경험할 가능성이 높으며 형성 지지선은 목표 영역으로 간주됩니다.
The key resistance levels to watch for DOGE on the daily chart are $0.07460, $0.07850, and $0.08209. Especially, if the daily bar closes above the significant obstacle at $0.08209, DOGE will gain momentum for further price increases.
일일 차트에서 DOGE를 관찰할 주요 저항 수준은 $0.07460, $0.07850, $0.08209입니다. 특히, 일일 막대가 $0.08209라는 상당한 장애물을 넘어서 마감되면 DOGE는 추가 가격 인상을 위한 모멘텀을 얻게 됩니다.
Dogecoin Hourly Chart Analysis
Dogecoin 시간별 차트 분석
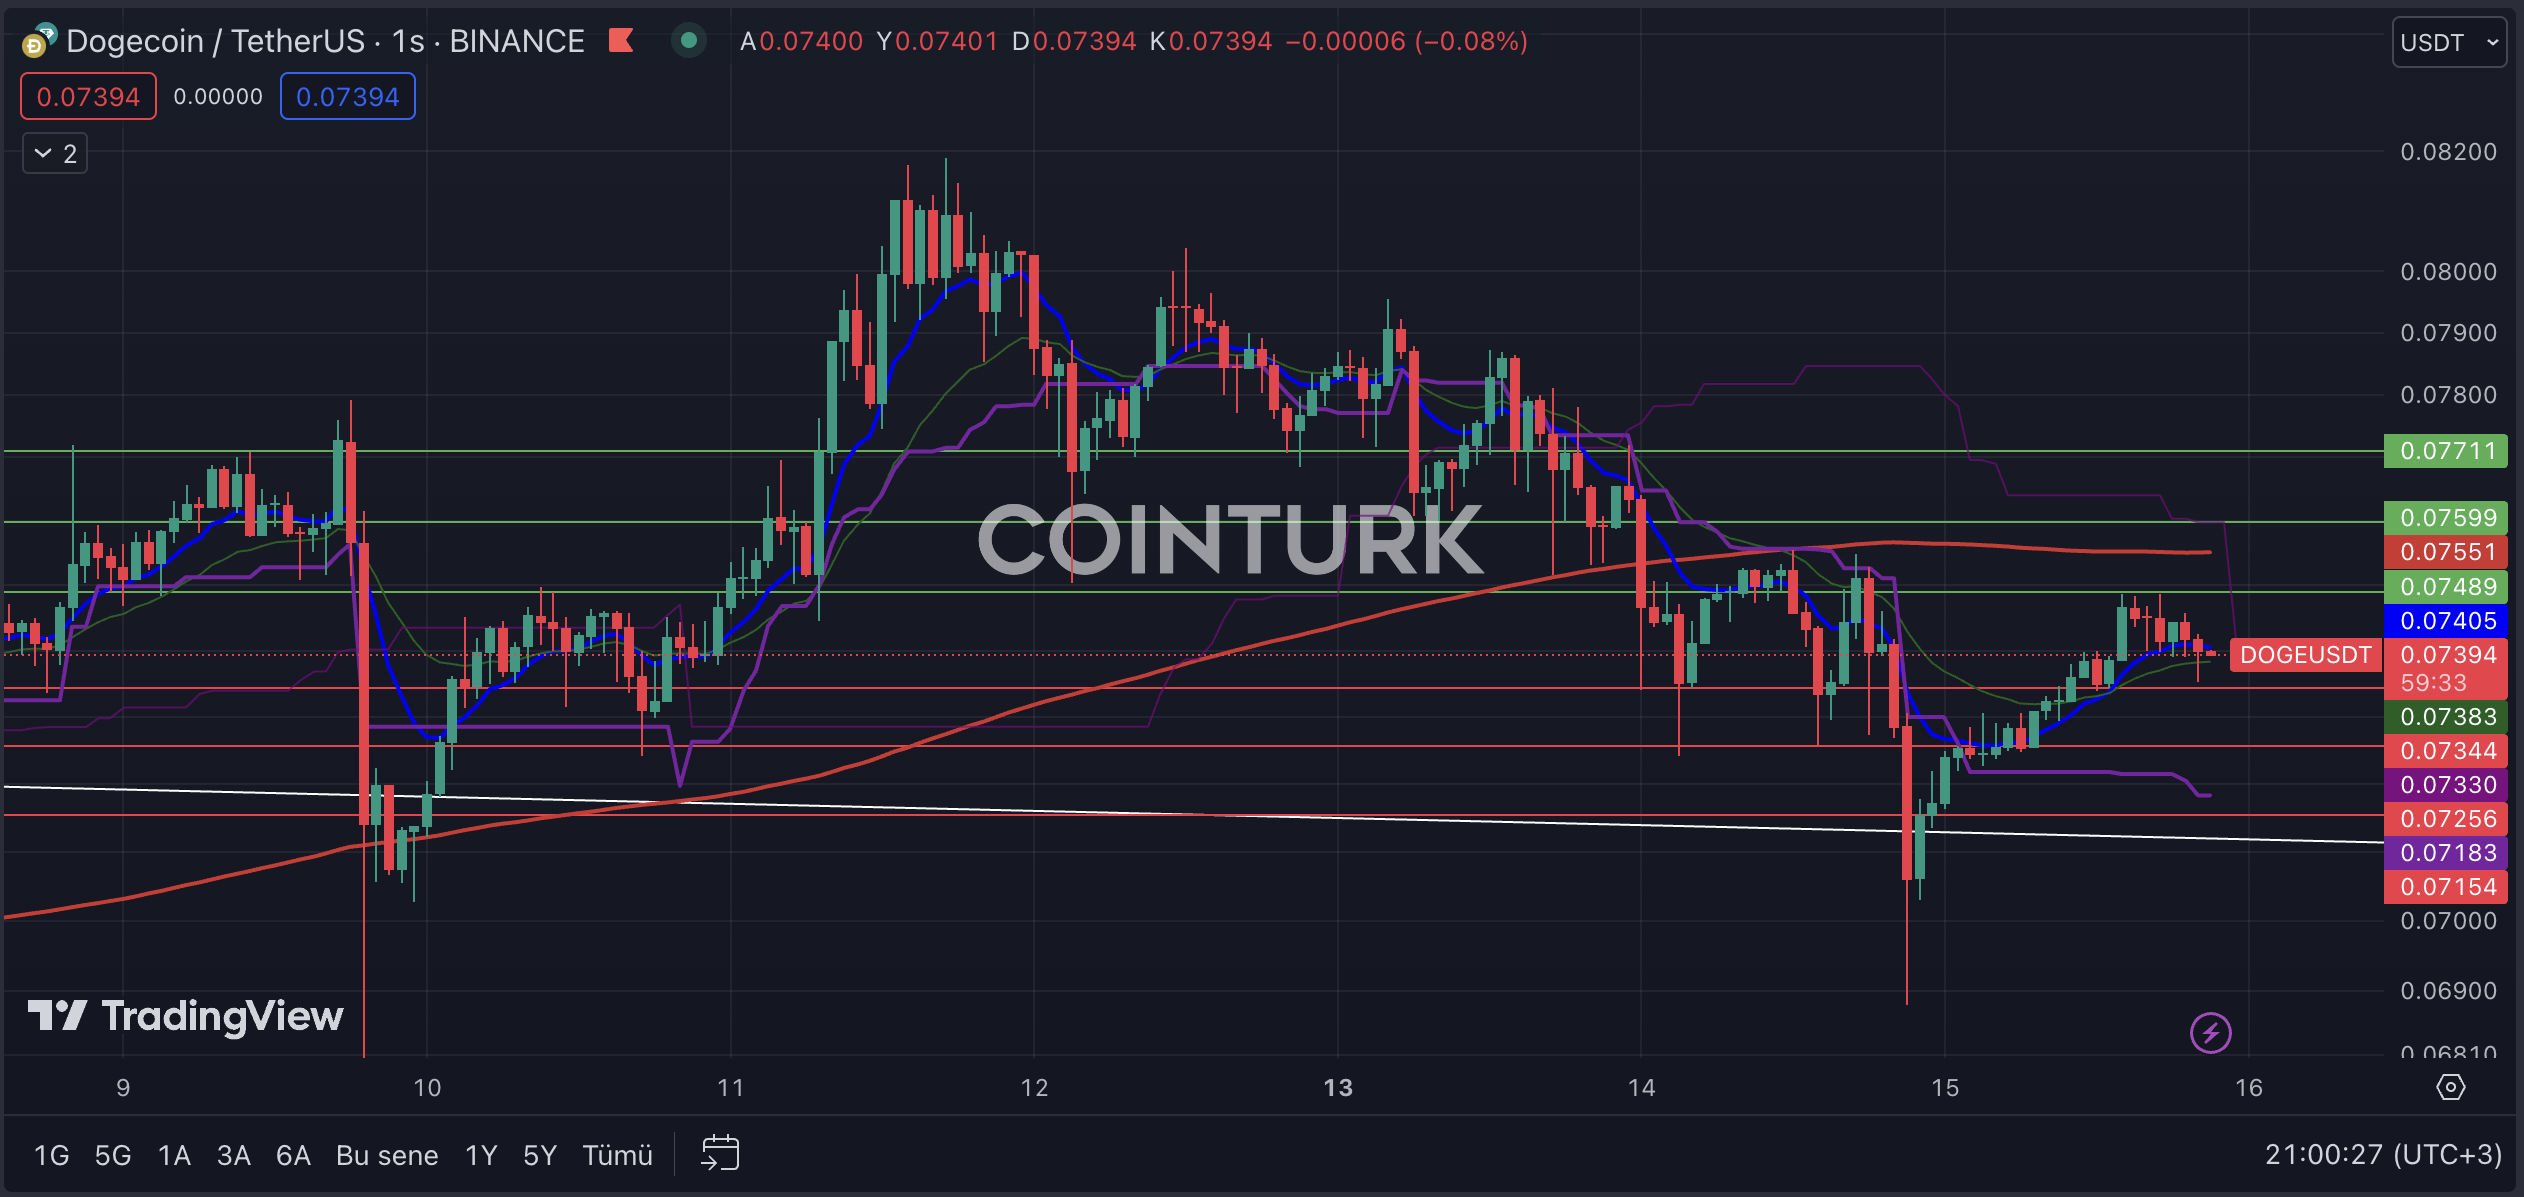
On the hourly chart, DOGE has been consolidating within a narrow range since November 9th, and a decrease in volatility has been observed. Although it is difficult to talk about a healthy formation structure at this point, DOGE staying below the EMA 200 (red line) level is a factor suppressing its short-term performance.
시간별 차트에서는 DOGE가 11월 9일부터 좁은 범위 내에서 횡보하는 모습을 보이며 변동성이 감소하는 모습을 보였습니다. 현시점에서 건전한 형성구조를 논하기는 어렵지만 DOGE가 EMA 200(빨간선) 수준을 밑돌고 있는 점은 단기적인 성과를 억제하는 요인이다.
The key support levels to watch for DOGE on the hourly chart are $0.07344, $0.07256, and $0.07154. Particularly, if the hourly bar closes below $0.07154, it will result in a significant loss of a key support level.
시간별 차트에서 DOGE를 관찰할 주요 지원 수준은 $0.07344, $0.07256 및 $0.07154입니다. 특히 시간당 막대가 $0.07154 아래로 마감되면 주요 지원 수준이 크게 손실됩니다.
The key resistance levels to watch for DOGE on the hourly chart are $0.07489, $0.07599, and $0.07711. Especially, if the bar closes above $0.07599, it will break the EMA 200 level and help DOGE gain momentum.
시간별 차트에서 DOGE를 관찰할 주요 저항 수준은 $0.07489, $0.07599, $0.07711입니다. 특히 막대가 $0.07599 이상으로 마감되면 EMA 200 수준을 깨고 DOGE가 추진력을 얻는 데 도움이 됩니다.
계속 읽기: https://en.coin-turk.com/dogecoin-technical-analytic-key-levels-and-insights/


 DogeHome
 Coin_Gabbar
 Crypto News Flash
 Optimisus
 TheCoinrise Media
 CoinPedia News
 DogeHome
 ETHNews
 Bitop Exchange


