Technical analysis is an essential indicator that investors in the cryptocurrency market, especially those trading in the futures market, need to constantly follow. So what does technical analysis tell us about Dogecoin, which is currently trading at $0.07412? Let’s delve into a detailed chart analysis, important support and resistance levels.
技術分析是加密貨幣市場投資者,尤其是期貨市場交易者需要不斷關注的重要指標。那麼,對於目前交易價格為 0.07412 美元的狗狗幣,技術分析告訴我們什麼呢?讓我們深入研究詳細的圖表分析、重要的支撐位和阻力位。
Dogecoin Chart Analysis
狗狗幣圖表分析
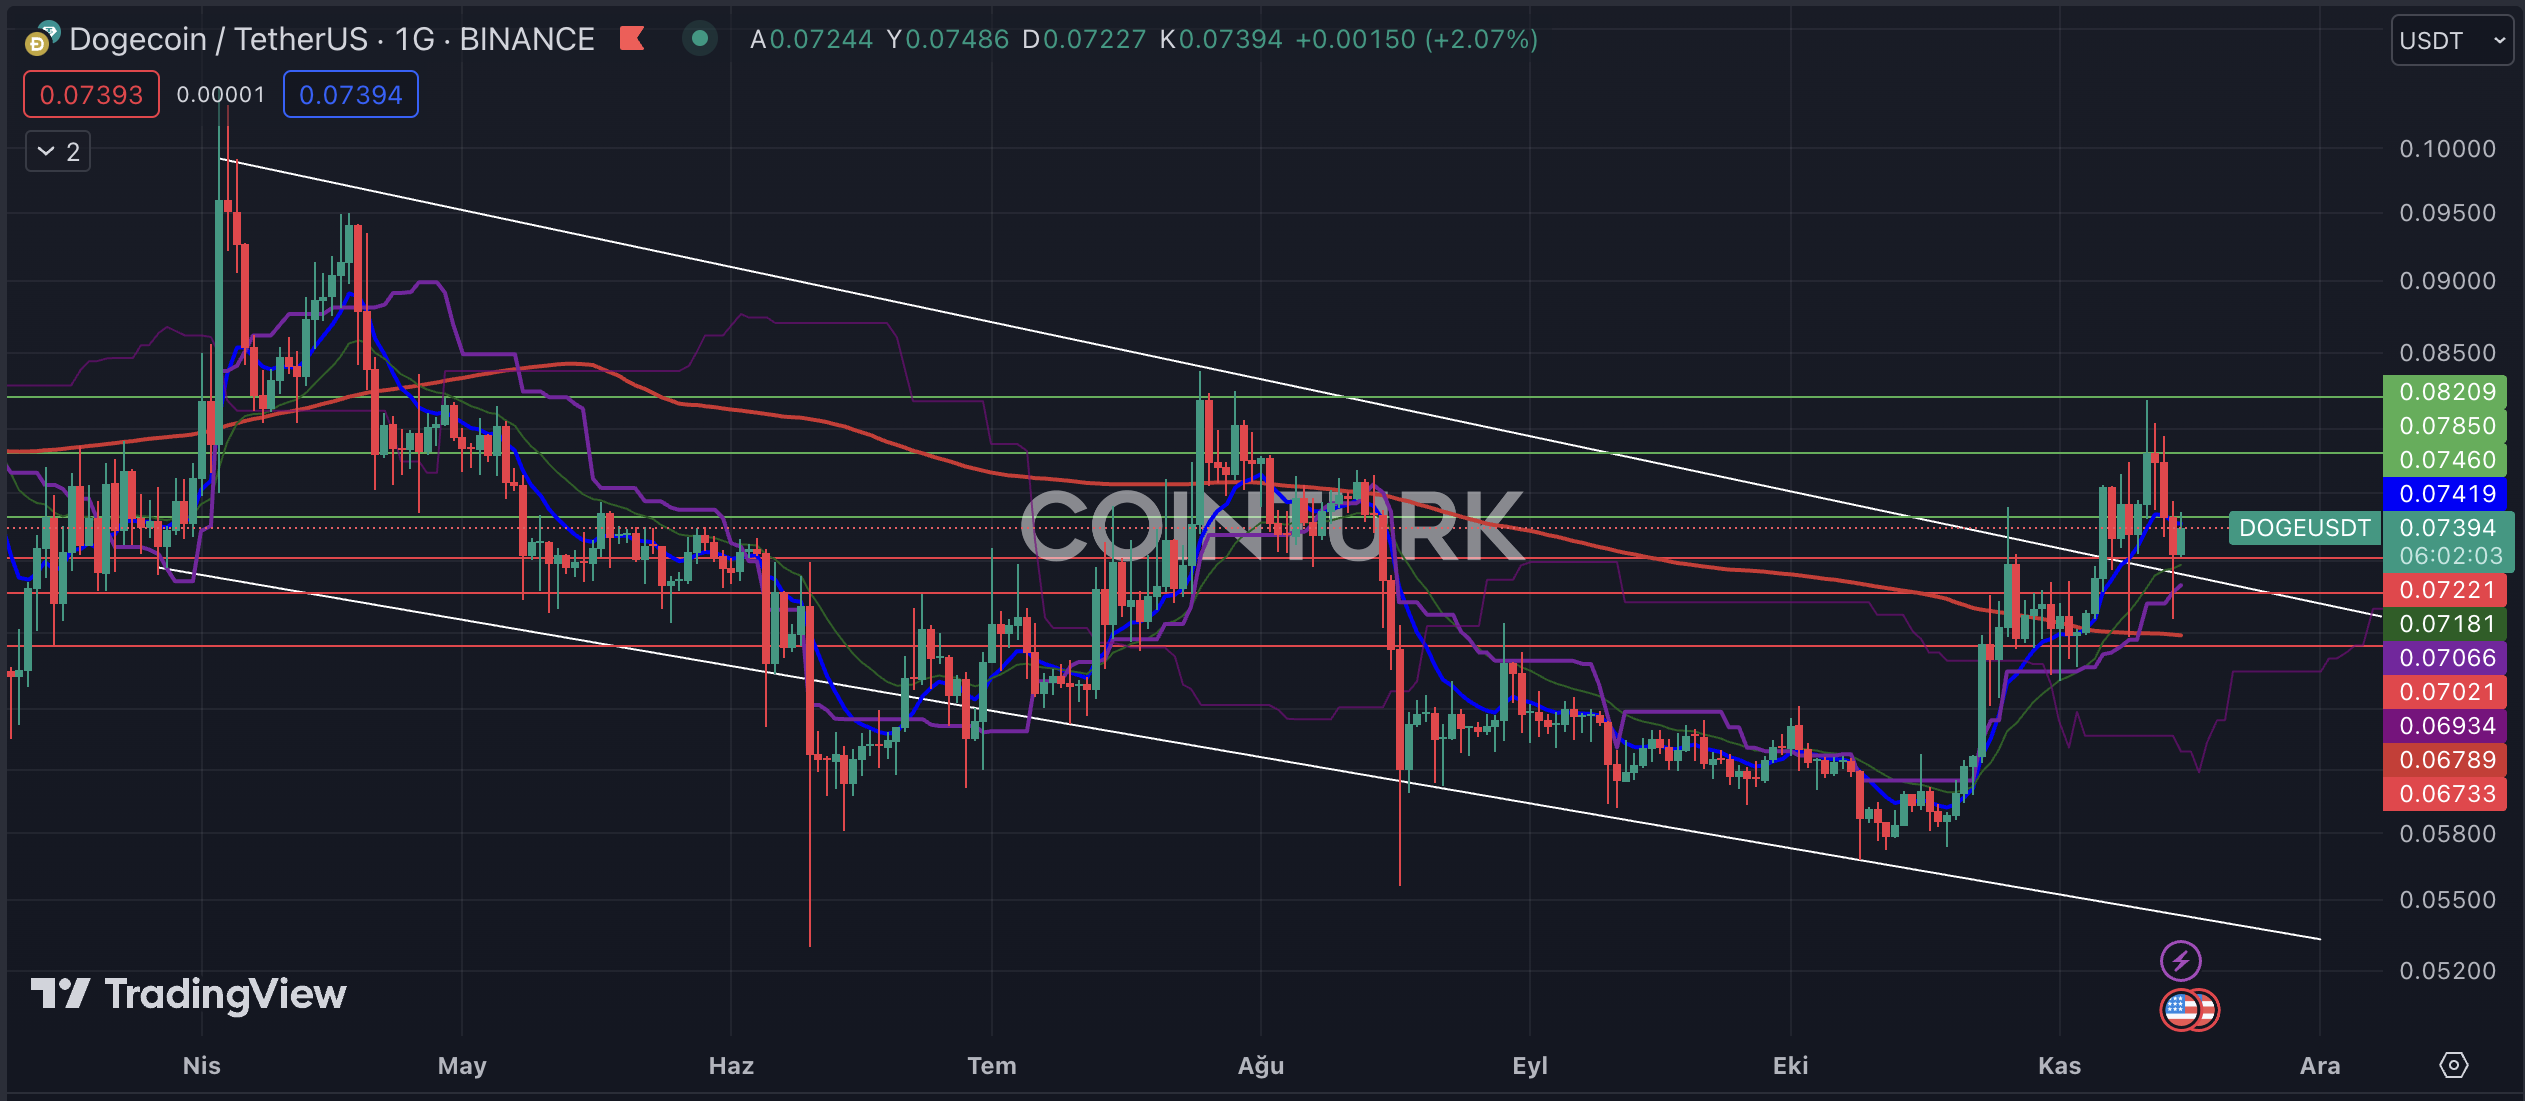
The notable formation structure on the daily chart of Dogecoin is a descending channel formation. With the recent breakout of resistance, DOGE has gained upward momentum, and the resistance line has served as a support line throughout the process. Despite two needle-like dips below the resistance line, the structure remained intact. However, this has resulted in significant losses for investors trading in the futures market.
狗狗幣日線圖上值得注意的形態結構是下降通道形態。隨著近期突破阻力,DOGE獲得了上漲動力,整個過程中阻力線扮演了支撐線的角色。儘管在阻力線以下兩次出現針狀下降,但結構仍然完好無損。然而,這卻給在期貨市場交易的投資者造成了重大損失。
The key support levels to watch for DOGE on the daily chart are $0.07221, $0.07021, and $0.06733. Particularly, if the daily bar closes below the intersection of the EMA 200 (red line) level and $0.06789, DOGE is likely to experience a significant loss in value, and the formation support line will be considered the target zone.
日線圖上值得關注的 DOGE 關鍵支撐位為 0.07221 美元、0.07021 美元和 0.06733 美元。特別是,如果日線收盤價低於 EMA 200(紅線)水平與 0.06789 美元的交點,DOGE 的價值可能會大幅下跌,並且形成的支撐線將被視為目標區域。
The key resistance levels to watch for DOGE on the daily chart are $0.07460, $0.07850, and $0.08209. Especially, if the daily bar closes above the significant obstacle at $0.08209, DOGE will gain momentum for further price increases.
日線圖上需要關注的 DOGE 關鍵阻力位在 0.07460 美元、0.07850 美元和 0.08209 美元。特別是,如果日線收盤價高於 0.08209 美元的重大障礙,DOGE 將獲得進一步價格上漲的動力。

Dogecoin Hourly Chart Analysis
狗狗幣每小時圖表分析
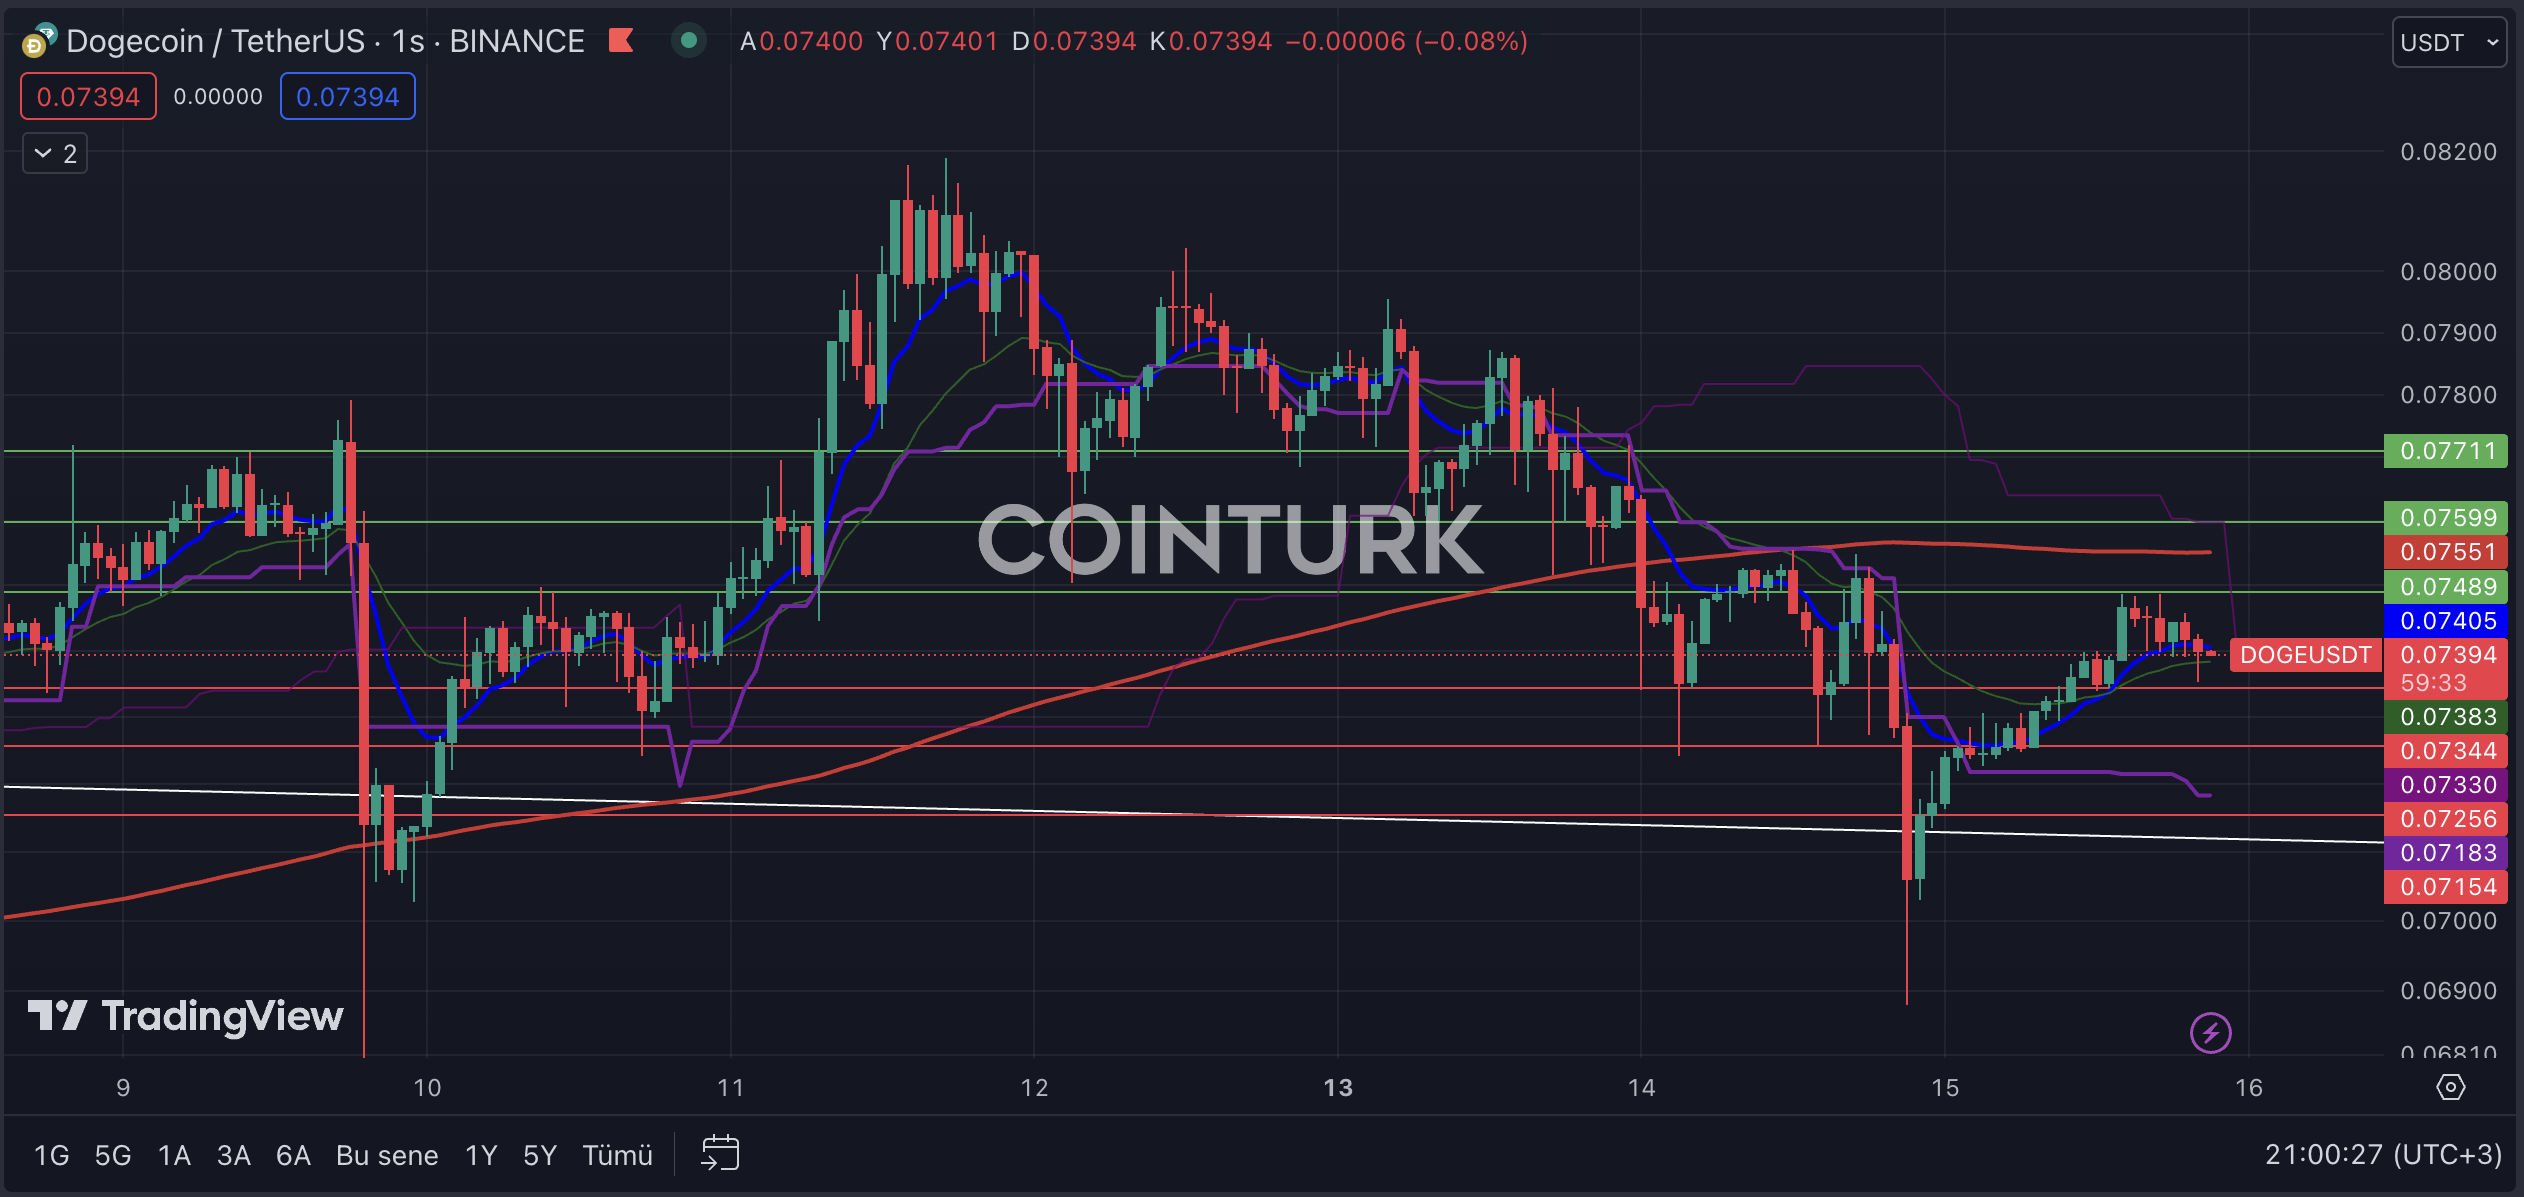
On the hourly chart, DOGE has been consolidating within a narrow range since November 9th, and a decrease in volatility has been observed. Although it is difficult to talk about a healthy formation structure at this point, DOGE staying below the EMA 200 (red line) level is a factor suppressing its short-term performance.
小時圖上,DOGE自11月9日以來一直窄幅盤整,波動性下降。儘管目前很難談論健康的形成結構,但 DOGE 保持在 200 EMA(紅線)水平下方是抑制其短期表現的因素。
The key support levels to watch for DOGE on the hourly chart are $0.07344, $0.07256, and $0.07154. Particularly, if the hourly bar closes below $0.07154, it will result in a significant loss of a key support level.
小時圖上值得關注的 DOGE 關鍵支撐位為 0.07344 美元、0.07256 美元和 0.07154 美元。特別是,如果小時線收盤價低於 0.07154 美元,將導致關鍵支撐位大幅下跌。
The key resistance levels to watch for DOGE on the hourly chart are $0.07489, $0.07599, and $0.07711. Especially, if the bar closes above $0.07599, it will break the EMA 200 level and help DOGE gain momentum.
小時圖上需要關注的 DOGE 關鍵阻力位在 0.07489 美元、0.07599 美元和 0.07711 美元。特別是,如果收盤價高於 0.07599 美元,它將突破 EMA 200 水平並幫助 DOGE 獲得動力。

繼續閱讀:https://en.coin-turk.com/dogecoin-technical-analysis-key-levels-and-insights/


 CFN
CFN U_Today
 Thecoinrepublic.com
 DogeHome
 Optimisus
 Optimisus
 DeFi Planet
 Crypto Daily™
 BlockchainReporter


