Technical analysis is an essential indicator that investors in the cryptocurrency market, especially those trading in the futures market, need to constantly follow. So what does technical analysis tell us about Dogecoin, which is currently trading at $0.07412? Let’s delve into a detailed chart analysis, important support and resistance levels.
Die technische Analyse ist ein wesentlicher Indikator, den Anleger auf dem Kryptowährungsmarkt, insbesondere diejenigen, die auf dem Terminmarkt handeln, ständig im Auge behalten müssen. Was sagt uns die technische Analyse über Dogecoin, der derzeit bei 0,07412 US-Dollar gehandelt wird? Lassen Sie uns in eine detaillierte Diagrammanalyse sowie wichtige Unterstützungs- und Widerstandsniveaus eintauchen.
Dogecoin Chart Analysis
Dogecoin-Chartanalyse
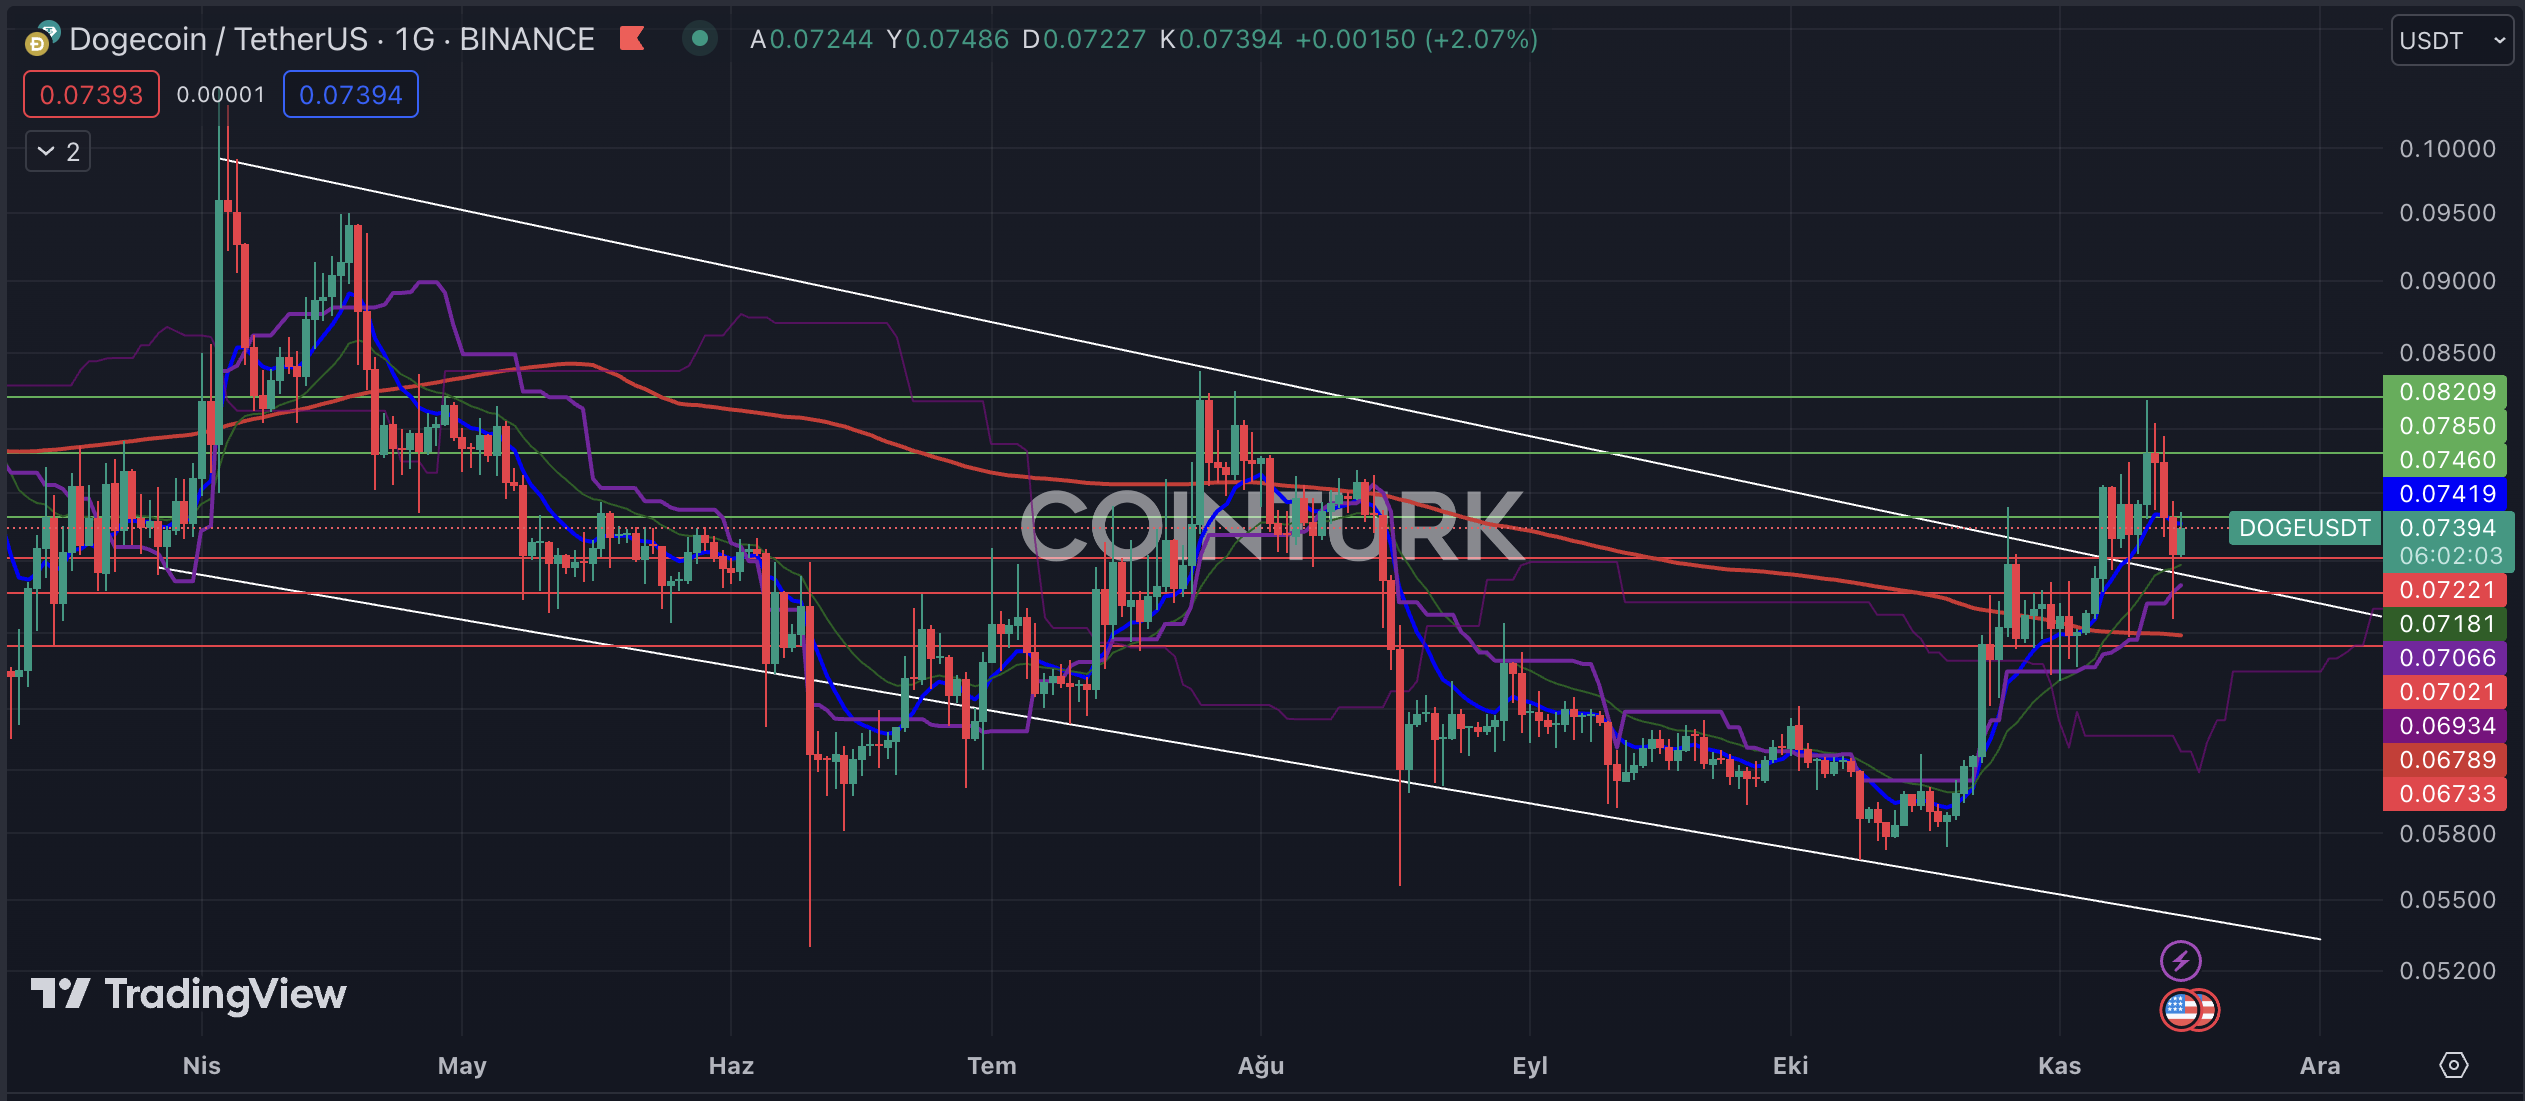
The notable formation structure on the daily chart of Dogecoin is a descending channel formation. With the recent breakout of resistance, DOGE has gained upward momentum, and the resistance line has served as a support line throughout the process. Despite two needle-like dips below the resistance line, the structure remained intact. However, this has resulted in significant losses for investors trading in the futures market.
Die bemerkenswerte Formationsstruktur auf dem Tages-Chart von Dogecoin ist eine absteigende Kanalformation. Mit dem jüngsten Ausbruch des Widerstands hat DOGE an Aufwärtsdynamik gewonnen und die Widerstandslinie diente während des gesamten Prozesses als Unterstützungslinie. Trotz zweier nadelartiger Einbrüche unterhalb der Widerstandslinie blieb die Struktur intakt. Dies hat jedoch zu erheblichen Verlusten für Anleger geführt, die auf dem Terminmarkt handeln.
The key support levels to watch for DOGE on the daily chart are $0.07221, $0.07021, and $0.06733. Particularly, if the daily bar closes below the intersection of the EMA 200 (red line) level and $0.06789, DOGE is likely to experience a significant loss in value, and the formation support line will be considered the target zone.
Die wichtigsten Unterstützungsniveaus für DOGE auf dem Tages-Chart sind 0,07221 $, 0,07021 $ und 0,06733 $. Insbesondere wenn der Tagesbalken unter dem Schnittpunkt des EMA 200-Niveaus (rote Linie) und 0,06789 US-Dollar schließt, wird DOGE wahrscheinlich einen erheblichen Wertverlust erleiden und die Formationsunterstützungslinie wird als Zielzone betrachtet.
The key resistance levels to watch for DOGE on the daily chart are $0.07460, $0.07850, and $0.08209. Especially, if the daily bar closes above the significant obstacle at $0.08209, DOGE will gain momentum for further price increases.
Die wichtigsten Widerstandsniveaus für DOGE auf dem Tages-Chart sind 0,07460 $, 0,07850 $ und 0,08209 $. Insbesondere wenn der Tagesbalken über dem signifikanten Hindernis bei 0,08209 $ schließt, wird DOGE an Dynamik für weitere Preiserhöhungen gewinnen.

Dogecoin Hourly Chart Analysis
Analyse des stündlichen Dogecoin-Charts
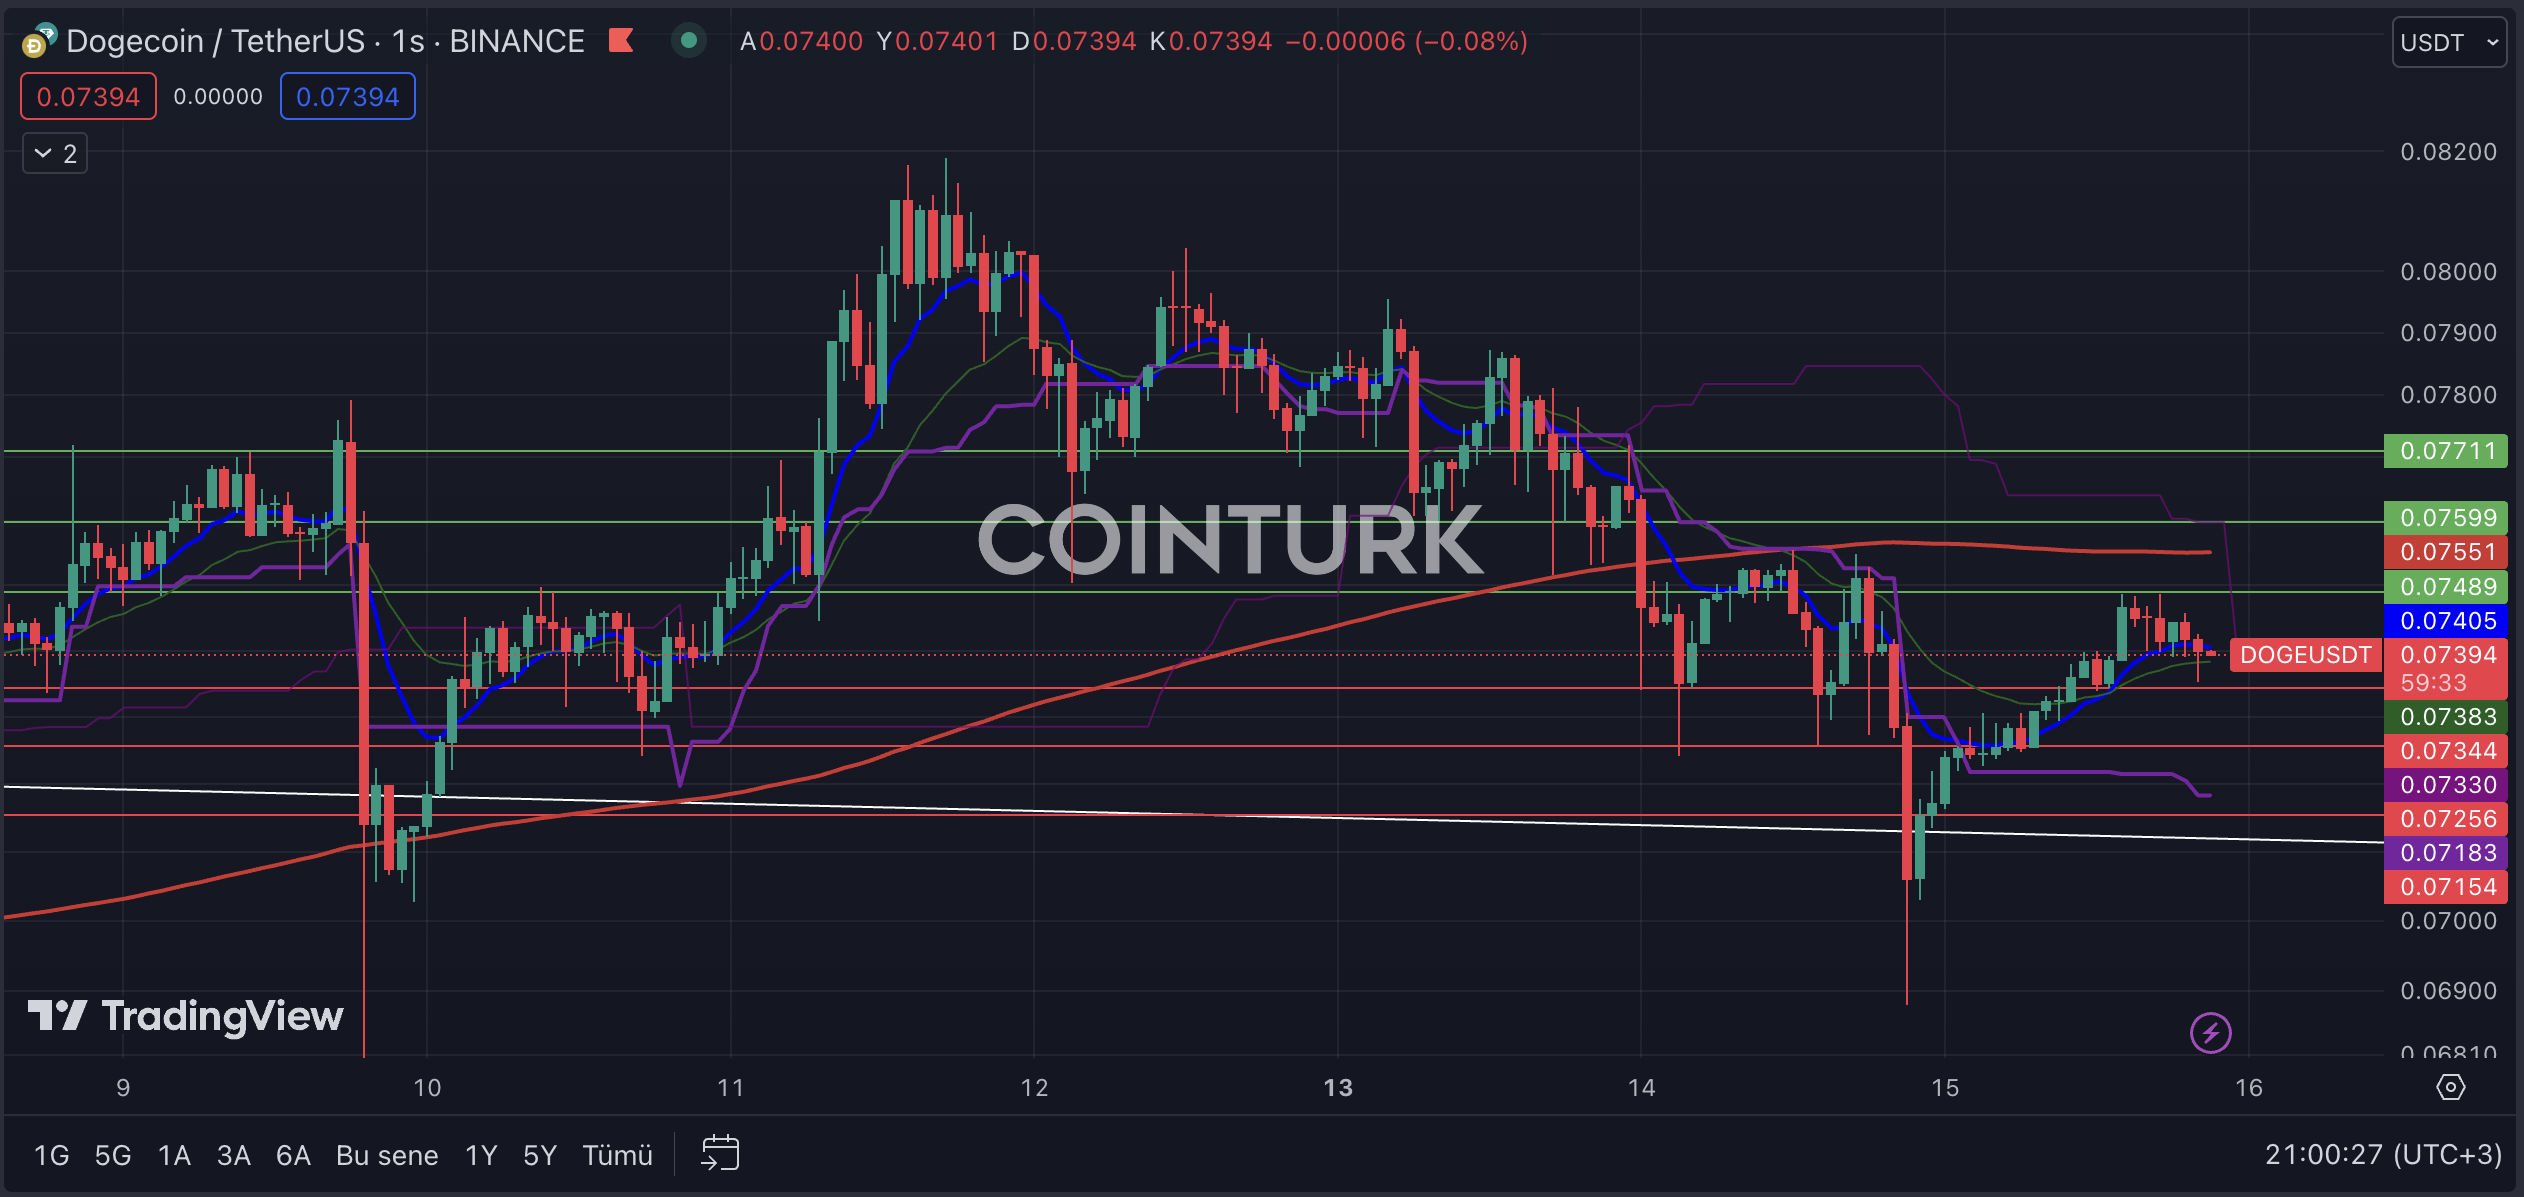
On the hourly chart, DOGE has been consolidating within a narrow range since November 9th, and a decrease in volatility has been observed. Although it is difficult to talk about a healthy formation structure at this point, DOGE staying below the EMA 200 (red line) level is a factor suppressing its short-term performance.
Auf dem Stunden-Chart konsolidiert sich DOGE seit dem 9. November innerhalb einer engen Spanne und es ist ein Rückgang der Volatilität zu beobachten. Obwohl es zum jetzigen Zeitpunkt schwierig ist, von einer gesunden Formationsstruktur zu sprechen, ist ein Verbleib von DOGE unter dem EMA 200-Niveau (rote Linie) ein Faktor, der seine kurzfristige Leistung beeinträchtigt.
The key support levels to watch for DOGE on the hourly chart are $0.07344, $0.07256, and $0.07154. Particularly, if the hourly bar closes below $0.07154, it will result in a significant loss of a key support level.
Die wichtigsten Unterstützungsniveaus für DOGE auf dem Stunden-Chart sind 0,07344 $, 0,07256 $ und 0,07154 $. Insbesondere wenn der Stundenbalken unter 0,07154 US-Dollar schließt, führt dies zu einem erheblichen Verlust eines wichtigen Unterstützungsniveaus.
The key resistance levels to watch for DOGE on the hourly chart are $0.07489, $0.07599, and $0.07711. Especially, if the bar closes above $0.07599, it will break the EMA 200 level and help DOGE gain momentum.
Die wichtigsten Widerstandsniveaus für DOGE auf dem Stunden-Chart sind 0,07489 $, 0,07599 $ und 0,07711 $. Insbesondere wenn der Balken über 0,07599 US-Dollar schließt, wird er die EMA-200-Marke durchbrechen und DOGE dabei helfen, an Dynamik zu gewinnen.

Weiterlesen: https://en.coin-turk.com/dogecoin-technical-analysis-key-levels-and-insights/


 crypto.ro English
 DogeHome
 Crypto News Land
 ETHNews
 CFN
CFN U_Today
 Thecoinrepublic.com
 Optimisus


