Technical analysis is an essential indicator that investors in the cryptocurrency market, especially those trading in the futures market, need to constantly follow. So what does technical analysis tell us about Dogecoin, which is currently trading at $0.07412? Let’s delve into a detailed chart analysis, important support and resistance levels.
テクニカル分析は、暗号通貨市場の投資家、特に先物市場で取引する投資家が常に従う必要がある重要な指標です。それでは、テクニカル分析は現在0.07412ドルで取引されているドージコインについて何を教えてくれるのでしょうか?詳細なチャート分析、重要なサポートとレジスタンスのレベルを詳しく見てみましょう。
Dogecoin Chart Analysis
ドージコインチャート分析
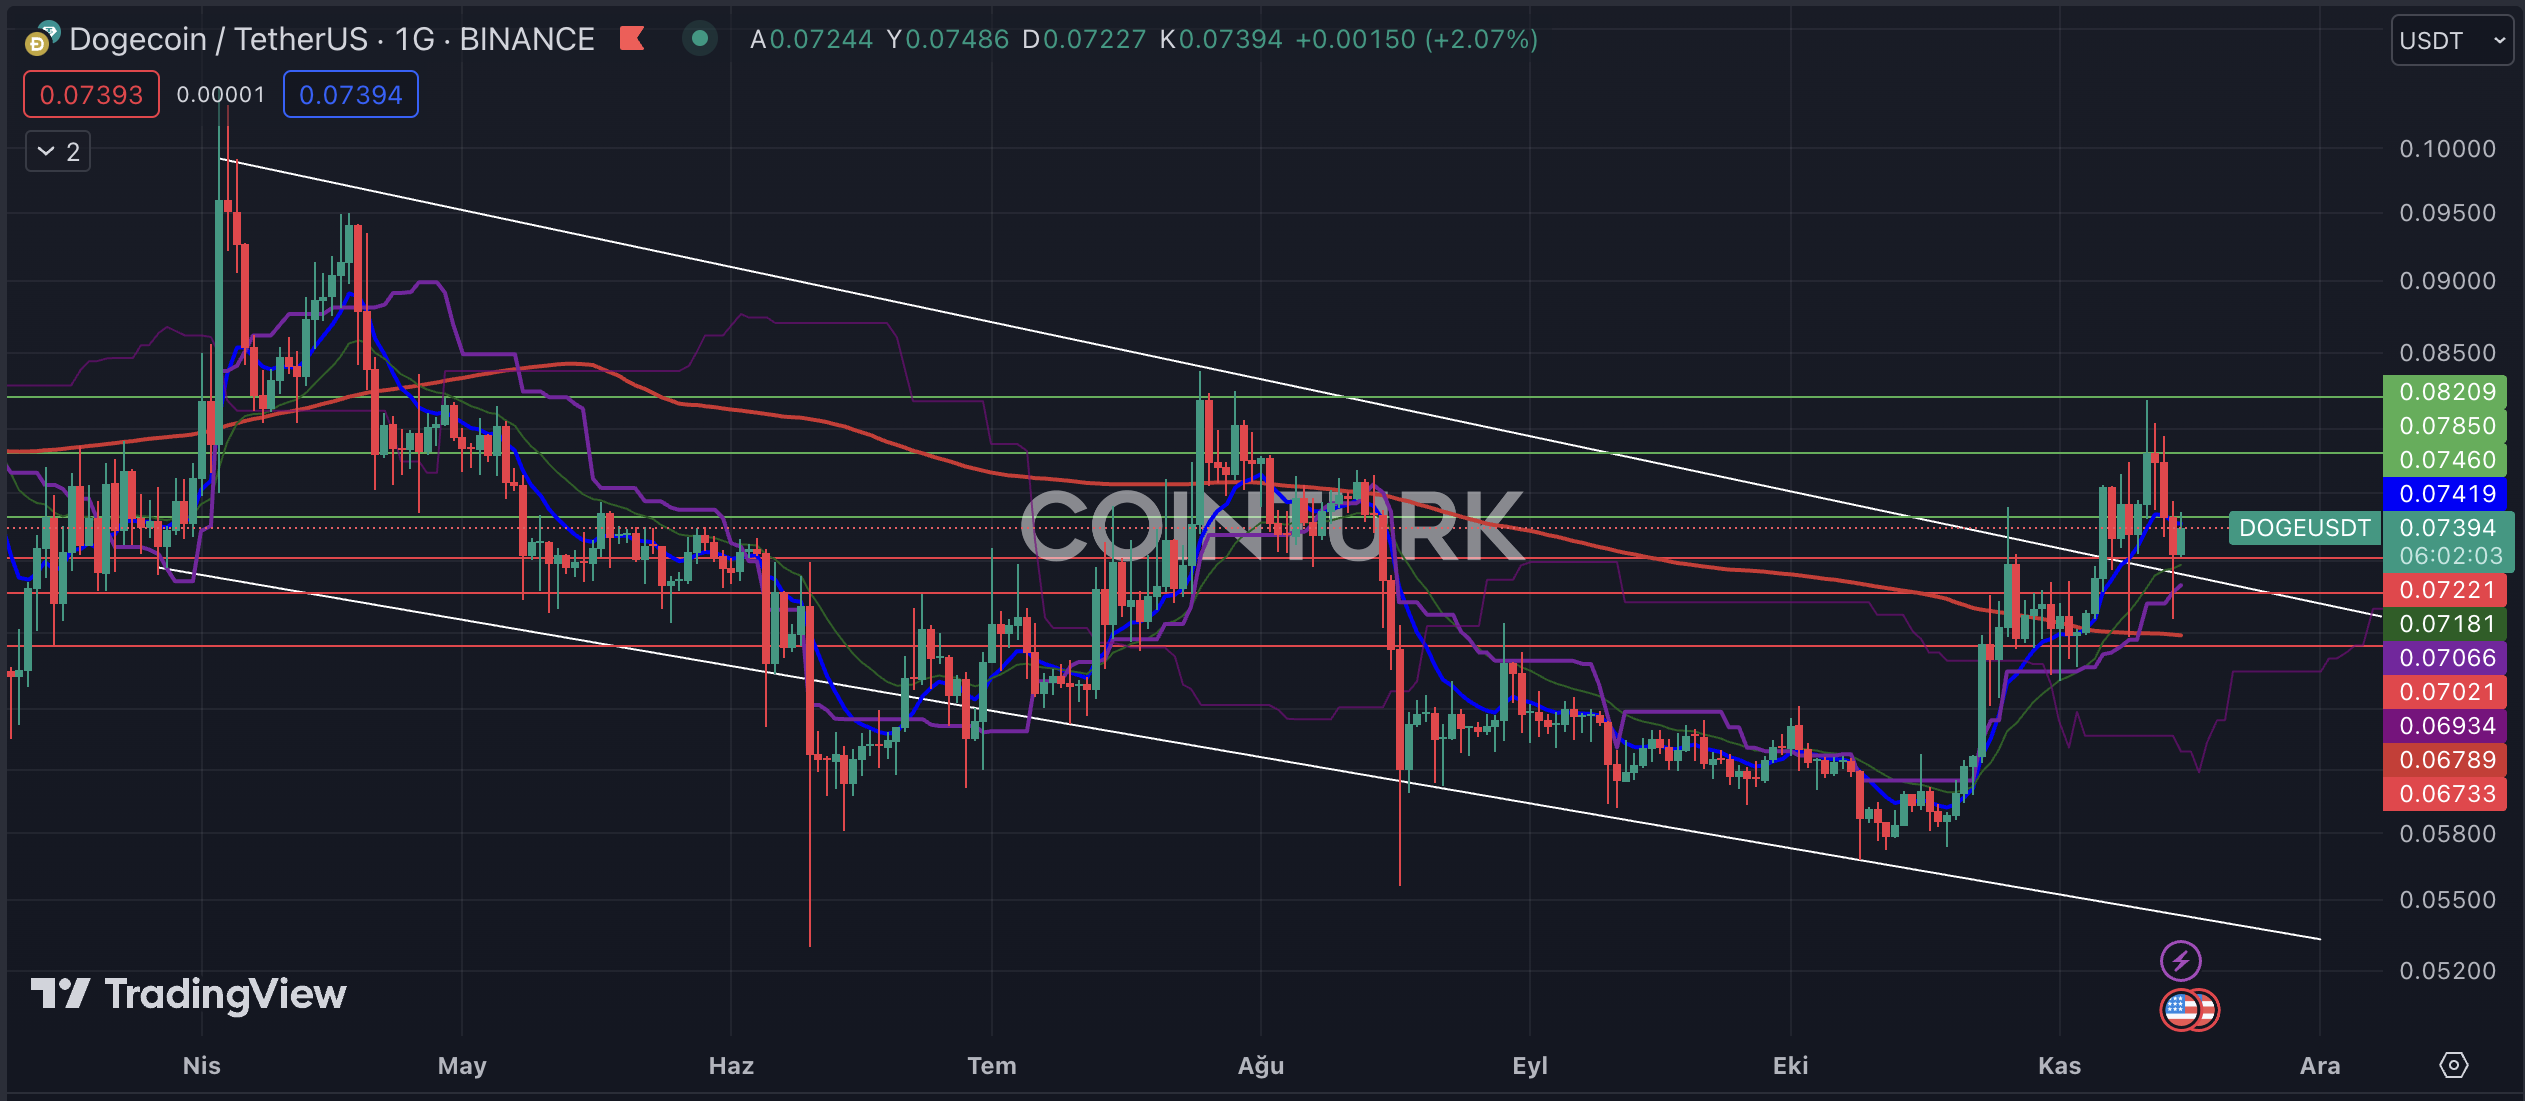
The notable formation structure on the daily chart of Dogecoin is a descending channel formation. With the recent breakout of resistance, DOGE has gained upward momentum, and the resistance line has served as a support line throughout the process. Despite two needle-like dips below the resistance line, the structure remained intact. However, this has resulted in significant losses for investors trading in the futures market.
ドージコインの日足チャートで注目すべき形成構造は、下降チャネル形成です。最近のレジスタンスの突破により、DOGEは上昇の勢いを増し、レジスタンスラインはプロセス全体を通じてサポートラインとして機能しました。レジスタンスラインを2回下回った針状の下落にもかかわらず、構造は無傷のままでした。しかし、これは先物市場で取引する投資家に多大な損失をもたらす結果となりました。
The key support levels to watch for DOGE on the daily chart are $0.07221, $0.07021, and $0.06733. Particularly, if the daily bar closes below the intersection of the EMA 200 (red line) level and $0.06789, DOGE is likely to experience a significant loss in value, and the formation support line will be considered the target zone.
日足チャートでDOGEに注目すべき主要なサポートレベルは、0.07221ドル、0.07021ドル、0.06733ドルです。特に、日足がEMA 200(赤い線)レベルと0.06789ドルの交点を下回って終了した場合、DOGEは大幅な価値の損失を経験する可能性があり、フォーメーションサポートラインがターゲットゾーンと見なされます。
The key resistance levels to watch for DOGE on the daily chart are $0.07460, $0.07850, and $0.08209. Especially, if the daily bar closes above the significant obstacle at $0.08209, DOGE will gain momentum for further price increases.
日足チャートでDOGEに注目すべき主要な抵抗レベルは、0.07460ドル、0.07850ドル、0.08209ドルです。特に、日足が0.08209ドルの重要な障害を上回って終了した場合、DOGEはさらなる価格上昇の勢いを得るでしょう。

Dogecoin Hourly Chart Analysis
ドージコイン時間足チャート分析
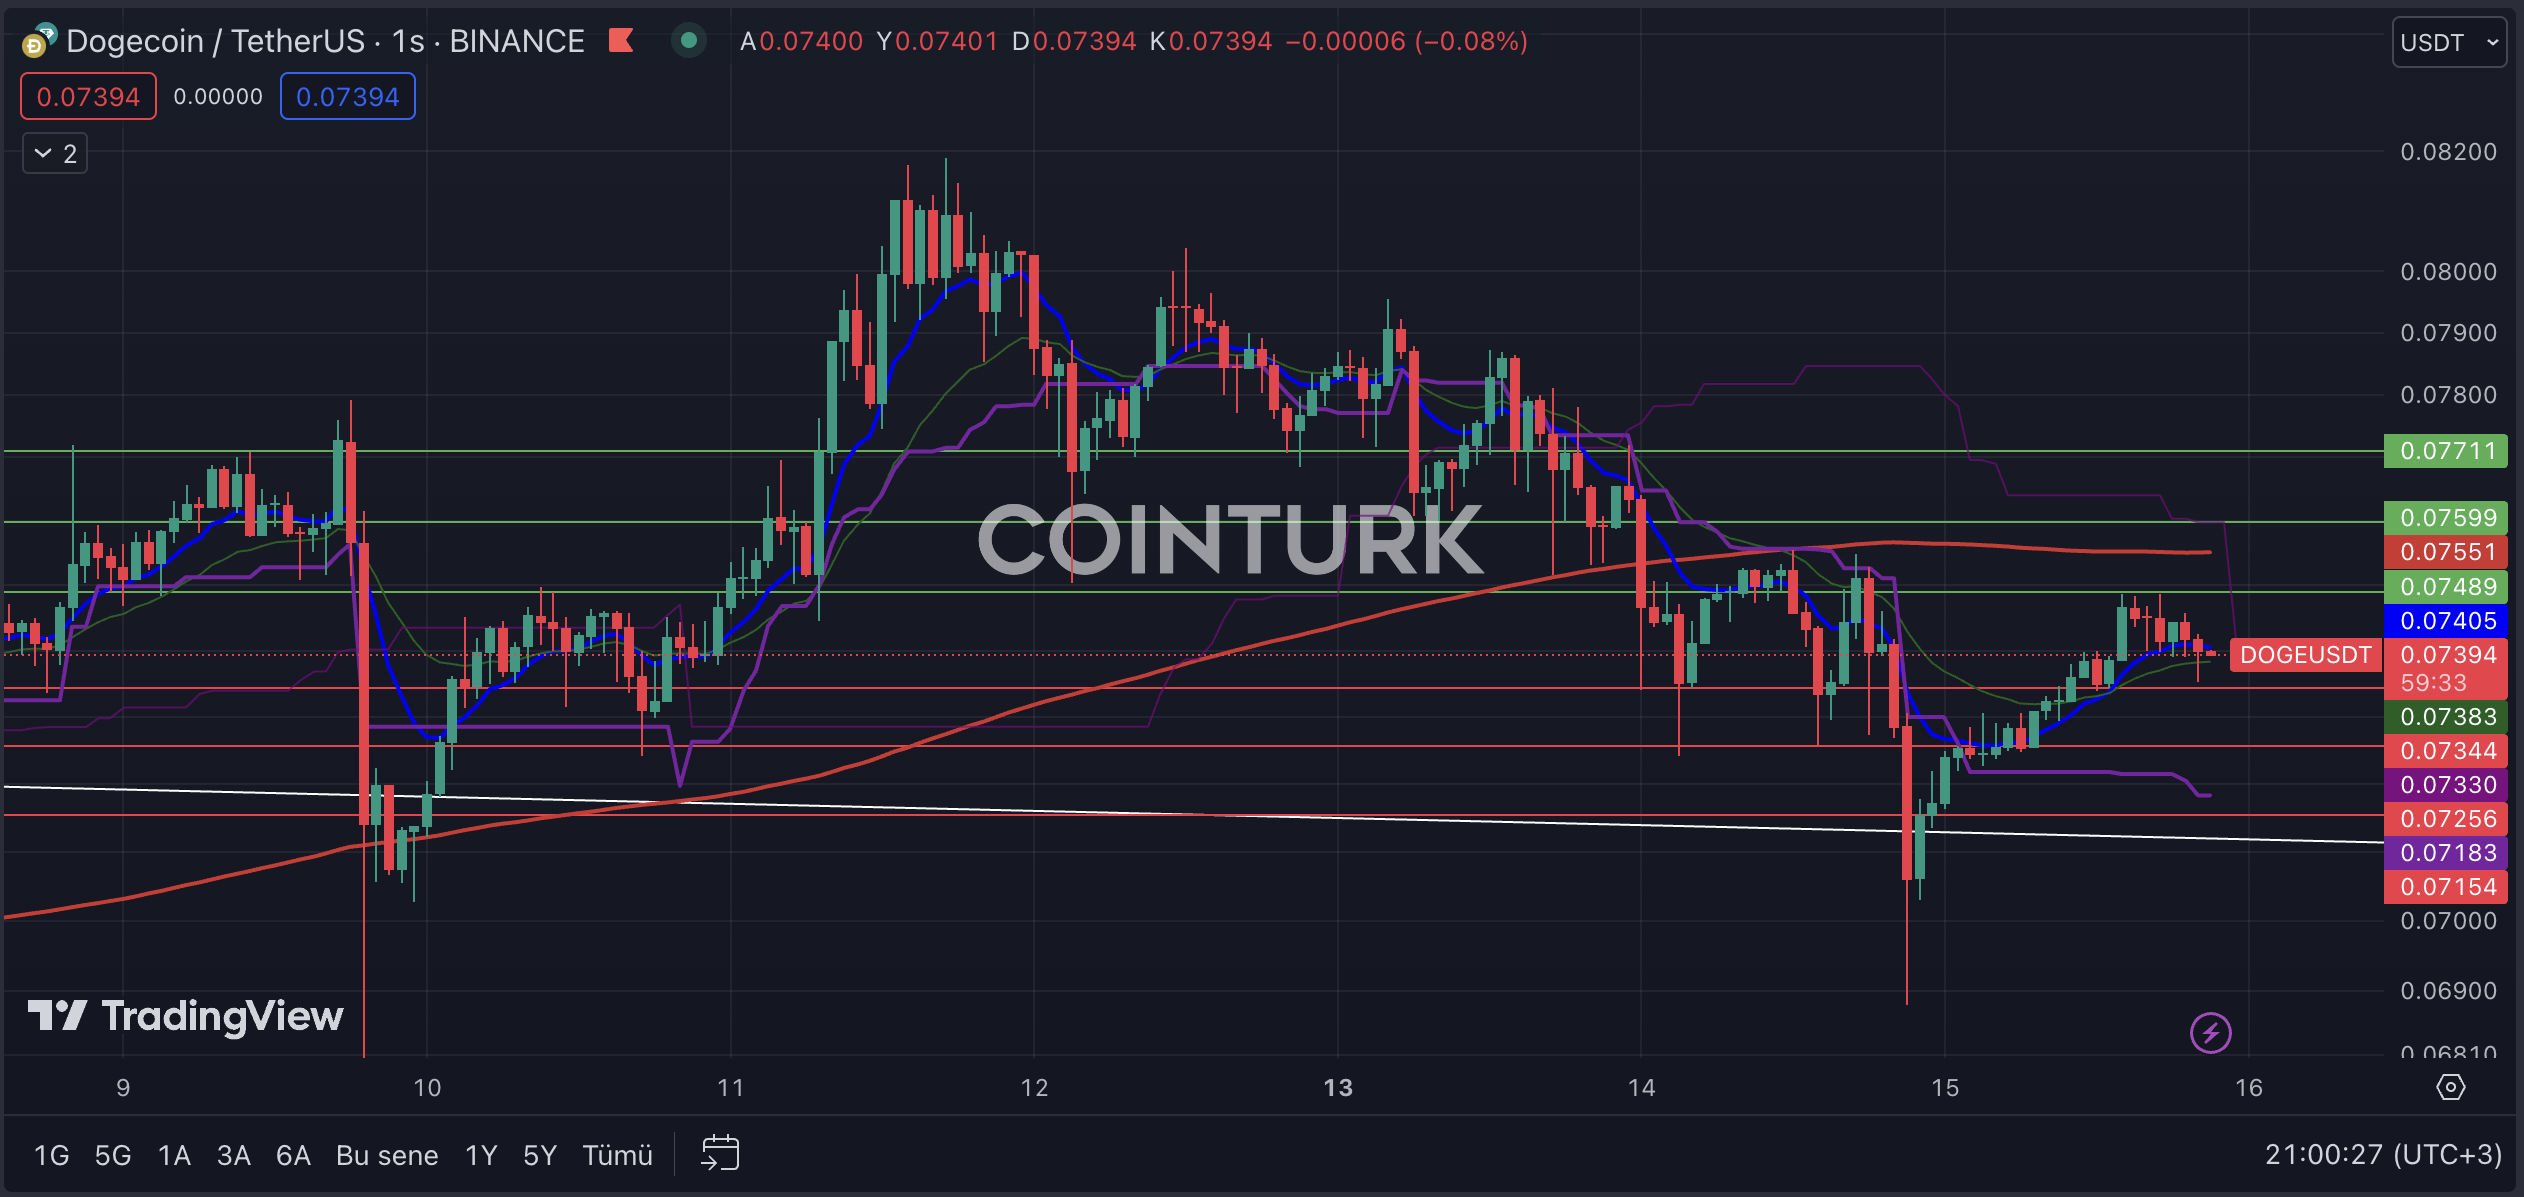
On the hourly chart, DOGE has been consolidating within a narrow range since November 9th, and a decrease in volatility has been observed. Although it is difficult to talk about a healthy formation structure at this point, DOGE staying below the EMA 200 (red line) level is a factor suppressing its short-term performance.
時間足チャートでは、DOGEは11月9日以降狭い範囲内で値固めを続けており、ボラティリティの低下が観察されています。現時点で健全なフォーメーション構造について語ることは困難ですが、DOGE が EMA 200 (赤線) レベルを下回っていることが、短期的なパフォーマンスを抑制する要因となっています。
The key support levels to watch for DOGE on the hourly chart are $0.07344, $0.07256, and $0.07154. Particularly, if the hourly bar closes below $0.07154, it will result in a significant loss of a key support level.
時間足チャートでDOGEに注目すべき主要なサポートレベルは、0.07344ドル、0.07256ドル、0.07154ドルです。特に、時間足が0.07154ドルを下回って終了した場合、主要なサポートレベルの大幅な損失につながります。
The key resistance levels to watch for DOGE on the hourly chart are $0.07489, $0.07599, and $0.07711. Especially, if the bar closes above $0.07599, it will break the EMA 200 level and help DOGE gain momentum.
時間足チャートでDOGEに注目すべき主要な抵抗レベルは、0.07489ドル、0.07599ドル、0.07711ドルです。特に、バーが0.07599ドルを超えて終了すると、EMA 200レベルを突破し、DOGEの勢いを高めるのに役立ちます。

続きを読む: https://en.coin-turk.com/dogecoin-technical-analysis-key-levels-and-insights/


 crypto.ro English
 DogeHome
 Crypto News Land
 ETHNews
 CFN
CFN U_Today
 Thecoinrepublic.com
 Optimisus


