
The Bitcoin price remains within a defined trading range, whereas specific alternative cryptocurrencies recently experienced significant increases and are now witnessing investors booking profits.
Bitcoin has managed to maintain its gains for the year so far; however, it is facing a formidable challenge in surpassing its peak from 17 months ago, which stood at $44,700 and was reached earlier this month. This situation suggests that market participants are exercising caution and refraining from aggressive buying ahead of the decision regarding spot Bitcoin exchange-traded fund (ETF) applications expected in January.
The outcome of these ETF approvals remains uncertain, and predicting how traders will react is complex. If one or more spot Bitcoin ETFs receive approval, the market’s response is uncertain; it could lead to a “sell the news” scenario if there isn’t strong demand for the ETFs after approval. Conversely, a substantial influx of funds into the ETFs during the initial days could significantly increase Bitcoin’s price.
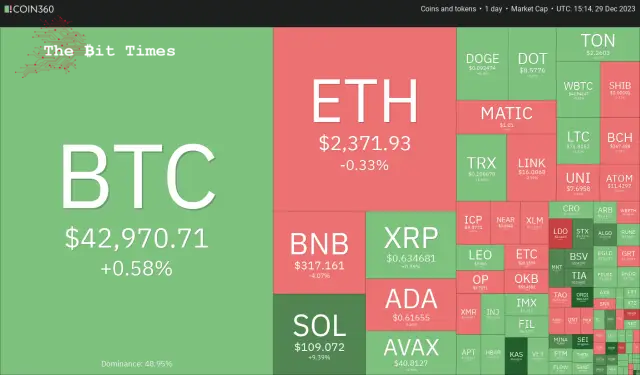
The uncertainty about Bitcoin’s short-term price action has boosted buying interest in altcoins. That is one of the reasons for the drop in Bitcoin’s dominance from about 55% to 51% in the past few days.
Will Bitcoin resume its uptrend or succumb to profit booking? Could altcoins continue their outperformance? Let’s analyse the charts of the top 10 cryptocurrencies to find out.
Bitcoin (BTC) price analysis
Bitcoin fell below the 20-day exponential moving average ($42,597) on Dec. 29 but continues to trade inside the ascending triangle pattern.
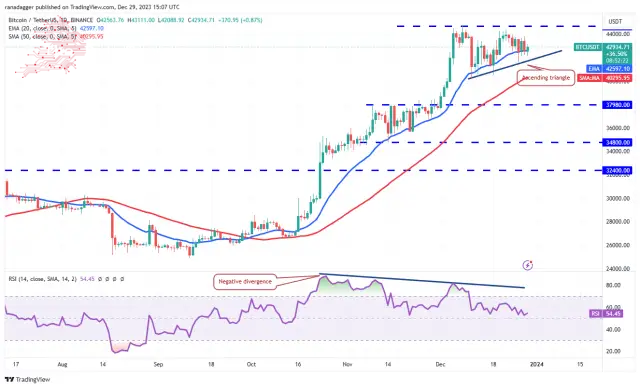
The relative strength index (RSI) has dropped near the midpoint, indicating that the bullish momentum is weakening. Buyers must push the price above $44,700 to complete the triangle and regain control. The BTC/USDT pair could rise to the pattern target of $49,178.
Contrary to this assumption, a break below the triangle will invalidate the bullish setup. That could accelerate selling and sink the pair to the 50-day simple moving average ($40,295). The bulls will try to stop the decline at this level, but if they fail, the next support level will likely be $37,980.
Ether (ETH) price analysis
Ether closed above the descending triangle pattern on Dec. 27 and tried to start the next leg of the uptrend on Dec. 28.
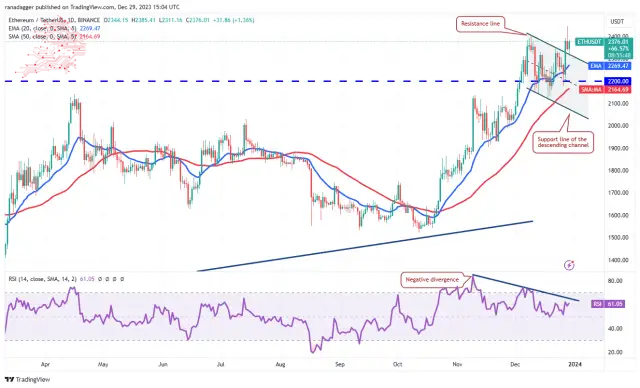
However, the bears were in no mood to give up. They sold at $2,445 and pulled the price back below $2,403. The price dropped to the breakout level from the channel where buyers stepped in. This indicates that the bulls are trying to flip the level into support.
If they do that, the ETH/USDT pair will try to resume the uptrend. The target objective on the upside is $3,000.
Meanwhile, the bears are likely to have other plans. They will try to yank the price below the 20-day EMA ($2,269) and start a decline to the channel’s support line near $2,000.
BNB price analysis
BNB nudged above its pattern target of $333 on Dec. 28 but could not sustain the higher levels. This suggests profit-taking by traders.
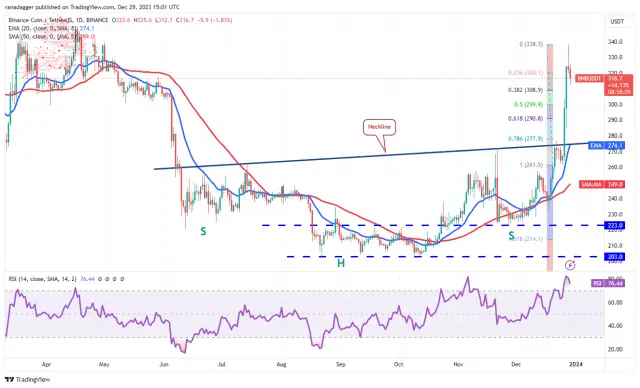
Now, the BNB/USDT pair could pull back to the 50% Fibonacci retracement level of $300, which will likely be a strong support. If the price rebounds off $300, the bulls will again try to push the price toward the formidable hurdle of $350.
On the other hand, if the $300 support cracks, the correction may extend to the 61.8% Fibonacci retracement level of $291 and then to the neckline. The bulls are expected to protect the neckline with vigour.
Solana (SOL) price analysis
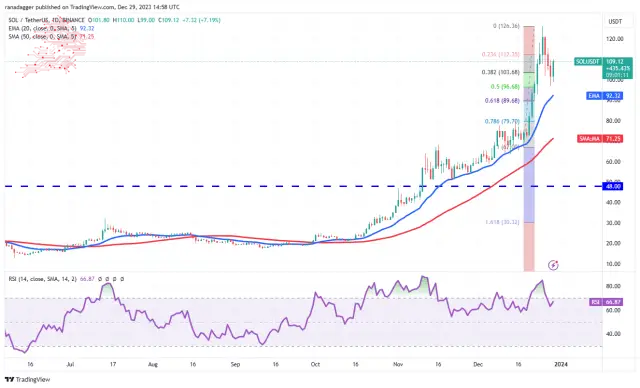
Both moving averages are sloping up, and the RSI is positive, indicating that bulls have the edge. The SOL/USDT pair could rise to the recent high of $126, where the bulls will likely face strong selling by the bears. If bulls overcome this barrier, the pair may jump to $156.
The bears will have to sink the price below the 20-day EMA ($92) to signal a potential trend change in the near term. The pair could then tumble to the 50-day SMA ($71).
XRP price analysis
XRP attempted a rally on Dec. 28, but the bulls could not clear the hurdle at the downtrend line.
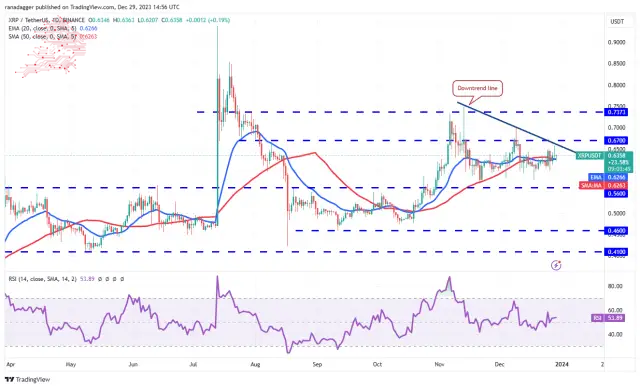
The price has been trading near the moving averages for the past few days, indicating indecision between the bulls and the bears. The flattish moving averages and the RSI near the midpoint suggest that the XRP/USDT pair may extend its stay inside the $0.56 to $0.67 range for some more time.
Buyers will have to drive the price above $0.67 to seize control. The pair could then rise to $0.74, which is likely to act as a strong resistance. The short-term trend will turn bearish if the price plummets below $0.56.
Cardano (ADA) price analysis
The bulls pushed Cardano above the symmetrical triangle pattern on Dec. 28 but could not sustain the higher levels seen from the long wick on the day’s candlestick.
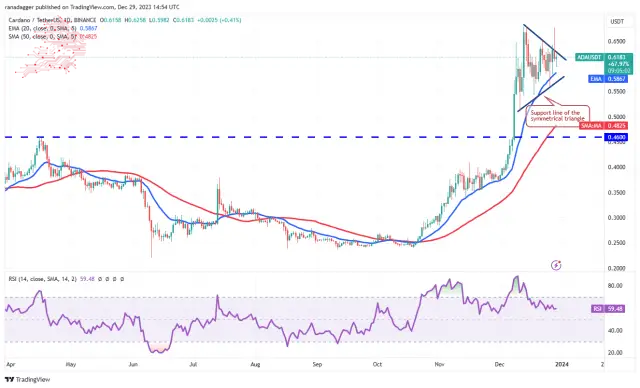
A minor advantage in favour of the bulls is that they have not allowed the price to break below the 20-day EMA. This suggests buying at lower levels. If the price rises above the triangle, the bulls will try to overcome the barrier again at $0.68. If they succeed, it will signal the resumption of the uptrend. The ADA/USDT pair may then climb to $0.80.
The triangle’s support line remains the crucial level for the bulls to defend because if this support gives way, the pair may move downward to $0.50 and, after that, to $0.46.
Avalanche (AVAX) price analysis
Avalanche’s correction has reached strong support at $38, a significant level to watch.
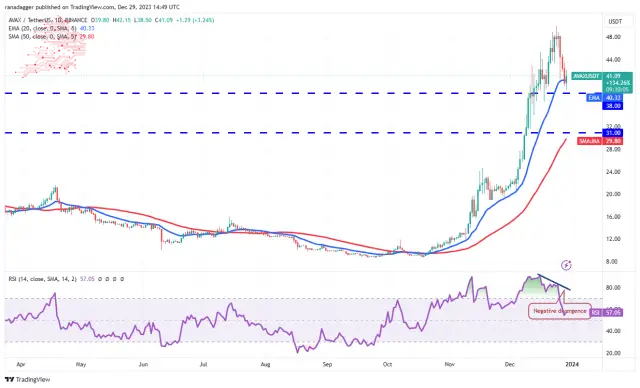
The bulls will try to defend the $38 support and start a relief rally. If that happens, the AVAX/USDT pair may stay rangebound between $38 and $50 for a while. The flattish 20-day EMA ($40) and the RSI above 57 also point to a possible consolidation in the near term with an upward bias.
This view will be invalidated if prices drop and skids below $38. That may attract further selling, sinking the pair to $34 and eventually to $31.
Dogecoin (DOGE) price analysis
Dogecoin has been trading near the 20-day EMA ($0.09) for the past few days, indicating a balance between supply and demand.
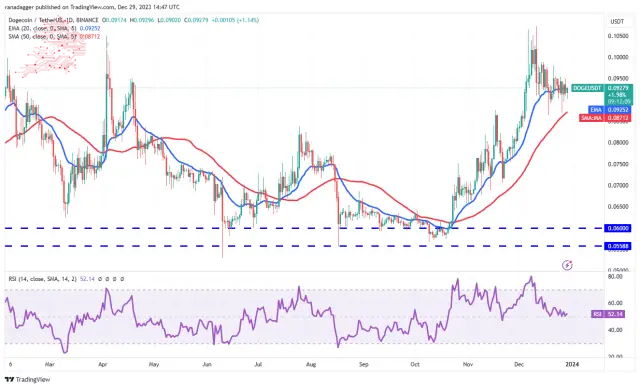
The flattish 20-day EMA and the RSI near the midpoint do not give a clear advantage either to the buyers or the sellers. In the near term, the price may remain stuck between the 50-day SMA ($0.09) and the $0.10 resistance.
The first sign of strength will be a break above $0.10, and the bullish momentum will likely pick up above $0.11. That opens up the possibility of a rally to $0.16. Contrarily, the bears will gain the upper hand if they sink the DOGE/USDT pair below the 50-day SMA. The pair may then slump to $0.07.
Polkadot (DOT) price analysis
Polkadot’s pullback is nearing the breakout of $7.90, a crucial level to watch out for in the near term.
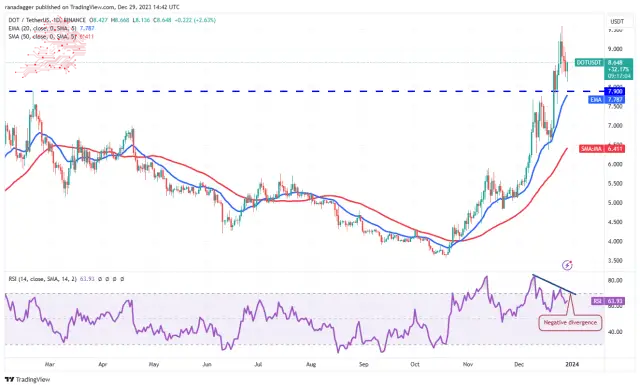
Although the upsloping moving averages indicate an advantage to buyers, the negative divergence on the RSI suggests that the bullish momentum could be slowing down. The breakout level of $7.90 will likely witness a tough battle between the bulls and the bears.
If the price rebounds off $7.90, the DOT/USDT pair will attempt a rally to $10, where the bears are expected to offer a stiff resistance. Alternatively, if the price slides below the 20-day EMA ($7.78), the correction could deepen to the 50-day SMA ($6.41).
Polygon (MATIC) price analysis
Polygon turned down from $1.09 on Dec. 27 and dipped below the breakout level of $1 on Dec. 29, indicating profit booking by the bulls.
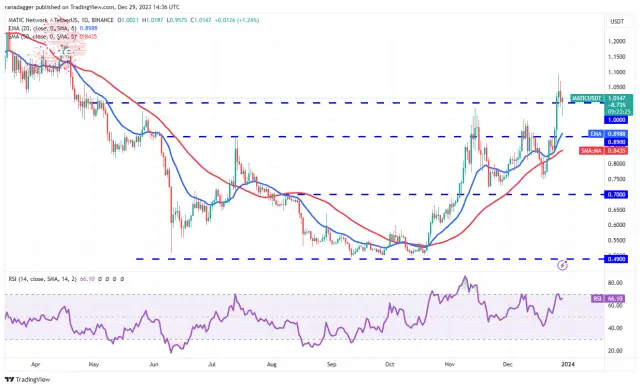
However, lower levels attracted strong buying by the bulls. Suppose the price is maintained above $1; the likelihood of a retest of $1.09 increases. The rising 20-day EMA ($0.89) and the RSI in the positive zone suggest that bulls are in command. If the $1.09 resistance is removed, the MATIC/USDT pair may rally to $1.20 and later to $1.50.
Instead, if the price slips and maintains below $1, the pair could drop to the 20-day EMA. The bears must sink the price below this support to signal a rangebound action between $0.70 and $1.
Source – Rakesh Upadhyay
Source: https://thebittimes.com/latest-market-overview-29th-dec-btc-eth-bnb-sol-xrp-ada-avax-doge-dot-matic-tbt75127.html


 Crypto Front News
 Crypto News Flash
 DogeHome
 Optimisus
 TheCoinrise Media
 Cryptopolitan_News
 Cryptopolitan_News
 Thecoinrepublic.com


