


The Bitcoin price remains within a defined trading range, whereas specific alternative cryptocurrencies recently experienced significant increases and are now witnessing investors booking profits.
ビットコインの価格は定められた取引範囲内にとどまっているが、特定の代替仮想通貨は最近大幅な上昇を経験し、投資家が利益を確定させているのを目の当たりにしている。
Bitcoin has managed to maintain its gains for the year so far; however, it is facing a formidable challenge in surpassing its peak from 17 months ago, which stood at $44,700 and was reached earlier this month. This situation suggests that market participants are exercising caution and refraining from aggressive buying ahead of the decision regarding spot Bitcoin exchange-traded fund (ETF) applications expected in January.
ビットコインはこれまでのところ、なんとか今年の上昇を維持している。しかし、今月初めに到達した17カ月前の最高値4万4700ドルを超えるには、手強い課題に直面している。この状況は、1月に予想されるスポットビットコイン上場投資信託(ETF)申請に関する決定を前に、市場参加者が警戒し、積極的な買いを控えていることを示唆している。
The outcome of these ETF approvals remains uncertain, and predicting how traders will react is complex. If one or more spot Bitcoin ETFs receive approval, the market’s response is uncertain; it could lead to a “sell the news” scenario if there isn’t strong demand for the ETFs after approval. Conversely, a substantial influx of funds into the ETFs during the initial days could significantly increase Bitcoin’s price.
これらのETF承認の結果は依然として不確実であり、トレーダーがどのように反応するかを予測することは複雑です。 1 つ以上のスポットビットコイン ETF が承認された場合、市場の反応は不確実です。承認後にETFに対する強い需要がなければ、「ニュースを売る」シナリオにつながる可能性がある。逆に、初期段階でETFに大量の資金が流入すると、ビットコインの価格が大幅に上昇する可能性があります。
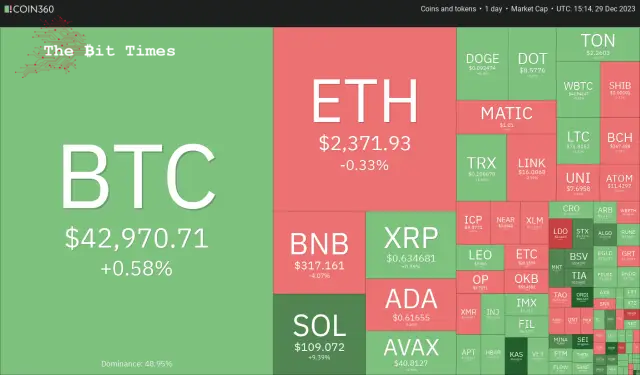
The uncertainty about Bitcoin’s short-term price action has boosted buying interest in altcoins. That is one of the reasons for the drop in Bitcoin’s dominance from about 55% to 51% in the past few days.
ビットコインの短期的な価格動向に対する不確実性により、アルトコインへの購入意欲が高まっています。これが、過去数日間でビットコインの優位性が約 55% から 51% に低下した理由の 1 つです。
Will Bitcoin resume its uptrend or succumb to profit booking? Could altcoins continue their outperformance? Let’s analyse the charts of the top 10 cryptocurrencies to find out.
ビットコインは上昇トレンドを再開するのか、それとも利益確定に屈するのか?アルトコインは今後もアウトパフォームを続ける可能性があるだろうか?それを知るために、トップ 10 の仮想通貨のチャートを分析してみましょう。
Bitcoin (BTC) price analysis
ビットコイン(BTC)価格分析
Bitcoin fell below the 20-day exponential moving average ($42,597) on Dec. 29 but continues to trade inside the ascending triangle pattern.
ビットコインは12月29日に20日間の指数移動平均(4万2597ドル)を下回ったが、引き続き上昇三角パターン内で取引されている。
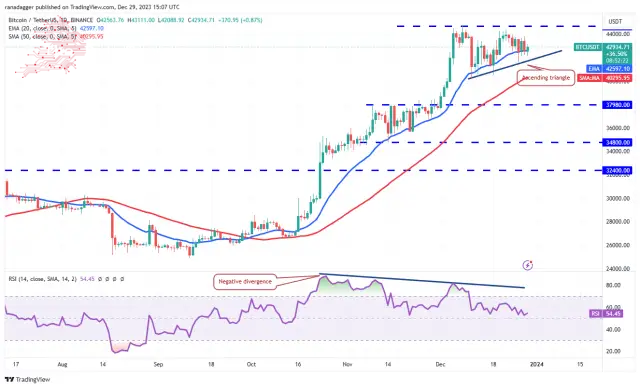
The relative strength index (RSI) has dropped near the midpoint, indicating that the bullish momentum is weakening. Buyers must push the price above $44,700 to complete the triangle and regain control. The BTC/USDT pair could rise to the pattern target of $49,178.
相対力指数(RSI)は中間点付近で低下しており、強気の勢いが弱まっていることを示している。買い手はトライアングルを完了して主導権を取り戻すために、価格を44,700ドル以上に押し上げる必要がある。 BTC/USDTペアはパターン目標の49,178ドルまで上昇する可能性がある。
Contrary to this assumption, a break below the triangle will invalidate the bullish setup. That could accelerate selling and sink the pair to the 50-day simple moving average ($40,295). The bulls will try to stop the decline at this level, but if they fail, the next support level will likely be $37,980.
この想定に反して、トライアングルを下抜けた場合、強気のセットアップは無効になります。そうなると売りが加速し、50日単純移動平均(4万295ドル)まで下落する可能性がある。強気派はこのレベルで下落を止めようとするだろうが、失敗した場合、次のサポートレベルは37,980ドルになる可能性が高い。
Ether (ETH) price analysis
イーサ(ETH)価格分析
Ether closed above the descending triangle pattern on Dec. 27 and tried to start the next leg of the uptrend on Dec. 28.
イーサは12月27日に下降三角パターンの上で終了し、12月28日に上昇トレンドの次のレッグを開始しようとしました。
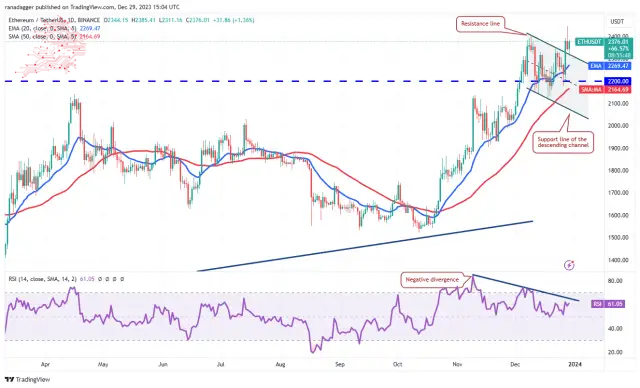
However, the bears were in no mood to give up. They sold at $2,445 and pulled the price back below $2,403. The price dropped to the breakout level from the channel where buyers stepped in. This indicates that the bulls are trying to flip the level into support.
しかし、クマたちは諦める気はありませんでした。彼らは2,445ドルで売却し、価格を2,403ドル以下に戻しました。価格は買い手が介入したチャネルからブレイクアウトレベルまで下落した。これは強気派がそのレベルをサポートに反転させようとしていることを示している。
If they do that, the ETH/USDT pair will try to resume the uptrend. The target objective on the upside is $3,000.
そうすれば、ETH/USDTペアは上昇トレンドを再開しようとするでしょう。上値目標は 3,000 ドルです。
Meanwhile, the bears are likely to have other plans. They will try to yank the price below the 20-day EMA ($2,269) and start a decline to the channel’s support line near $2,000.
一方、クマたちは別の計画を立てている可能性が高い。彼らは価格を20日間EMA(2,269ドル)以下に引き下げ、2,000ドル付近のチャネルのサポートラインまで下落を開始しようとします。
BNB price analysis
BNB価格分析
BNB nudged above its pattern target of $333 on Dec. 28 but could not sustain the higher levels. This suggests profit-taking by traders.
BNBは12月28日にパターン目標である333ドルをわずかに上回りましたが、より高いレベルを維持することはできませんでした。これはトレーダーによる利益確定の動きを示唆している。
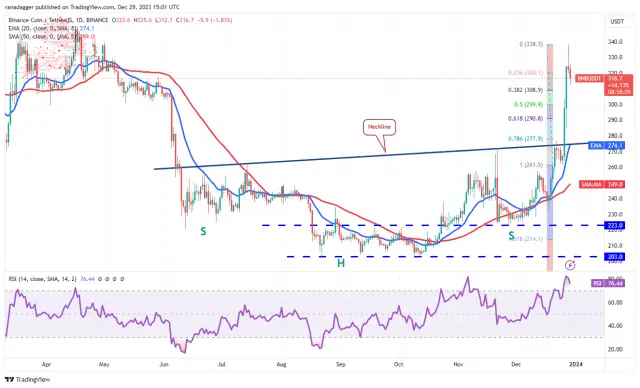
Now, the BNB/USDT pair could pull back to the 50% Fibonacci retracement level of $300, which will likely be a strong support. If the price rebounds off $300, the bulls will again try to push the price toward the formidable hurdle of $350.
現在、BNB/USDT ペアは 50% フィボナッチ リトレースメント レベルの 300 ドルまで戻る可能性があり、これが強力なサポートとなる可能性があります。価格が300ドルから反発した場合、強気派は再び価格を350ドルという恐ろしいハードルに向けて押し上げようとするだろう。
On the other hand, if the $300 support cracks, the correction may extend to the 61.8% Fibonacci retracement level of $291 and then to the neckline. The bulls are expected to protect the neckline with vigour.
一方、300ドルのサポートが割れた場合、調整は61.8%のフィボナッチ・リトレースメントレベルである291ドルにまで及び、その後ネックラインにまで及ぶ可能性がある。強気派はネックラインを精力的に守ることが期待される。
Solana (SOL) price analysis
ソラナ (SOL) 価格分析
ソラナは12月29日の50%フィボナッチ・リトレースメント水準である96ドルから上昇しており、センチメントが引き続きポジティブでトレーダーが押し目買いをしていることを示している。
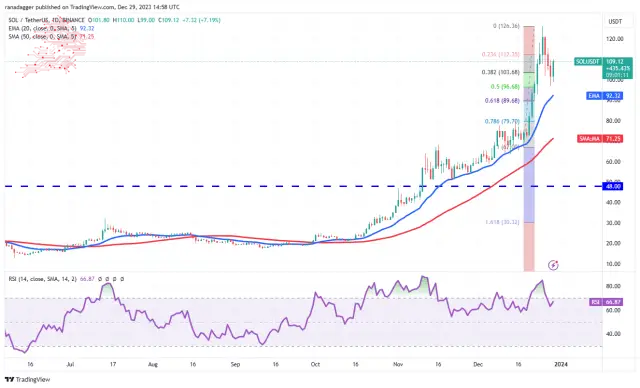
Both moving averages are sloping up, and the RSI is positive, indicating that bulls have the edge. The SOL/USDT pair could rise to the recent high of $126, where the bulls will likely face strong selling by the bears. If bulls overcome this barrier, the pair may jump to $156.
両方の移動平均は右肩上がりで、RSI はプラスであり、強気派が優位であることを示しています。 SOL/USDTペアは最近の高値である126ドルまで上昇する可能性があり、強気派は弱気派による強い売りに直面する可能性が高い。強気派がこの壁を乗り越えれば、ペアは156ドルまで跳ね上がる可能性がある。
The bears will have to sink the price below the 20-day EMA ($92) to signal a potential trend change in the near term. The pair could then tumble to the 50-day SMA ($71).
弱気派は短期的に潜在的なトレンド変化を示すために、価格を20日間EMA(92ドル)以下に下げる必要があるだろう。その後、ペアは50日間SMA(71ドル)まで下落する可能性がある。
XRP price analysis
XRP attempted a rally on Dec. 28, but the bulls could not clear the hurdle at the downtrend line.
XRP価格分析 XRPは12月28日に上昇を試みたが、強気派は下降トレンドラインのハードルを越えることができなかった。
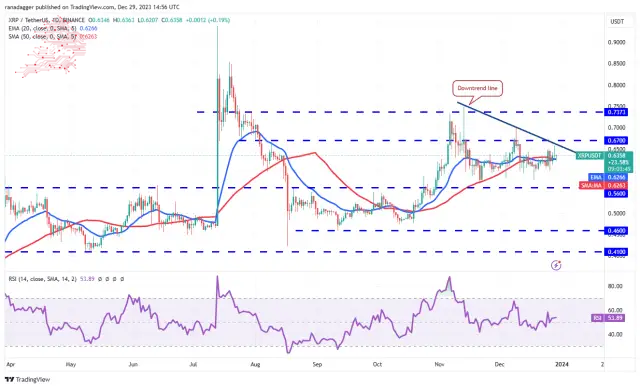
The price has been trading near the moving averages for the past few days, indicating indecision between the bulls and the bears. The flattish moving averages and the RSI near the midpoint suggest that the XRP/USDT pair may extend its stay inside the $0.56 to $0.67 range for some more time.
過去数日間、価格は移動平均線付近で推移しており、強気派と弱気派の間で優柔不断な姿勢が示されている。平坦な移動平均と中間点付近のRSIは、XRP/USDTペアがもう少しの間0.56ドルから0.67ドルの範囲内での滞在を延長する可能性があることを示唆しています。
Buyers will have to drive the price above $0.67 to seize control. The pair could then rise to $0.74, which is likely to act as a strong resistance. The short-term trend will turn bearish if the price plummets below $0.56.
買い手は主導権を握るために価格を0.67ドル以上に引き上げる必要がある。その後、ペアは0.74ドルまで上昇する可能性があり、これが強い抵抗線となる可能性が高い。価格が0.56ドルを下回ると短期トレンドは弱気になるだろう。
Cardano (ADA) price analysis
カルダノ (ADA) 価格分析
The bulls pushed Cardano above the symmetrical triangle pattern on Dec. 28 but could not sustain the higher levels seen from the long wick on the day’s candlestick.
強気派は12月28日にカルダノを対称的な三角形パターンの上に押し上げましたが、その日のローソク足の長い芯から見られるより高いレベルを維持することができませんでした。
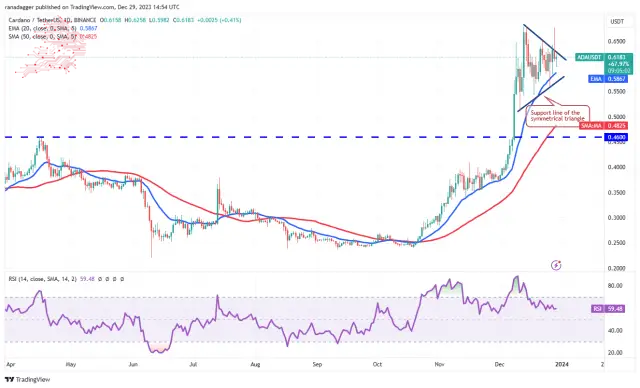
A minor advantage in favour of the bulls is that they have not allowed the price to break below the 20-day EMA. This suggests buying at lower levels. If the price rises above the triangle, the bulls will try to overcome the barrier again at $0.68. If they succeed, it will signal the resumption of the uptrend. The ADA/USDT pair may then climb to $0.80.
強気派に有利な小さな利点は、価格が20日間EMAを下回ることを許可していないことです。これは、より低いレベルでの購入を示唆しています。価格がトライアングルを超えて上昇すると、強気派は再び0.68ドルの壁を乗り越えようとするだろう。彼らが成功すれば、上昇トレンドの再開を示すことになる。その後、ADA/USDTペアは0.80ドルまで上昇する可能性がある。
The triangle’s support line remains the crucial level for the bulls to defend because if this support gives way, the pair may move downward to $0.50 and, after that, to $0.46.
トライアングルのサポートラインは依然として強気派が守るべき重要なレベルである。なぜなら、このサポートが崩れた場合、ペアは0.50ドルまで下落し、その後は0.46ドルまで下落する可能性があるからである。
Avalanche (AVAX) price analysis
アバランチ (AVAX) 価格分析
Avalanche’s correction has reached strong support at $38, a significant level to watch.
Avalancheの修正は38ドルの強力なサポートに達しており、注目すべき重要なレベルです。
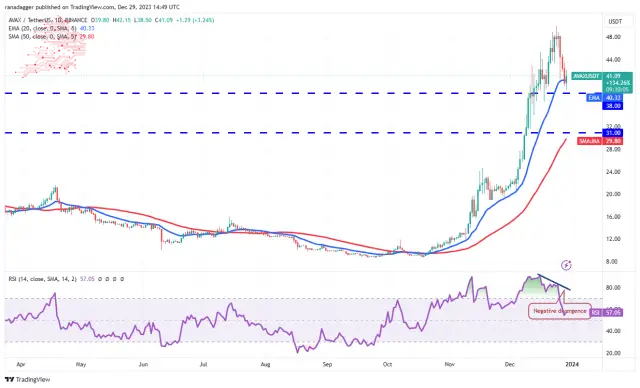
The bulls will try to defend the $38 support and start a relief rally. If that happens, the AVAX/USDT pair may stay rangebound between $38 and $50 for a while. The flattish 20-day EMA ($40) and the RSI above 57 also point to a possible consolidation in the near term with an upward bias.
強気派は38ドルのサポートを守り、救済ラリーを開始しようとするだろう。そうなれば、AVAX/USDTペアはしばらくの間、38ドルから50ドルの範囲内にとどまる可能性がある。 20 日間 EMA (40 ドル) が横ばいで、RSI が 57 を超えていることも、短期的には上向きのバイアスを伴う値固めの可能性を示しています。
This view will be invalidated if prices drop and skids below $38. That may attract further selling, sinking the pair to $34 and eventually to $31.
価格が下落し、38 ドルを下回った場合、このビューは無効になります。これによりさらなる売りが呼び込まれ、ペアは34ドル、最終的には31ドルまで下落する可能性がある。
Dogecoin (DOGE) price analysis
Dogecoin has been trading near the 20-day EMA ($0.09) for the past few days, indicating a balance between supply and demand.
ドージコイン(DOGE)の価格分析 ドージコインは過去数日間、20日間EMA(0.09ドル)付近で取引されており、需要と供給のバランスが取れていることを示しています。
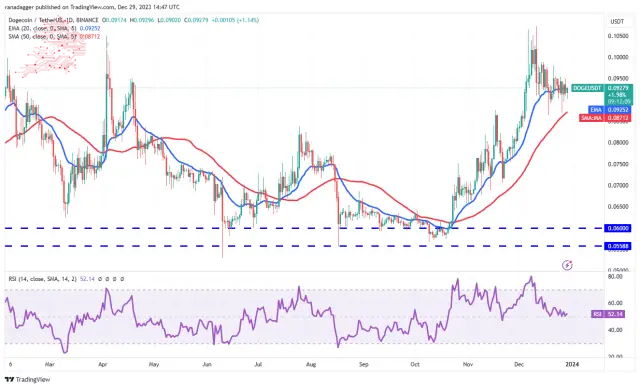
The flattish 20-day EMA and the RSI near the midpoint do not give a clear advantage either to the buyers or the sellers. In the near term, the price may remain stuck between the 50-day SMA ($0.09) and the $0.10 resistance.
平坦な 20 日間 EMA と中間点付近の RSI は、買い手と売り手のどちらにも明確な利点をもたらしません。短期的には、価格は50日SMA(0.09ドル)と0.10ドルの抵抗線の間にとどまる可能性がある。
The first sign of strength will be a break above $0.10, and the bullish momentum will likely pick up above $0.11. That opens up the possibility of a rally to $0.16. Contrarily, the bears will gain the upper hand if they sink the DOGE/USDT pair below the 50-day SMA. The pair may then slump to $0.07.
強さの最初の兆候は0.10ドルを超えることであり、強気の勢いは0.11ドルを超える可能性が高い。これにより、0.16ドルまで上昇する可能性が高まった。逆に、弱気派がDOGE/USDTペアを50日間SMAを下回れば、優位性を得るだろう。その後、ペアは0.07ドルまで下落する可能性がある。
Polkadot (DOT) price analysis
Polkadot’s pullback is nearing the breakout of $7.90, a crucial level to watch out for in the near term.
ポルカドット (DOT) の価格分析 ポルカドットの反落は 7.90 ドルのブレイクアウトに近づいており、短期的に注目すべき重要なレベルです。
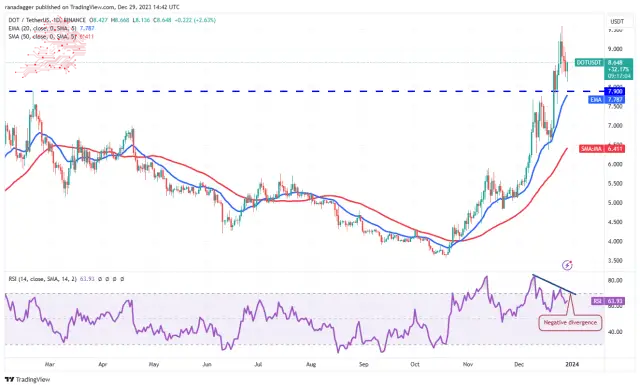
Although the upsloping moving averages indicate an advantage to buyers, the negative divergence on the RSI suggests that the bullish momentum could be slowing down. The breakout level of $7.90 will likely witness a tough battle between the bulls and the bears.
移動平均線の右肩上がりは買い手に有利であることを示していますが、RSIのマイナスの乖離は強気の勢いが鈍化しつつある可能性を示唆しています。 7.90ドルのブレイクアウトレベルでは、強気派と弱気派の間の厳しい戦いが見られるだろう。
If the price rebounds off $7.90, the DOT/USDT pair will attempt a rally to $10, where the bears are expected to offer a stiff resistance. Alternatively, if the price slides below the 20-day EMA ($7.78), the correction could deepen to the 50-day SMA ($6.41).
価格が7.90ドルから反発した場合、DOT/USDTペアは10ドルへの上昇を試みるだろうが、そこでは弱気派が激しい抵抗を示すことが予想される。あるいは、価格が20日間EMA(7.78ドル)を下回った場合、調整は50日間SMA(6.41ドル)まで深まる可能性があります。
Polygon (MATIC) price analysis
Polygon turned down from $1.09 on Dec. 27 and dipped below the breakout level of $1 on Dec. 29, indicating profit booking by the bulls.
ポリゴン (MATIC) の価格分析 ポリゴンは 12 月 27 日の 1.09 ドルから下落し、12 月 29 日にはブレイクアウトレベルの 1 ドルを下回りました。これは強気派による利益確保を示しています。
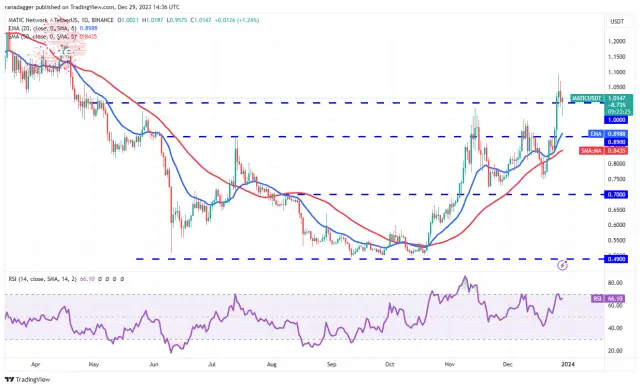
However, lower levels attracted strong buying by the bulls. Suppose the price is maintained above $1; the likelihood of a retest of $1.09 increases. The rising 20-day EMA ($0.89) and the RSI in the positive zone suggest that bulls are in command. If the $1.09 resistance is removed, the MATIC/USDT pair may rally to $1.20 and later to $1.50.
しかし、水準が低いと強気派による強い買いが集まった。価格が 1 ドルを超えて維持されているとします。 1.09ドルの再テストの可能性が高まります。 20日間EMA(0.89ドル)の上昇とRSIがプラス圏にあることは、強気派が主導権を握っていることを示唆している。 1.09ドルの抵抗線が取り除かれれば、MATIC/USDTペアは1.20ドルまで上昇し、その後は1.50ドルまで上昇する可能性がある。
Instead, if the price slips and maintains below $1, the pair could drop to the 20-day EMA. The bears must sink the price below this support to signal a rangebound action between $0.70 and $1.
むしろ、価格が下落して1ドル未満を維持した場合、ペアは20日間EMAまで下落する可能性があります。弱気派は、0.70ドルから1ドルの間のレンジ内での行動を示すために、価格をこのサポート以下に下げる必要がある。
Source – Rakesh Upadhyay
出典 – ラケシュ・ウパディヤイ
Source: https://thebittimes.com/latest-market-overview-29th-dec-btc-eth-bnb-sol-xrp-ada-avax-doge-dot-matic-tbt75127.html
出典: https://thebittimes.com/latest-market-overview-29th-dec-btc-eth-bnb-sol-xrp-ada-avax-doge-dot-matic-tbt75127.html
 DeFi Planet
 Crypto Daily™
 BlockchainReporter
 TheCoinrise Media
 DogeHome
 Crypto Daily™
 Crypto Daily™
 TheCoinrise Media


