


The Bitcoin price remains within a defined trading range, whereas specific alternative cryptocurrencies recently experienced significant increases and are now witnessing investors booking profits.
比特幣價格保持在規定的交易範圍內,而特定的替代加密貨幣最近經歷了顯著上漲,現在正在見證投資者獲利了結。
Bitcoin has managed to maintain its gains for the year so far; however, it is facing a formidable challenge in surpassing its peak from 17 months ago, which stood at $44,700 and was reached earlier this month. This situation suggests that market participants are exercising caution and refraining from aggressive buying ahead of the decision regarding spot Bitcoin exchange-traded fund (ETF) applications expected in January.
到目前為止,比特幣已成功維持今年的漲幅;然而,要超越 17 個月前的高峰(本月早些時候達到的 44,700 美元),它面臨著巨大的挑戰。這種情況表明,在 1 月關於現貨比特幣交易所交易基金 (ETF) 申請的決定之前,市場參與者正在保持謹慎態度,避免大舉買入。
The outcome of these ETF approvals remains uncertain, and predicting how traders will react is complex. If one or more spot Bitcoin ETFs receive approval, the market’s response is uncertain; it could lead to a “sell the news” scenario if there isn’t strong demand for the ETFs after approval. Conversely, a substantial influx of funds into the ETFs during the initial days could significantly increase Bitcoin’s price.
這些 ETF 的核准結果仍然不確定,預測交易者將如何反應也很複雜。如果一隻或多隻現貨比特幣 ETF 獲得批准,市場的反應是不確定的;如果批准後對 ETF 的需求不強烈,可能會導致「賣出訊息」的情況。相反,在最初幾天大量資金湧入 ETF 可能會顯著提高比特幣的價格。
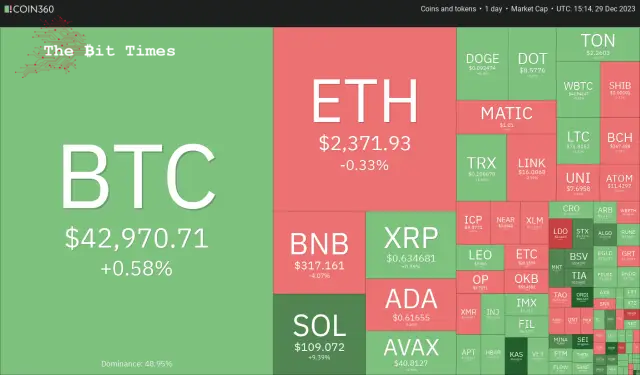
The uncertainty about Bitcoin’s short-term price action has boosted buying interest in altcoins. That is one of the reasons for the drop in Bitcoin’s dominance from about 55% to 51% in the past few days.
比特幣短期價格走勢的不確定性提高了對山寨幣的購買興趣。這是過去幾天比特幣的主導地位從 55% 左右下降到 51% 的原因之一。
Will Bitcoin resume its uptrend or succumb to profit booking? Could altcoins continue their outperformance? Let’s analyse the charts of the top 10 cryptocurrencies to find out.
比特幣會恢復上漲趨勢還是屈服於利潤預訂?山寨幣能否繼續保持優異表現?讓我們分析一下前 10 名加密貨幣的圖表來找出答案。
Bitcoin (BTC) price analysis
比特幣(BTC)價格分析
Bitcoin fell below the 20-day exponential moving average ($42,597) on Dec. 29 but continues to trade inside the ascending triangle pattern.
12 月 29 日,比特幣跌破 20 天指數移動平均線(42,597 美元),但繼續在上升三角形模式內交易。
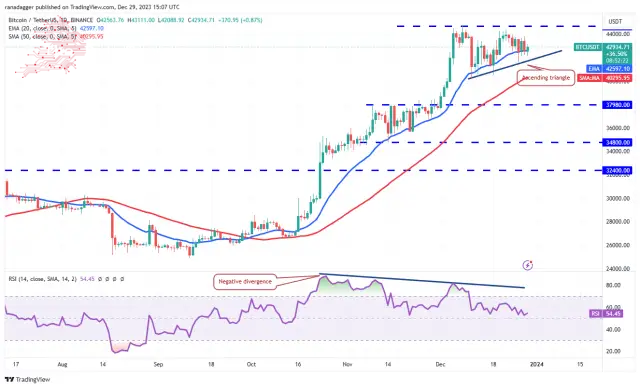
The relative strength index (RSI) has dropped near the midpoint, indicating that the bullish momentum is weakening. Buyers must push the price above $44,700 to complete the triangle and regain control. The BTC/USDT pair could rise to the pattern target of $49,178.
相對強弱指數(RSI)已跌至中點附近,顯示看漲勢頭正在減弱。買家必須將價格推高至 44,700 美元以上才能完成三角形並重新獲得控制權。 BTC/USDT 貨幣對可能會升至 49,178 美元的形態目標。
Contrary to this assumption, a break below the triangle will invalidate the bullish setup. That could accelerate selling and sink the pair to the 50-day simple moving average ($40,295). The bulls will try to stop the decline at this level, but if they fail, the next support level will likely be $37,980.
與此假設相反,跌破三角形將使看漲設定無效。這可能會加速拋售並使該貨幣對跌至 50 日簡單移動平均線(40,295 美元)。多頭將試圖在該水平上阻止跌勢,但如果失敗,下一個支撐位可能是 37,980 美元。
Ether (ETH) price analysis
以太幣(ETH)價格分析
Ether closed above the descending triangle pattern on Dec. 27 and tried to start the next leg of the uptrend on Dec. 28.
以太幣於 12 月 27 日收盤於下降三角形形態之上,並試圖在 12 月 28 日開始下一階段的上升趨勢。
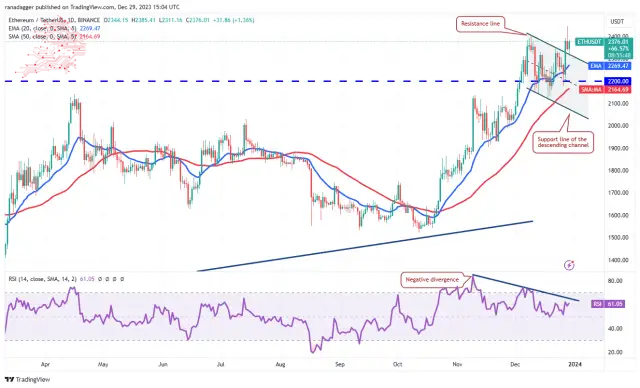
However, the bears were in no mood to give up. They sold at $2,445 and pulled the price back below $2,403. The price dropped to the breakout level from the channel where buyers stepped in. This indicates that the bulls are trying to flip the level into support.
然而,熊們並沒有放棄的心情。他們以 2,445 美元的價格出售,並將價格拉回至 2,403 美元以下。價格從買家介入的通道跌至突破水平。這表明多頭正試圖將該水平轉變為支撐位。
If they do that, the ETH/USDT pair will try to resume the uptrend. The target objective on the upside is $3,000.
如果他們這樣做,ETH/USDT 貨幣對將嘗試恢復上升趨勢。上行目標為 3,000 美元。
Meanwhile, the bears are likely to have other plans. They will try to yank the price below the 20-day EMA ($2,269) and start a decline to the channel’s support line near $2,000.
同時,空頭可能還有其他計劃。他們將嘗試將價格拉至 20 日均線(2,269 美元)以下,並開始下跌至通道支撐線 2,000 美元附近。
BNB price analysis
BNB價格分析
BNB nudged above its pattern target of $333 on Dec. 28 but could not sustain the higher levels. This suggests profit-taking by traders.
BNB 於 12 月 28 日微升至 333 美元的模式目標之上,但無法維持較高水準。這表示交易者獲利了結。
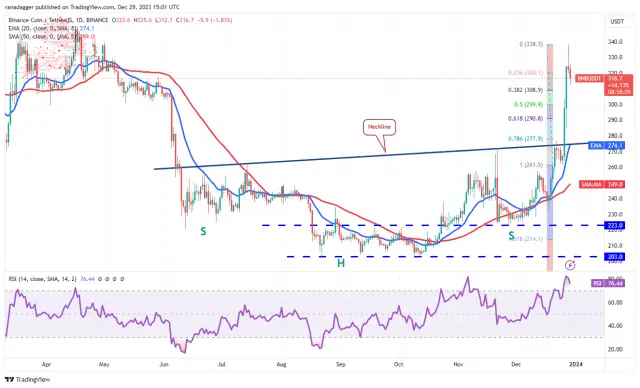
Now, the BNB/USDT pair could pull back to the 50% Fibonacci retracement level of $300, which will likely be a strong support. If the price rebounds off $300, the bulls will again try to push the price toward the formidable hurdle of $350.
現在,BNB/USDT 貨幣對可能會回調至 300 美元的 50% 斐波那契回撤位,這可能是一個強有力的支撐。如果價格從 300 美元反彈,多頭將再次試圖將價格推向 350 美元的巨大障礙。
On the other hand, if the $300 support cracks, the correction may extend to the 61.8% Fibonacci retracement level of $291 and then to the neckline. The bulls are expected to protect the neckline with vigour.
另一方面,如果 300 美元支撐位破裂,調整可能會延伸至 61.8% 斐波那契回檔位 291 美元,然後到達頸線。預計多頭將大力保護頸線。
Solana (SOL) price analysis
Solana (SOL) 價格分析
Solana 從 12 月 29 日的 50% 斐波那契回撤位 96 美元回升,顯示市場情緒依然樂觀,交易者逢低買進。
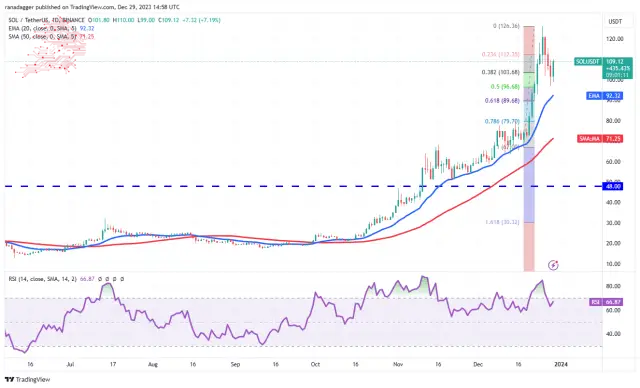
Both moving averages are sloping up, and the RSI is positive, indicating that bulls have the edge. The SOL/USDT pair could rise to the recent high of $126, where the bulls will likely face strong selling by the bears. If bulls overcome this barrier, the pair may jump to $156.
兩條均線均向上傾斜,RSI 為正,表示多頭佔優勢。 SOL/USDT 貨幣對可能會升至 126 美元的近期高點,多頭可能會面臨空頭的強勁拋售。如果多頭克服這一障礙,該貨幣對可能會躍升至 156 美元。
The bears will have to sink the price below the 20-day EMA ($92) to signal a potential trend change in the near term. The pair could then tumble to the 50-day SMA ($71).
空頭必須將價格壓低至 20 日均線(92 美元)下方,以表示近期趨勢可能會改變。隨後該貨幣對可能會跌至 50 日移動平均線(71 美元)。
XRP price analysis
XRP attempted a rally on Dec. 28, but the bulls could not clear the hurdle at the downtrend line.
XRP 價格分析 XRP 於 12 月 28 日嘗試反彈,但多頭未能清除下降趨勢線的障礙。
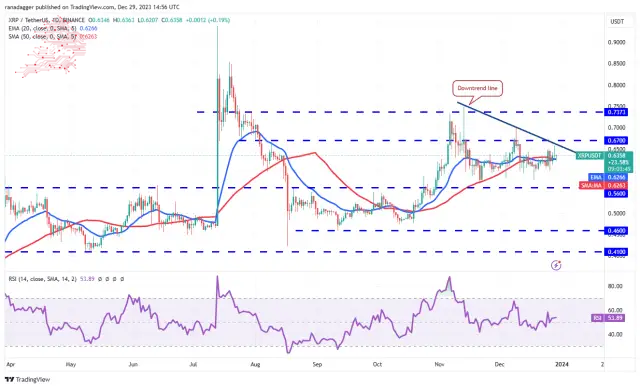
The price has been trading near the moving averages for the past few days, indicating indecision between the bulls and the bears. The flattish moving averages and the RSI near the midpoint suggest that the XRP/USDT pair may extend its stay inside the $0.56 to $0.67 range for some more time.
過去幾天價格一直在移動平均線附近交易,顯示多頭和空頭之間猶豫不決。平坦的移動平均線和接近中點的 RSI 表明 XRP/USDT 貨幣對可能會在 0.56 美元至 0.67 美元的區間內停留一段時間。
Buyers will have to drive the price above $0.67 to seize control. The pair could then rise to $0.74, which is likely to act as a strong resistance. The short-term trend will turn bearish if the price plummets below $0.56.
買家必須將價格推至 0.67 美元以上才能奪取控制權。該貨幣對隨後可能升至 0.74 美元,這可能會成為強勁阻力。如果價格跌破 0.56 美元,短期趨勢將轉為看跌。
Cardano (ADA) price analysis
卡爾達諾(ADA)價格分析
The bulls pushed Cardano above the symmetrical triangle pattern on Dec. 28 but could not sustain the higher levels seen from the long wick on the day’s candlestick.
12 月 28 日,多頭將卡爾達諾推升至對稱三角形上方,但未能維持當天燭台上長影線所示的較高水平。
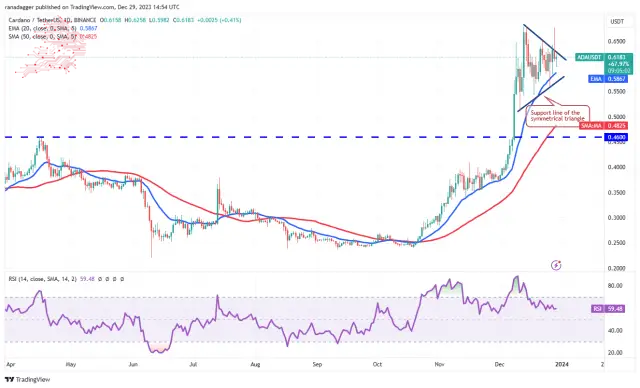
A minor advantage in favour of the bulls is that they have not allowed the price to break below the 20-day EMA. This suggests buying at lower levels. If the price rises above the triangle, the bulls will try to overcome the barrier again at $0.68. If they succeed, it will signal the resumption of the uptrend. The ADA/USDT pair may then climb to $0.80.
有利於多頭的一個小優勢是,他們不允許價格跌破 20 日均線。這表明在較低水平買入。如果價格升至三角形上方,多頭將嘗試再次突破 0.68 美元的障礙。如果他們成功,這將標誌著上升趨勢的恢復。 ADA/USDT 貨幣對可能會攀升至 0.80 美元。
The triangle’s support line remains the crucial level for the bulls to defend because if this support gives way, the pair may move downward to $0.50 and, after that, to $0.46.
三角形的支撐線仍然是多頭捍衛的關鍵水平,因為如果該支撐位失守,該貨幣對可能會下跌至 0.50 美元,然後跌至 0.46 美元。
Avalanche (AVAX) price analysis
雪崩 (AVAX) 價格分析
Avalanche’s correction has reached strong support at $38, a significant level to watch.
Avalanche 的修正已達到 38 美元的強勁支撐位,這是一個值得關注的重要水平。
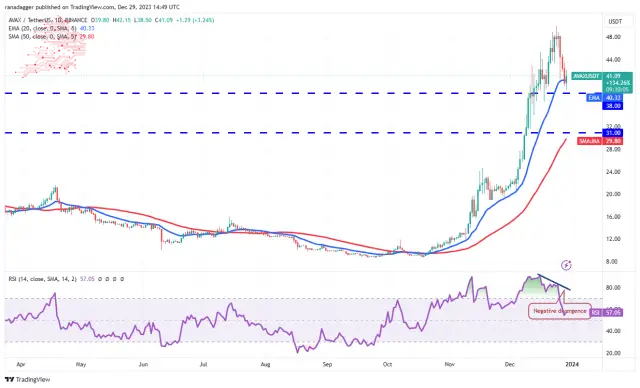
The bulls will try to defend the $38 support and start a relief rally. If that happens, the AVAX/USDT pair may stay rangebound between $38 and $50 for a while. The flattish 20-day EMA ($40) and the RSI above 57 also point to a possible consolidation in the near term with an upward bias.
多頭將努力捍衛 38 美元的支撐位並開始緩解反彈。如果發生這種情況,AVAX/USDT 貨幣對可能會在一段時間內保持在 38 美元至 50 美元之間的區間波動。持平的 20 日均線(40 美元)和 RSI 高於 57 也顯示近期可能出現盤整,且有上行傾向。
This view will be invalidated if prices drop and skids below $38. That may attract further selling, sinking the pair to $34 and eventually to $31.
如果價格下跌並跌破 38 美元,此觀點將失效。這可能會吸引進一步的拋售,使該貨幣對跌至 34 美元,最終跌至 31 美元。
Dogecoin (DOGE) price analysis
Dogecoin has been trading near the 20-day EMA ($0.09) for the past few days, indicating a balance between supply and demand.
狗狗幣 (DOGE) 價格分析 過去幾天狗狗幣一直在 20 日均線(0.09 美元)附近交易,表明供需平衡。
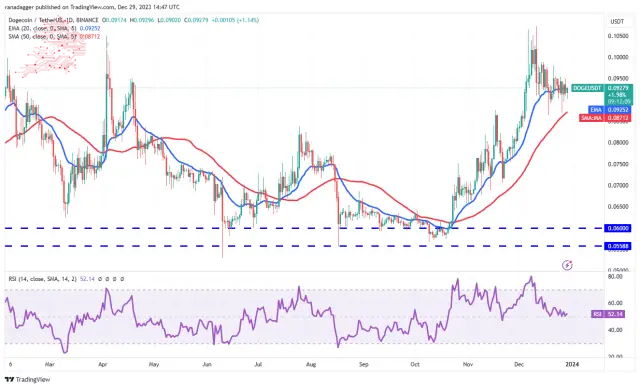
The flattish 20-day EMA and the RSI near the midpoint do not give a clear advantage either to the buyers or the sellers. In the near term, the price may remain stuck between the 50-day SMA ($0.09) and the $0.10 resistance.
持平的 20 日均線和中點附近的 RSI 並沒有為買家或賣家帶來明顯的優勢。短期內,價格可能仍停留在 50 日移動平均線(0.09 美元)和 0.10 美元阻力位之間。
The first sign of strength will be a break above $0.10, and the bullish momentum will likely pick up above $0.11. That opens up the possibility of a rally to $0.16. Contrarily, the bears will gain the upper hand if they sink the DOGE/USDT pair below the 50-day SMA. The pair may then slump to $0.07.
強勢的第一個跡象將是突破 0.10 美元,看漲勢頭可能會升至 0.11 美元上方。這開啟了反彈至 0.16 美元的可能性。相反,如果 DOGE/USDT 貨幣對跌破 50 日移動平均線,空頭將佔上風。隨後該貨幣對可能會跌至 0.07 美元。
Polkadot (DOT) price analysis
Polkadot’s pullback is nearing the breakout of $7.90, a crucial level to watch out for in the near term.
Polkadot (DOT) 價格分析 Polkadot 的回檔已接近突破 7.90 美元,這是近期值得關注的關鍵水平。
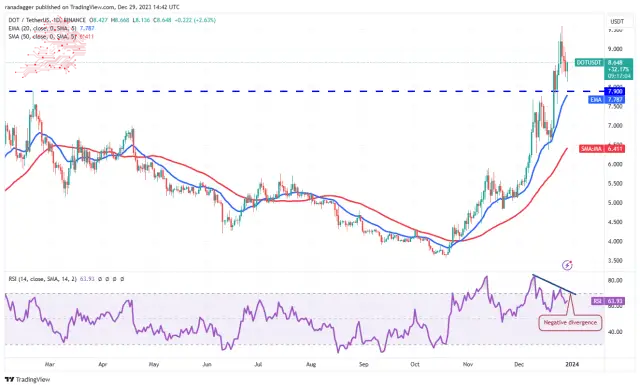
Although the upsloping moving averages indicate an advantage to buyers, the negative divergence on the RSI suggests that the bullish momentum could be slowing down. The breakout level of $7.90 will likely witness a tough battle between the bulls and the bears.
儘管向上傾斜的移動平均線表明買家有優勢,但 RSI 的負背離表明看漲勢頭可能正在放緩。突破 7.90 美元水平可能會見證多頭和空頭之間的一場硬仗。
If the price rebounds off $7.90, the DOT/USDT pair will attempt a rally to $10, where the bears are expected to offer a stiff resistance. Alternatively, if the price slides below the 20-day EMA ($7.78), the correction could deepen to the 50-day SMA ($6.41).
如果價格從 7.90 美元反彈,DOT/USDT 貨幣對將嘗試反彈至 10 美元,預計空頭將在該位置提供強勁阻力。或者,如果價格跌破 20 日均線(7.78 美元),調整可能會深化至 50 日均線(6.41 美元)。
Polygon (MATIC) price analysis
Polygon turned down from $1.09 on Dec. 27 and dipped below the breakout level of $1 on Dec. 29, indicating profit booking by the bulls.
Polygon (MATIC) 價格分析 Polygon 從 12 月 27 日的 1.09 美元下跌,並於 12 月 29 日跌破 1 美元的突破水平,表明多頭獲利了結。
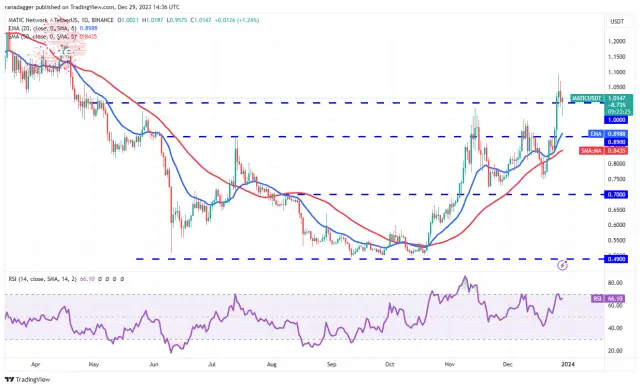
However, lower levels attracted strong buying by the bulls. Suppose the price is maintained above $1; the likelihood of a retest of $1.09 increases. The rising 20-day EMA ($0.89) and the RSI in the positive zone suggest that bulls are in command. If the $1.09 resistance is removed, the MATIC/USDT pair may rally to $1.20 and later to $1.50.
然而,較低的水平吸引了多頭的強勁買盤。假設價格維持在 1 美元以上;重新測試 1.09 美元的可能性增加。不斷上漲的 20 日均線(0.89 美元)和 RSI 處於正值區域表明多頭處於主導地位。如果 1.09 美元的阻力被移除,MATIC/USDT 貨幣對可能會反彈至 1.20 美元,隨後升至 1.50 美元。
Instead, if the price slips and maintains below $1, the pair could drop to the 20-day EMA. The bears must sink the price below this support to signal a rangebound action between $0.70 and $1.
相反,如果價格下滑並維持在 1 美元以下,該貨幣對可能會跌至 20 日均線。空頭必須將價格壓低至該支撐位下方,以發出 0.70 美元至 1 美元之間的區間波動訊號。
Source – Rakesh Upadhyay
來源——Rakesh Upadhyay
Source: https://thebittimes.com/latest-market-overview-29th-dec-btc-eth-bnb-sol-xrp-ada-avax-doge-dot-matic-tbt75127.html
資料來源:https://thebittimes.com/latest-market-overview-29th-dec-btc-eth-bnb-sol-xrp-ada-avax-doge-dot-matic-tbt75127.html
 DeFi Planet
 Crypto Daily™
 BlockchainReporter
 TheCoinrise Media
 DogeHome
 Crypto Daily™
 Crypto Daily™
 TheCoinrise Media


