


The Bitcoin price remains within a defined trading range, whereas specific alternative cryptocurrencies recently experienced significant increases and are now witnessing investors booking profits.
비트코인 가격은 정의된 거래 범위 내에 유지되는 반면, 특정 대체 암호화폐는 최근 상당한 상승을 경험했으며 이제 투자자들이 이익을 예약하는 것을 목격하고 있습니다.
Bitcoin has managed to maintain its gains for the year so far; however, it is facing a formidable challenge in surpassing its peak from 17 months ago, which stood at $44,700 and was reached earlier this month. This situation suggests that market participants are exercising caution and refraining from aggressive buying ahead of the decision regarding spot Bitcoin exchange-traded fund (ETF) applications expected in January.
비트코인은 지금까지 올해 상승세를 유지했습니다. 그러나 이달 초 도달한 44,700달러로 17개월 전 최고치를 넘어서는 만만찮은 도전에 직면해 있다. 이는 1월로 예상되는 비트코인 현물 ETF(상장지수펀드) 신청 결정을 앞두고 시장 참여자들이 주의를 기울이고 공격적인 매수를 자제하고 있음을 시사한다.
The outcome of these ETF approvals remains uncertain, and predicting how traders will react is complex. If one or more spot Bitcoin ETFs receive approval, the market’s response is uncertain; it could lead to a “sell the news” scenario if there isn’t strong demand for the ETFs after approval. Conversely, a substantial influx of funds into the ETFs during the initial days could significantly increase Bitcoin’s price.
이러한 ETF 승인의 결과는 여전히 불확실하며 거래자가 어떻게 반응할지 예측하는 것은 복잡합니다. 하나 이상의 현물 비트코인 ETF가 승인을 받으면 시장의 반응은 불확실합니다. 승인 후 ETF에 대한 수요가 높지 않으면 "뉴스 판매" 시나리오로 이어질 수 있습니다. 반대로, 초기에 ETF에 상당한 자금이 유입되면 비트코인 가격이 크게 상승할 수 있습니다.
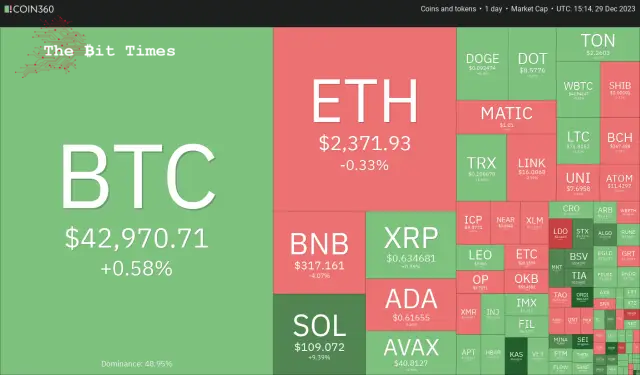
The uncertainty about Bitcoin’s short-term price action has boosted buying interest in altcoins. That is one of the reasons for the drop in Bitcoin’s dominance from about 55% to 51% in the past few days.
비트코인의 단기 가격 조치에 대한 불확실성으로 인해 알트코인에 대한 구매 관심이 높아졌습니다. 이것이 지난 며칠 동안 비트코인의 지배력이 약 55%에서 51%로 하락한 이유 중 하나입니다.
Will Bitcoin resume its uptrend or succumb to profit booking? Could altcoins continue their outperformance? Let’s analyse the charts of the top 10 cryptocurrencies to find out.
비트코인이 상승세를 재개할 것인가, 아니면 이익 예약에 굴복할 것인가? 알트코인이 계속해서 뛰어난 성과를 낼 수 있을까요? 알아보기 위해 상위 10개 암호화폐의 차트를 분석해 보겠습니다.
Bitcoin (BTC) price analysis
비트코인(BTC) 가격 분석
Bitcoin fell below the 20-day exponential moving average ($42,597) on Dec. 29 but continues to trade inside the ascending triangle pattern.
비트코인은 12월 29일 20일 지수 이동 평균($42,597) 아래로 떨어졌지만 계속해서 상승 삼각형 패턴 내에서 거래되고 있습니다.
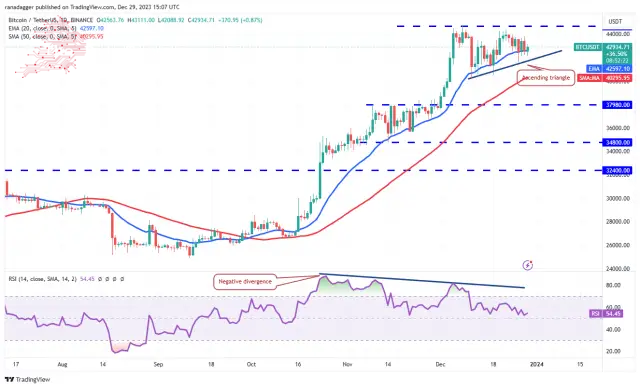
The relative strength index (RSI) has dropped near the midpoint, indicating that the bullish momentum is weakening. Buyers must push the price above $44,700 to complete the triangle and regain control. The BTC/USDT pair could rise to the pattern target of $49,178.
상대강도지수(RSI)가 중반 부근까지 하락해 강세 모멘텀이 약화되고 있음을 시사한다. 구매자는 삼각형을 완성하고 통제력을 회복하기 위해 가격을 $44,700 이상으로 올려야 합니다. BTC/USDT 쌍은 $49,178의 패턴 목표까지 상승할 수 있습니다.
Contrary to this assumption, a break below the triangle will invalidate the bullish setup. That could accelerate selling and sink the pair to the 50-day simple moving average ($40,295). The bulls will try to stop the decline at this level, but if they fail, the next support level will likely be $37,980.
이 가정과 반대로 삼각형 아래로 돌파하면 강세 설정이 무효화됩니다. 이는 매도를 가속화하고 50일 단순 이동 평균($40,295)으로 하락할 수 있습니다. 강세론자들은 이 수준에서 하락을 막으려고 노력할 것이지만, 실패할 경우 다음 지지 수준은 $37,980가 될 가능성이 높습니다.
Ether (ETH) price analysis
이더(ETH) 가격 분석
Ether closed above the descending triangle pattern on Dec. 27 and tried to start the next leg of the uptrend on Dec. 28.
Ether는 12월 27일 하락 삼각형 패턴 위에서 마감했으며 12월 28일 상승 추세의 다음 구간을 시작하려고 시도했습니다.
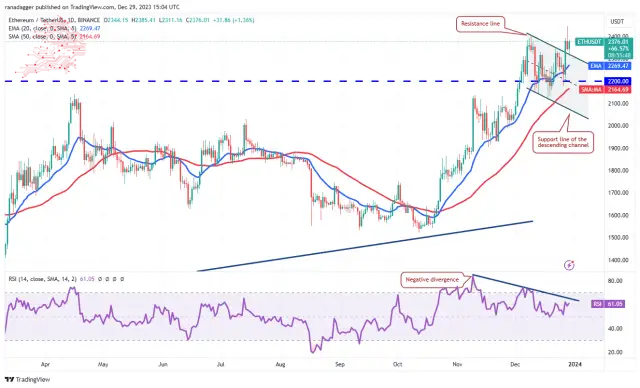
However, the bears were in no mood to give up. They sold at $2,445 and pulled the price back below $2,403. The price dropped to the breakout level from the channel where buyers stepped in. This indicates that the bulls are trying to flip the level into support.
그러나 곰들은 포기할 기분이 아니었습니다. 그들은 $2,445에 팔렸고 가격은 $2,403 아래로 떨어졌습니다. 가격은 구매자가 들어온 채널에서 돌파 수준으로 떨어졌습니다. 이는 황소가 수준을 지지 수준으로 바꾸려고 함을 나타냅니다.
If they do that, the ETH/USDT pair will try to resume the uptrend. The target objective on the upside is $3,000.
그렇게 하면 ETH/USDT 쌍은 상승 추세를 재개하려고 시도할 것입니다. 위쪽의 목표 목표는 $3,000입니다.
Meanwhile, the bears are likely to have other plans. They will try to yank the price below the 20-day EMA ($2,269) and start a decline to the channel’s support line near $2,000.
한편, 곰들은 다른 계획을 가지고 있을 가능성이 높습니다. 그들은 가격을 20일 EMA($2,269) 아래로 끌어내리고 $2,000 근처의 채널 지지선으로 하락을 시작할 것입니다.
BNB price analysis
BNB 가격 분석
BNB nudged above its pattern target of $333 on Dec. 28 but could not sustain the higher levels. This suggests profit-taking by traders.
BNB는 12월 28일에 패턴 목표인 333달러를 넘어섰지만 더 높은 수준을 유지하지 못했습니다. 이는 거래자가 이익을 얻는 것을 의미합니다.
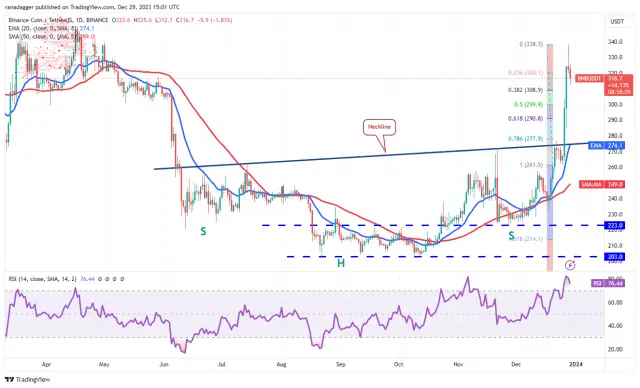
Now, the BNB/USDT pair could pull back to the 50% Fibonacci retracement level of $300, which will likely be a strong support. If the price rebounds off $300, the bulls will again try to push the price toward the formidable hurdle of $350.
이제 BNB/USDT 쌍은 50% 피보나치 되돌림 수준인 300달러로 후퇴할 수 있으며 이는 강력한 지지가 될 것입니다. 가격이 300달러에서 반등하면 강세론자들은 다시 가격을 350달러라는 엄청난 장애물을 향해 밀어붙이려고 할 것입니다.
On the other hand, if the $300 support cracks, the correction may extend to the 61.8% Fibonacci retracement level of $291 and then to the neckline. The bulls are expected to protect the neckline with vigour.
반면, $300 지지선이 무너지면 조정 범위는 $291의 61.8% 피보나치 되돌림 수준까지 확장된 다음 네크라인까지 확장될 수 있습니다. 황소는 활기차게 네크라인을 보호할 것으로 예상됩니다.
Solana (SOL) price analysis
솔라나(SOL) 가격 분석
솔라나는 12월 29일 50% 피보나치 되돌림 수준인 $96에서 상승했는데, 이는 정서가 여전히 긍정적이고 거래자들이 하락세에 매수하고 있음을 나타냅니다.
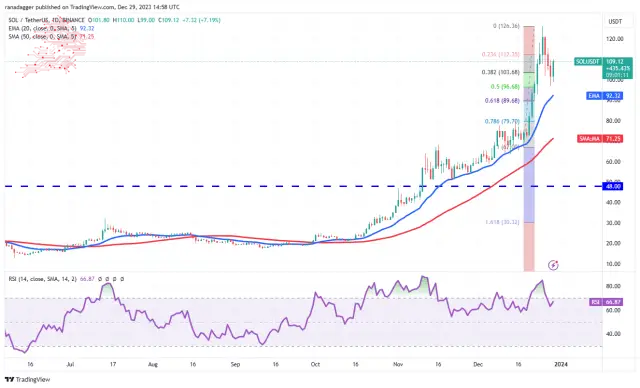
Both moving averages are sloping up, and the RSI is positive, indicating that bulls have the edge. The SOL/USDT pair could rise to the recent high of $126, where the bulls will likely face strong selling by the bears. If bulls overcome this barrier, the pair may jump to $156.
두 이동 평균은 모두 상승하고 RSI는 양수이므로 강세가 우위에 있음을 나타냅니다. SOL/USDT 쌍은 최근 최고치인 126달러까지 상승할 수 있으며, 이때 강세는 약세의 강력한 매도에 직면할 가능성이 높습니다. 황소가 이 장벽을 극복하면 쌍은 156달러까지 뛰어오를 수 있습니다.
The bears will have to sink the price below the 20-day EMA ($92) to signal a potential trend change in the near term. The pair could then tumble to the 50-day SMA ($71).
하락세는 단기적으로 잠재적인 추세 변화를 알리기 위해 가격을 20일 EMA(92달러) 아래로 내려야 합니다. 그러면 해당 쌍은 50일 SMA($71)까지 하락할 수 있습니다.
XRP price analysis
XRP attempted a rally on Dec. 28, but the bulls could not clear the hurdle at the downtrend line.
XRP 가격 분석 XRP는 12월 28일 랠리를 시도했지만 상승세는 하락 추세선의 장애물을 극복하지 못했습니다.
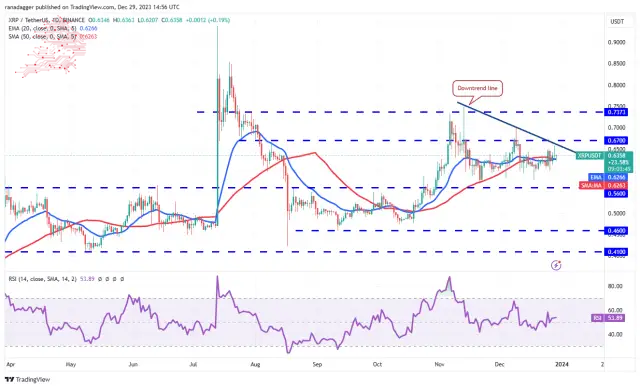
The price has been trading near the moving averages for the past few days, indicating indecision between the bulls and the bears. The flattish moving averages and the RSI near the midpoint suggest that the XRP/USDT pair may extend its stay inside the $0.56 to $0.67 range for some more time.
가격은 지난 며칠 동안 이동 평균 근처에서 거래되어 강세와 약세 사이의 우유부단함을 나타냅니다. 평평한 이동 평균과 중간 지점 근처의 RSI는 XRP/USDT 쌍이 한동안 0.56~0.67달러 범위 내에서 유지될 수 있음을 시사합니다.
Buyers will have to drive the price above $0.67 to seize control. The pair could then rise to $0.74, which is likely to act as a strong resistance. The short-term trend will turn bearish if the price plummets below $0.56.
구매자는 통제권을 장악하기 위해 가격을 $0.67 이상으로 끌어 올려야 합니다. 그러면 통화쌍은 $0.74까지 상승할 수 있으며 이는 강력한 저항으로 작용할 가능성이 높습니다. 가격이 $0.56 아래로 떨어지면 단기 추세는 약세로 바뀔 것입니다.
Cardano (ADA) price analysis
카르다노(ADA) 가격 분석
The bulls pushed Cardano above the symmetrical triangle pattern on Dec. 28 but could not sustain the higher levels seen from the long wick on the day’s candlestick.
강세장은 12월 28일에 Cardano를 대칭 삼각형 패턴 위로 밀었지만 당일 캔들스틱의 긴 심지에서 볼 수 있는 더 높은 수준을 유지하지 못했습니다.
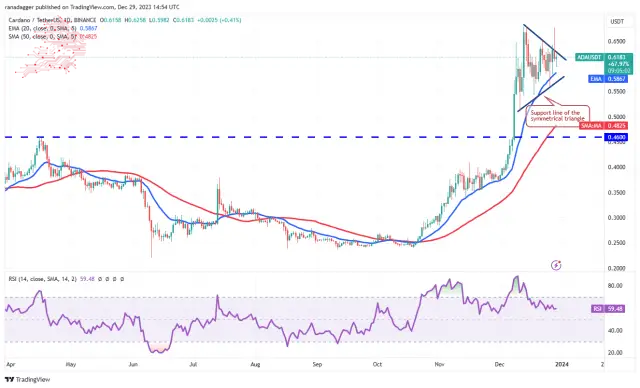
A minor advantage in favour of the bulls is that they have not allowed the price to break below the 20-day EMA. This suggests buying at lower levels. If the price rises above the triangle, the bulls will try to overcome the barrier again at $0.68. If they succeed, it will signal the resumption of the uptrend. The ADA/USDT pair may then climb to $0.80.
황소에게 유리한 작은 이점은 가격이 20일 EMA 아래로 떨어지는 것을 허용하지 않는다는 것입니다. 이는 낮은 수준에서 구매하는 것을 의미합니다. 가격이 삼각형 위로 상승하면 황소는 0.68달러의 장벽을 다시 극복하려고 시도할 것입니다. 성공하면 상승 추세의 재개를 알리는 신호입니다. 그러면 ADA/USDT 쌍은 $0.80까지 오를 수 있습니다.
The triangle’s support line remains the crucial level for the bulls to defend because if this support gives way, the pair may move downward to $0.50 and, after that, to $0.46.
삼각형의 지지선은 황소가 방어해야 하는 중요한 수준으로 남아 있습니다. 왜냐하면 이 지지선이 무너지면 쌍이 $0.50까지 하락한 후 $0.46까지 하락할 수 있기 때문입니다.
Avalanche (AVAX) price analysis
Avalanche(AVAX) 가격 분석
Avalanche’s correction has reached strong support at $38, a significant level to watch.
Avalanche의 수정은 주목할 만한 상당한 수준인 38달러로 강력한 지지를 받았습니다.
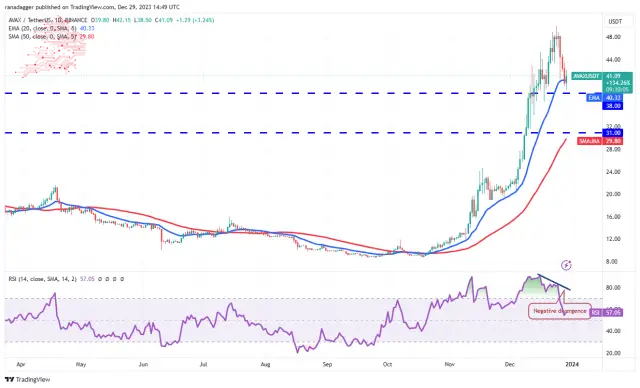
The bulls will try to defend the $38 support and start a relief rally. If that happens, the AVAX/USDT pair may stay rangebound between $38 and $50 for a while. The flattish 20-day EMA ($40) and the RSI above 57 also point to a possible consolidation in the near term with an upward bias.
강세론자들은 38달러 지지를 방어하고 안도 랠리를 시작하려고 노력할 것입니다. 그런 일이 발생하면 AVAX/USDT 쌍은 한동안 $38에서 $50 사이의 범위에 머물 수 있습니다. 평탄한 20일 EMA(40달러)와 57을 넘는 RSI도 단기적으로 상승 편향으로 통합이 가능함을 나타냅니다.
This view will be invalidated if prices drop and skids below $38. That may attract further selling, sinking the pair to $34 and eventually to $31.
가격이 하락하고 $38 이하로 하락하면 이 보기는 무효화됩니다. 이는 추가 매도를 유도하여 가격을 34달러, 결국 31달러까지 하락시킬 수 있습니다.
Dogecoin (DOGE) price analysis
Dogecoin has been trading near the 20-day EMA ($0.09) for the past few days, indicating a balance between supply and demand.
Dogecoin(DOGE) 가격 분석 Dogecoin은 지난 며칠 동안 20일 EMA(0.09달러) 근처에서 거래되어 수요와 공급의 균형을 나타냅니다.
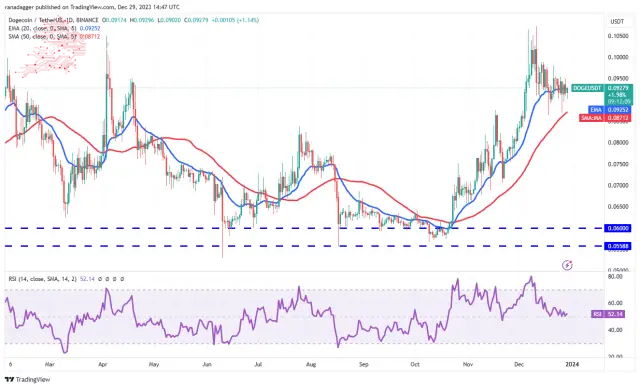
The flattish 20-day EMA and the RSI near the midpoint do not give a clear advantage either to the buyers or the sellers. In the near term, the price may remain stuck between the 50-day SMA ($0.09) and the $0.10 resistance.
평탄한 20일 EMA와 중간 지점 부근의 RSI는 매수자나 매도자 모두에게 뚜렷한 이점을 주지 않습니다. 단기적으로 가격은 50일 SMA($0.09)와 $0.10 저항선 사이에 머물 수 있습니다.
The first sign of strength will be a break above $0.10, and the bullish momentum will likely pick up above $0.11. That opens up the possibility of a rally to $0.16. Contrarily, the bears will gain the upper hand if they sink the DOGE/USDT pair below the 50-day SMA. The pair may then slump to $0.07.
강세의 첫 번째 신호는 0.10달러를 넘는 돌파가 될 것이며 강세 모멘텀은 0.11달러를 넘어설 가능성이 높습니다. 이는 0.16달러까지 반등할 가능성을 열어줍니다. 반대로 DOGE/USDT 쌍이 50일 SMA 아래로 떨어지면 하락세가 우위를 점하게 됩니다. 그러면 통화쌍은 $0.07까지 하락할 수 있습니다.
Polkadot (DOT) price analysis
Polkadot’s pullback is nearing the breakout of $7.90, a crucial level to watch out for in the near term.
Polkadot(DOT) 가격 분석 Polkadot의 하락세는 단기적으로 주목해야 할 중요한 수준인 7.90달러 돌파에 가까워지고 있습니다.
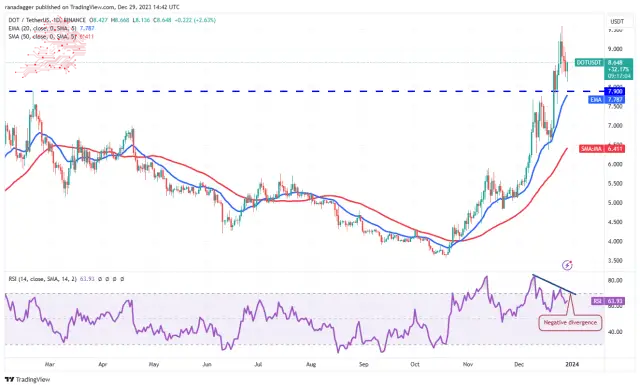
Although the upsloping moving averages indicate an advantage to buyers, the negative divergence on the RSI suggests that the bullish momentum could be slowing down. The breakout level of $7.90 will likely witness a tough battle between the bulls and the bears.
상승하는 이동 평균은 구매자에게 이점을 의미하지만 RSI의 마이너스 다이버전스는 강세 모멘텀이 둔화될 수 있음을 시사합니다. $7.90의 돌파 수준은 황소와 곰 사이의 힘든 싸움을 목격할 가능성이 높습니다.
If the price rebounds off $7.90, the DOT/USDT pair will attempt a rally to $10, where the bears are expected to offer a stiff resistance. Alternatively, if the price slides below the 20-day EMA ($7.78), the correction could deepen to the 50-day SMA ($6.41).
가격이 7.90달러에서 반등하면 DOT/USDT 쌍은 10달러까지 반등을 시도할 것이며, 여기서 약세는 강력한 저항을 제공할 것으로 예상됩니다. 또는 가격이 20일 EMA($7.78) 아래로 떨어지면 조정은 50일 SMA($6.41)까지 심화될 수 있습니다.
Polygon (MATIC) price analysis
Polygon turned down from $1.09 on Dec. 27 and dipped below the breakout level of $1 on Dec. 29, indicating profit booking by the bulls.
Polygon(MATIC) 가격 분석 Polygon은 12월 27일 $1.09에서 하락세를 보였으며 12월 29일에는 돌파 수준인 $1 아래로 떨어졌으며 이는 상승세에 의한 이익 예약을 나타냅니다.
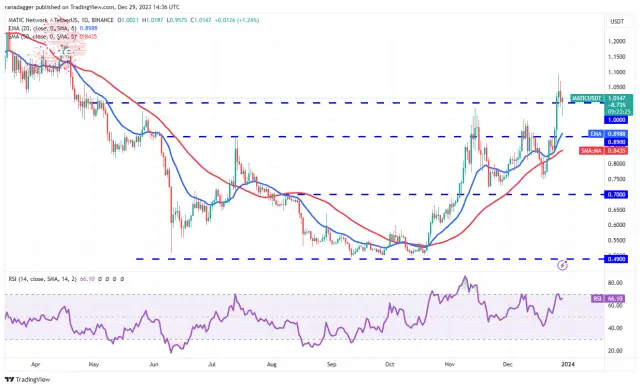
However, lower levels attracted strong buying by the bulls. Suppose the price is maintained above $1; the likelihood of a retest of $1.09 increases. The rising 20-day EMA ($0.89) and the RSI in the positive zone suggest that bulls are in command. If the $1.09 resistance is removed, the MATIC/USDT pair may rally to $1.20 and later to $1.50.
그러나 낮은 수준은 황소의 강력한 매수를 유도했습니다. 가격이 1달러 이상으로 유지된다고 가정합니다. $1.09의 재시험 가능성이 높아집니다. 상승하는 20일 EMA($0.89)와 플러스 영역의 RSI는 황소가 지배하고 있음을 나타냅니다. $1.09 저항이 제거되면 MATIC/USDT 쌍은 $1.20, 나중에 $1.50까지 상승할 수 있습니다.
Instead, if the price slips and maintains below $1, the pair could drop to the 20-day EMA. The bears must sink the price below this support to signal a rangebound action between $0.70 and $1.
대신 가격이 하락하여 $1 미만으로 유지되면 해당 쌍은 20일 EMA로 떨어질 수 있습니다. 하락세는 $0.70에서 $1 사이의 범위 내 행동을 신호하기 위해 이 지지선 아래로 가격을 내려야 합니다.
Source – Rakesh Upadhyay
출처 – Rakesh Upadhyay
Source: https://thebittimes.com/latest-market-overview-29th-dec-btc-eth-bnb-sol-xrp-ada-avax-doge-dot-matic-tbt75127.html
출처: https://thebittimes.com/latest-market-overview-29th-dec-btc-eth-bnb-sol-xrp-ada-avax-doge-dot-matic-tbt75127.html
 ETHNews
 CFN
CFN U_Today
 Thecoinrepublic.com
 DogeHome
 Optimisus
 Optimisus
 DeFi Planet
 Crypto Daily™


