In the cryptocurrency market, technical analysis stands out as an indicator that investors, especially those trading in the futures market, must continuously monitor. What clues does technical analysis provide for Dogecoin, which was trading at the level of $0.1005 at the time the article was written? We examine this question with a detailed chart analysis and important support and resistance levels.
Dogecoin Chart Analysis
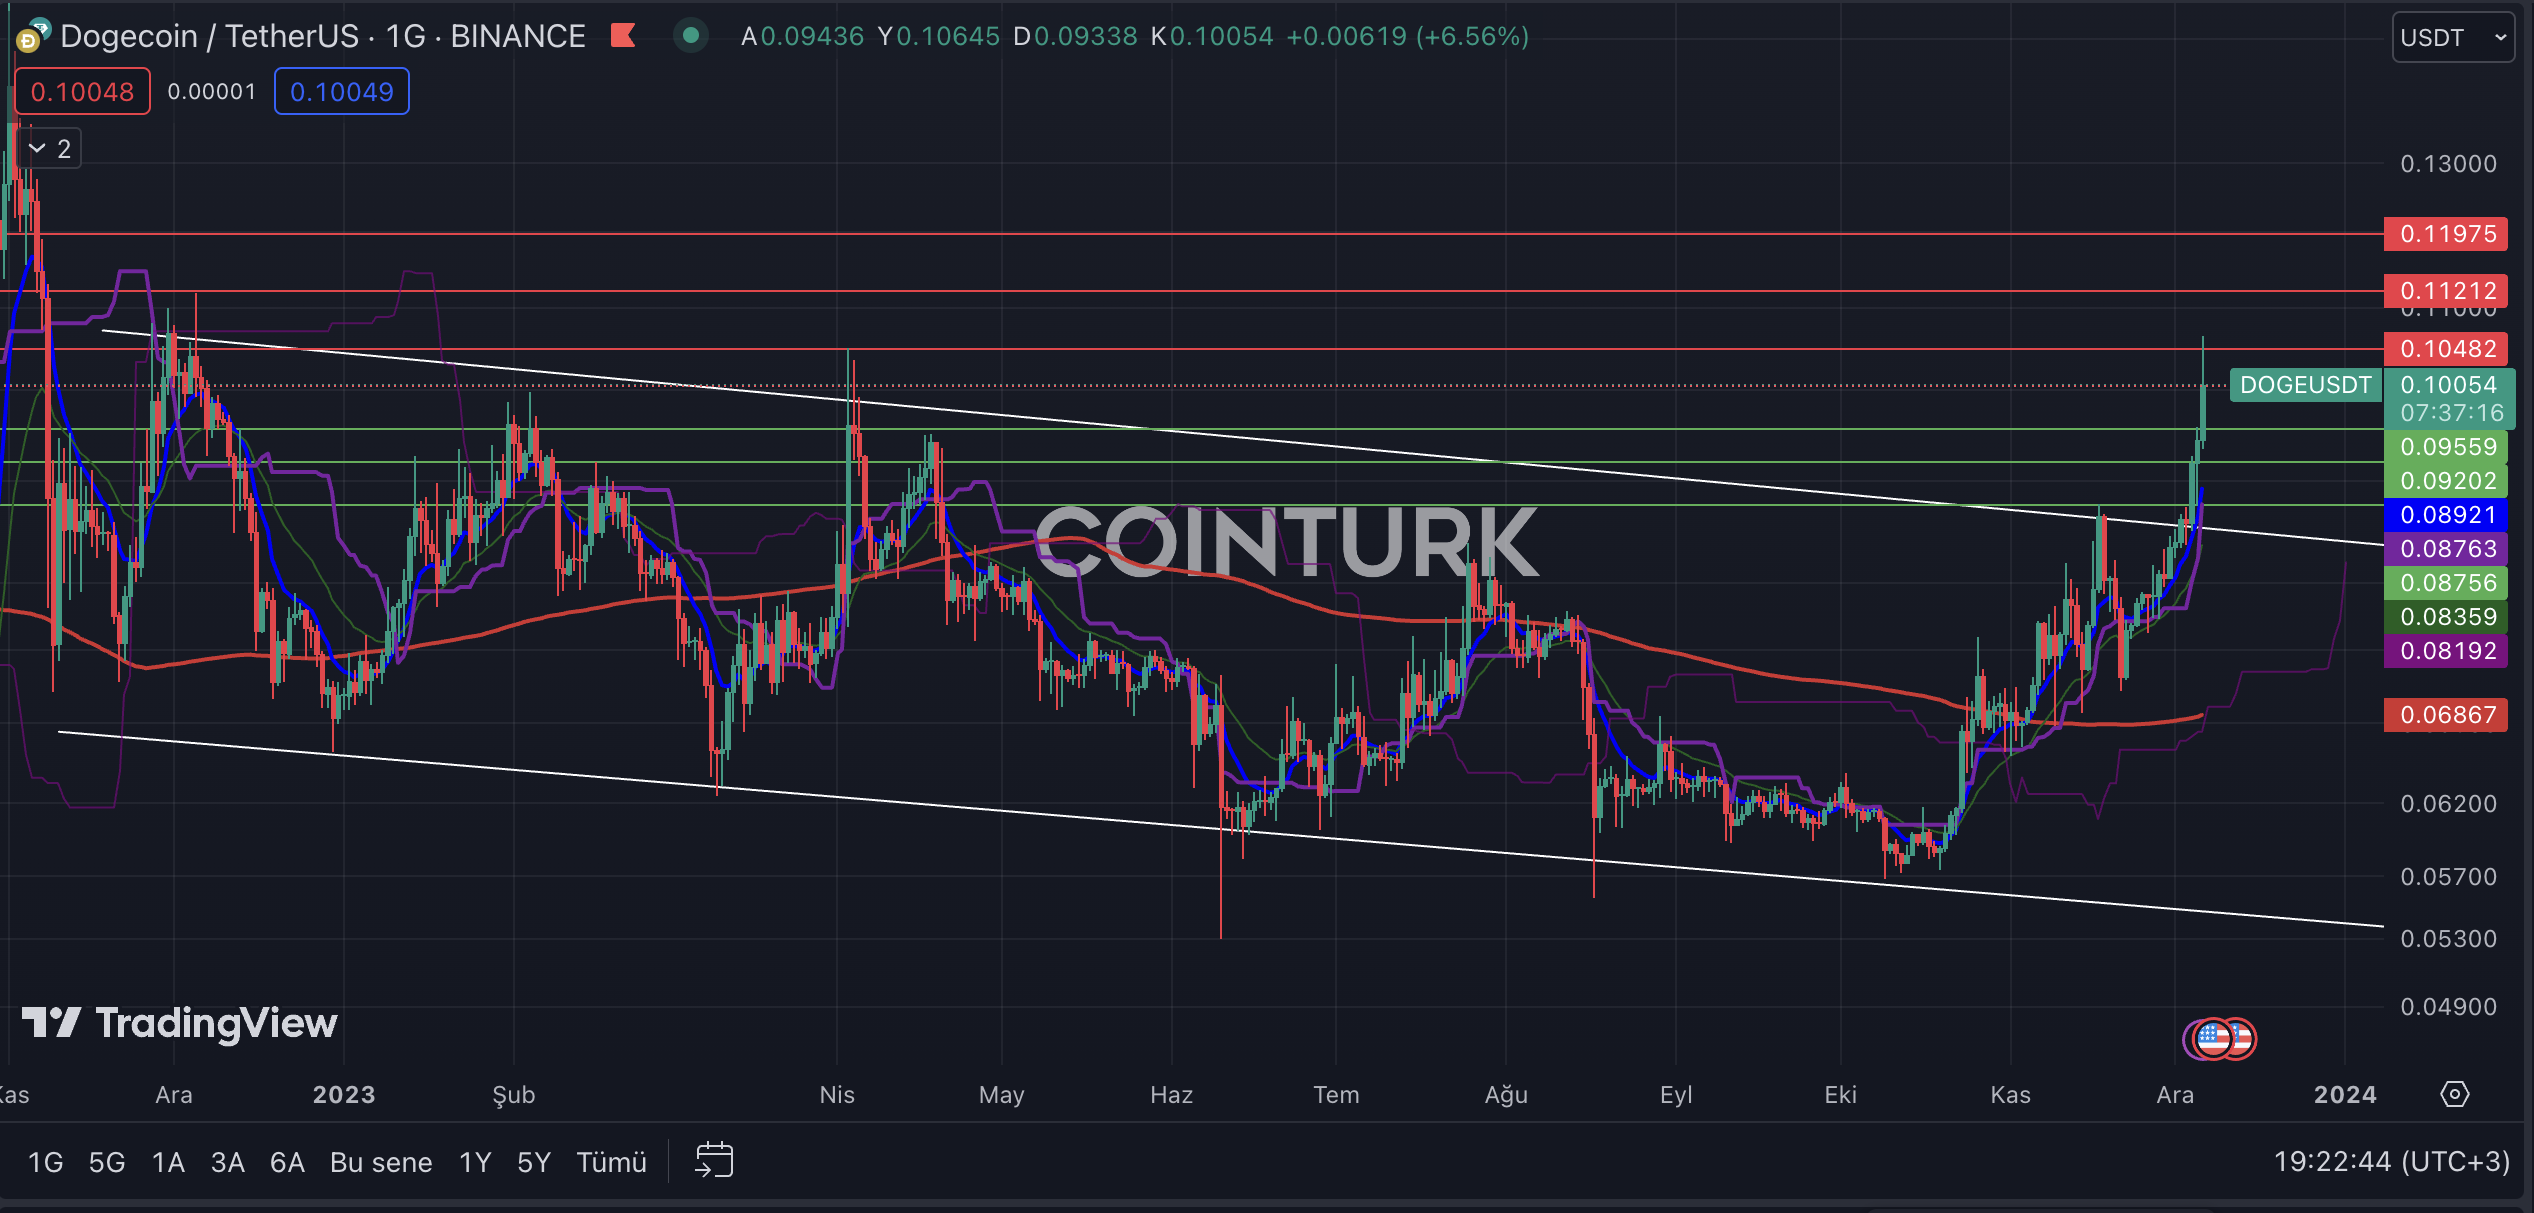
The daily DOGE chart shows that the descending channel formation structure, which has been ongoing since November 2022, was recently surpassed with the latest upward movements due to a resistance breakout. The fact that the resistance line was not retested after this momentum has created a big question mark on the DOGE front. In such breakouts, the first issue of interest to analysts is whether the price will perform a retest or not.
The most important support levels to be followed on the DOGE daily chart are, respectively; $0.0955, $0.0920, and $0.0875. In particular, a daily bar closing below the $0.0875 level will cause the price to re-enter the formation zone and create selling pressure on the DOGE front.
The most important resistance levels to be observed on the DOGE daily chart are, respectively; $0.1048, $0.1121, and $0.1197. Especially, a daily bar closing above the $0.1048 level, which posed a significant barrier during the last rise on December 6, will accelerate DOGE’s momentum.

DOGE/ETH Chart Analysis
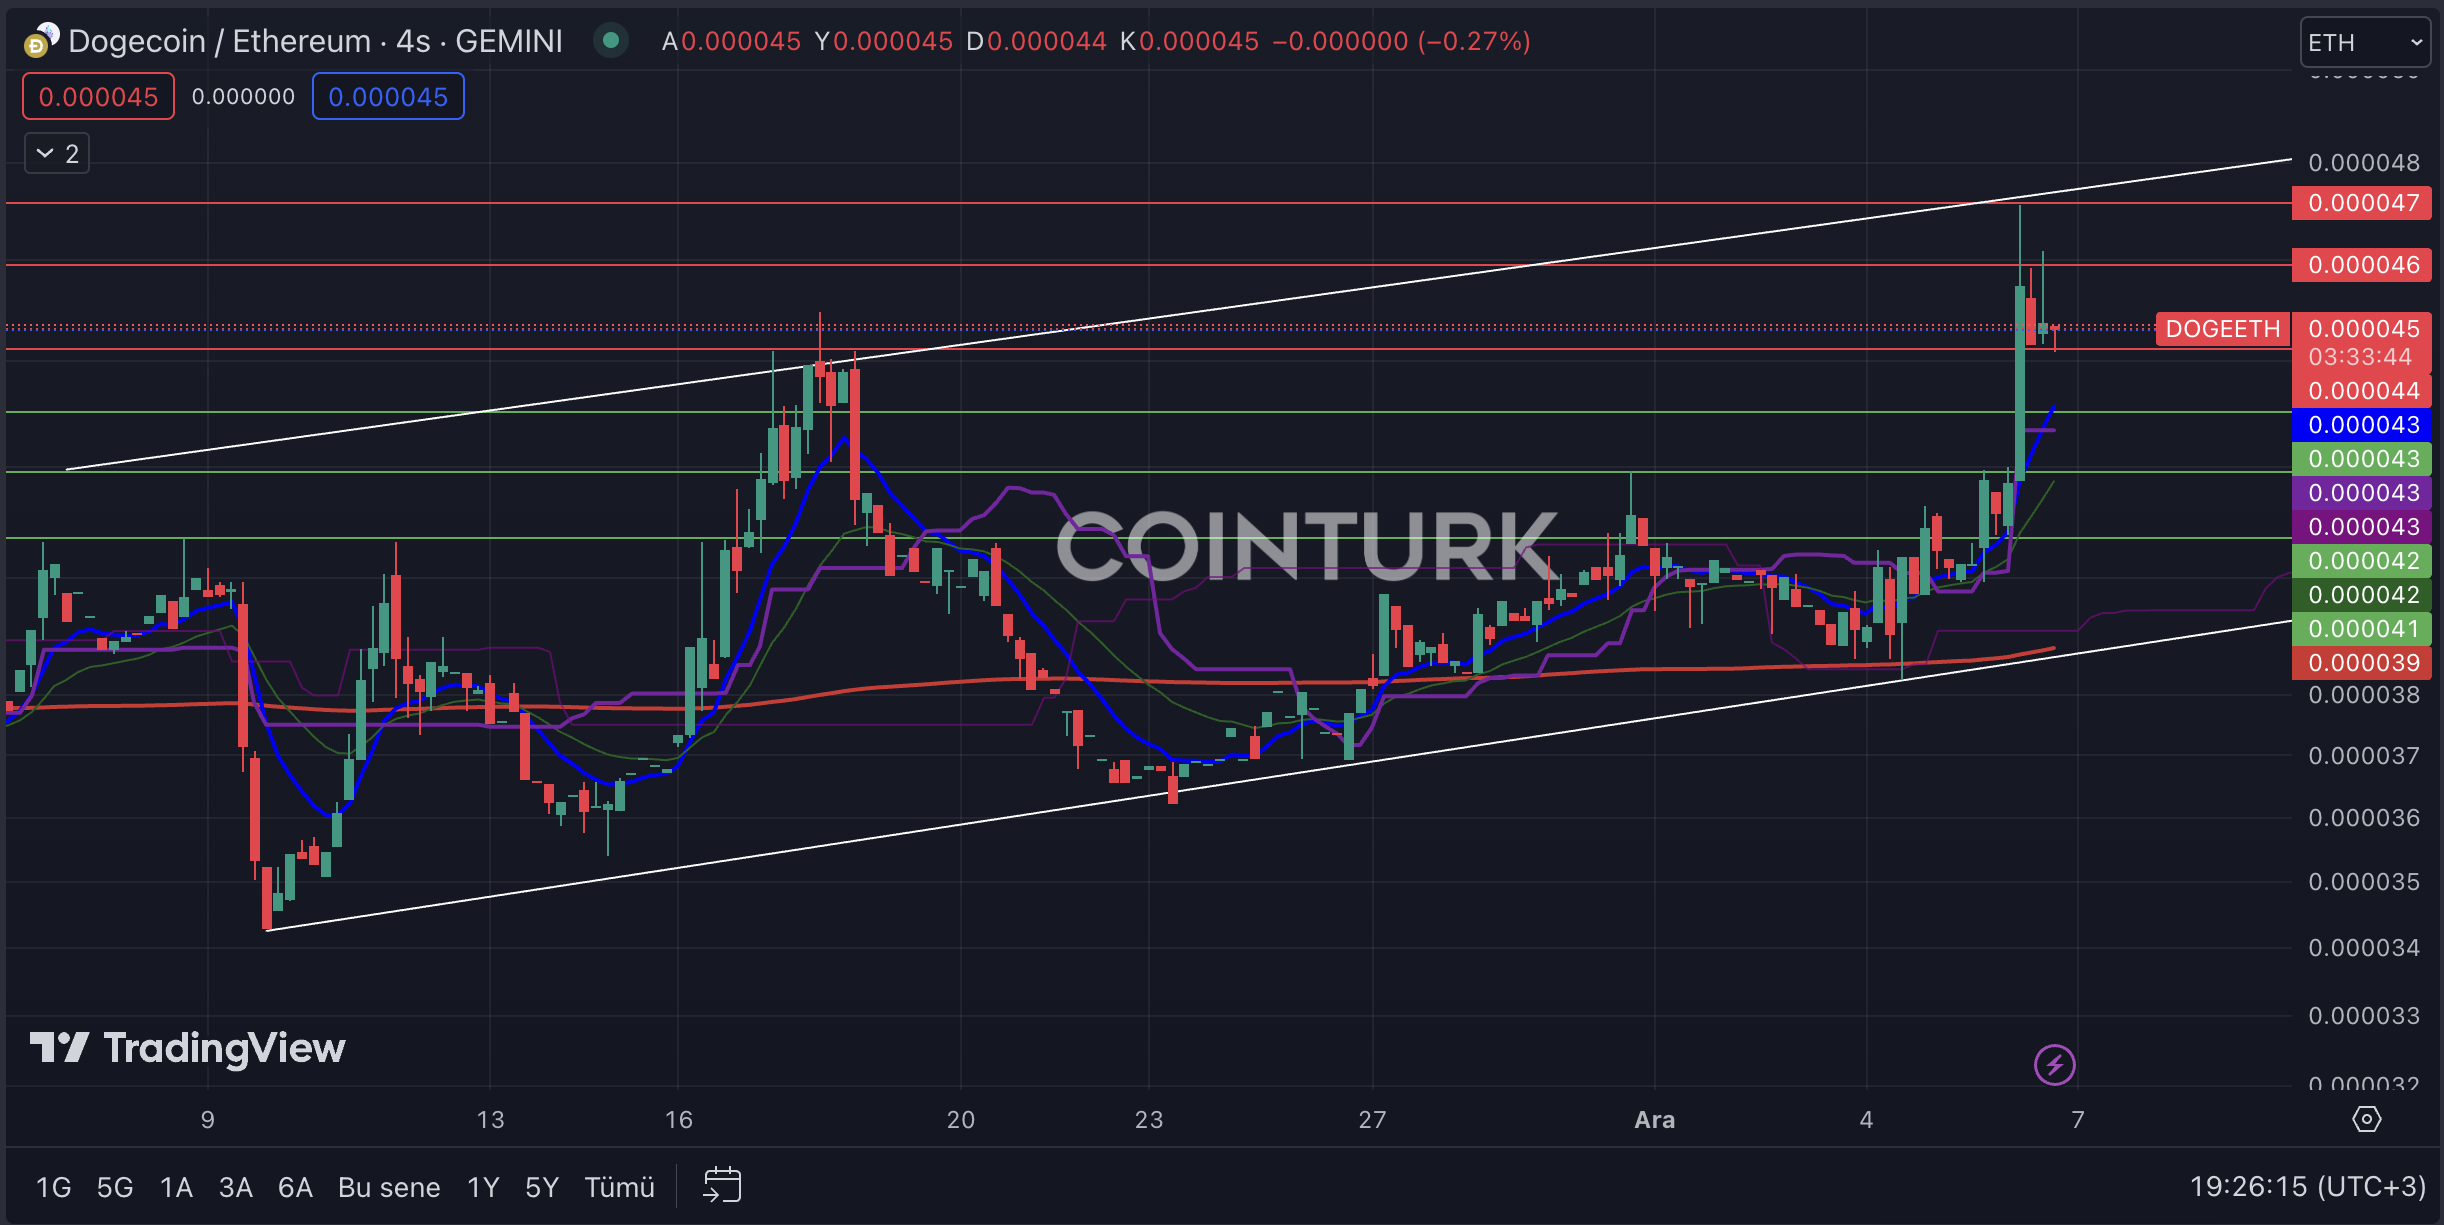
The first noticeable formation structure in the daily DOGE/ETH chart is the ascending channel formation. The lack of resistance breakout in the most recent bar formations, like the process that occurred on November 17, could lead to significant selling pressure.
The most important support levels to be monitored on the daily DOGE/ETH chart are, respectively; 0.000041, 0.000042, and 0.000043. In particular, a daily bar closing below the 0.000043 level, which intersects with the EMA 7 (blue line), will cause Dogecoin to lose value against Ethereum.
The most important resistance levels to be considered on the DOGE/ETH chart are, respectively; 0.0000455, 0.0000460, and 0.0000470. Especially, surpassing the 0.000047 level, which posed as a significant barrier during the last rise and intersects with the formation resistance, will accelerate DOGE’s momentum against Ethereum.


 Optimisus
 Crypto News Land
 Optimisus
 Cryptopolitan_News
 DogeHome
 Cryptopolitan
 crypto.ro English


