

In the cryptocurrency market, technical analysis stands out as an indicator that investors, especially those trading in the futures market, must continuously monitor. What clues does technical analysis provide for Dogecoin, which was trading at the level of $0.1005 at the time the article was written? We examine this question with a detailed chart analysis and important support and resistance levels.
암호화폐 시장에서 기술적 분석은 투자자, 특히 선물시장 거래자가 지속적으로 모니터링해야 하는 지표로 부각됩니다. 기사가 작성된 당시 0.1005달러 수준에서 거래되고 있던 Dogecoin에 대해 기술적 분석은 어떤 단서를 제공합니까? 우리는 상세한 차트 분석과 중요한 지지 및 저항 수준을 통해 이 질문을 조사합니다.
Dogecoin Chart Analysis
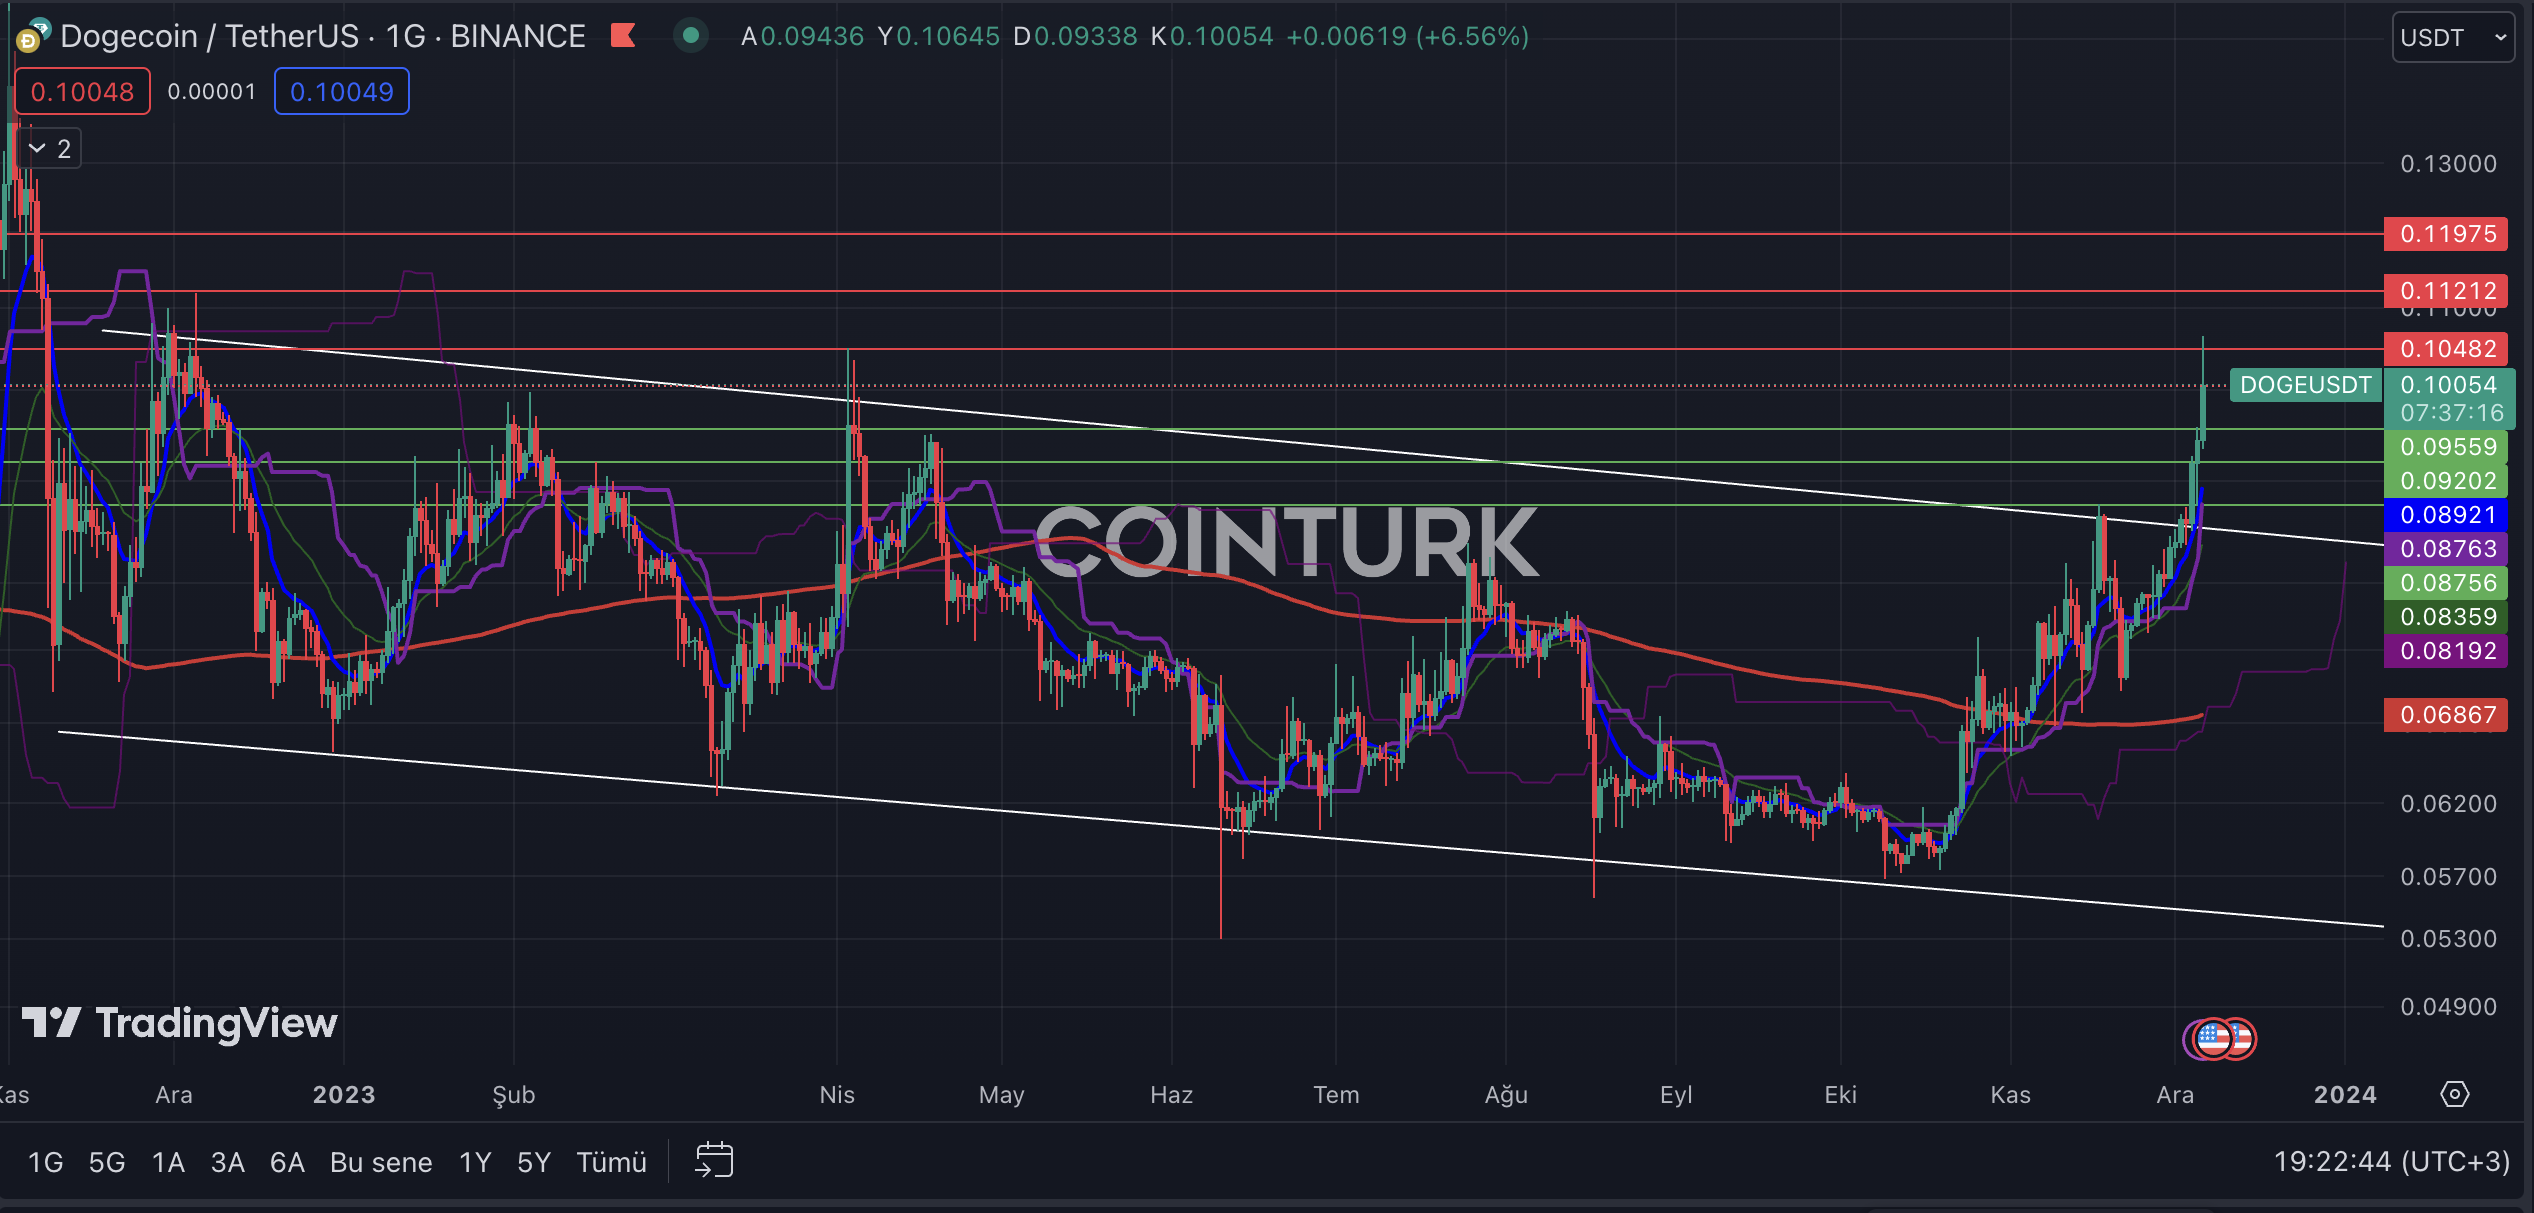
The daily DOGE chart shows that the descending channel formation structure, which has been ongoing since November 2022, was recently surpassed with the latest upward movements due to a resistance breakout. The fact that the resistance line was not retested after this momentum has created a big question mark on the DOGE front. In such breakouts, the first issue of interest to analysts is whether the price will perform a retest or not.
일봉 DOGE 차트를 보면 2022년 11월부터 지속되어온 하락형 채널 형성 구조가 최근 저항선 돌파로 인한 상승세로 추월된 모습을 보여주고 있습니다. 이 모멘텀 이후 저항선이 다시 테스트되지 않았다는 사실은 DOGE 전선에 큰 물음표를 만들었습니다. 그러한 돌파에서 분석가들이 가장 먼저 관심을 갖는 문제는 가격이 재시험을 할 것인지 여부입니다.
The most important support levels to be followed on the DOGE daily chart are, respectively; $0.0955, $0.0920, and $0.0875. In particular, a daily bar closing below the $0.0875 level will cause the price to re-enter the formation zone and create selling pressure on the DOGE front.
The most important resistance levels to be observed on the DOGE daily chart are, respectively; $0.1048, $0.1121, and $0.1197. Especially, a daily bar closing above the $0.1048 level, which posed a significant barrier during the last rise on December 6, will accelerate DOGE’s momentum.
DOGE/ETH Chart Analysis
DOGE/ETH 차트 분석
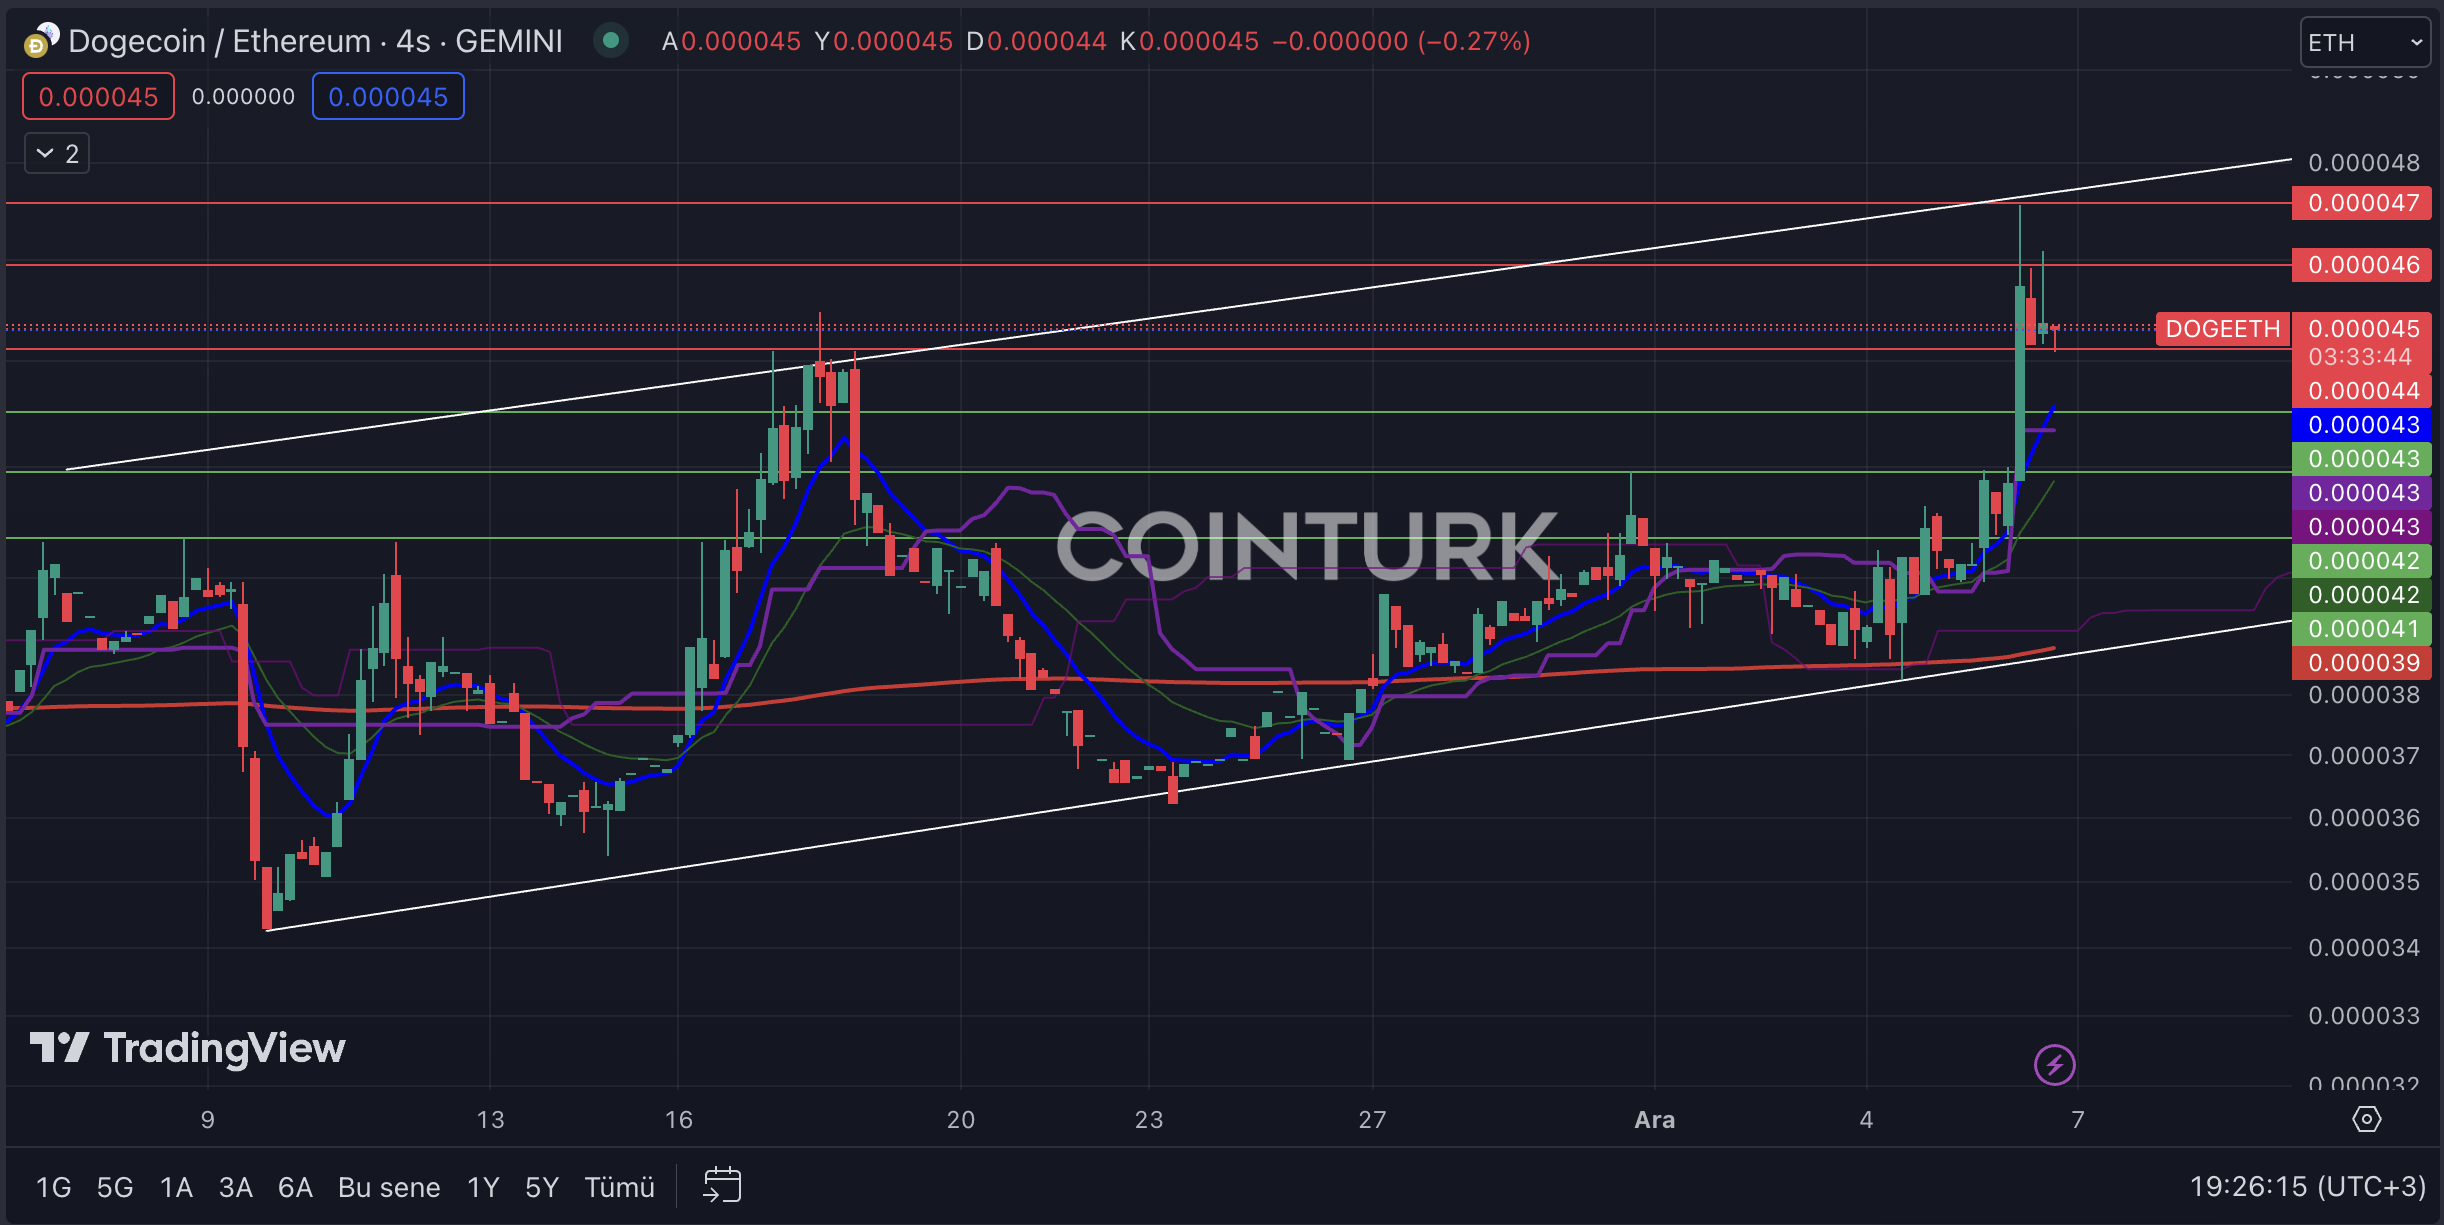
The first noticeable formation structure in the daily DOGE/ETH chart is the ascending channel formation. The lack of resistance breakout in the most recent bar formations, like the process that occurred on November 17, could lead to significant selling pressure.
The most important support levels to be monitored on the daily DOGE/ETH chart are, respectively; 0.000041, 0.000042, and 0.000043. In particular, a daily bar closing below the 0.000043 level, which intersects with the EMA 7 (blue line), will cause Dogecoin to lose value against Ethereum.
The most important resistance levels to be considered on the DOGE/ETH chart are, respectively; 0.0000455, 0.0000460, and 0.0000470. Especially, surpassing the 0.000047 level, which posed as a significant barrier during the last rise and intersects with the formation resistance, will accelerate DOGE’s momentum against Ethereum.
DOGE/ETH 차트에서 고려해야 할 가장 중요한 저항 수준은 각각 다음과 같습니다. 0.0000455, 0.0000460, 0.0000470. 특히, 지난 상승 시 상당한 장벽으로 작용하고 형성 저항과 교차하는 0.000047 수준을 넘어서면 이더리움에 대한 DOGE의 모멘텀이 가속화될 것입니다.
계속 읽기: https://en.coin-turk.com/technical-analytic-of-the-dogecoin-market/
 CryptoPotato_News
 DT News
 crypto.news
 TheNewsCrypto
 CoinsProbe
 Optimisus
 Cryptopolitan_News
 Bitcoin Sistemi EN
 DogeHome


