In the cryptocurrency market, technical analysis stands out as an indicator that investors, especially those trading in the futures market, must continuously monitor. What clues does technical analysis provide for Dogecoin, which was trading at the level of $0.1005 at the time the article was written? We examine this question with a detailed chart analysis and important support and resistance levels.
Auf dem Kryptowährungsmarkt ist die technische Analyse ein Indikator, den Anleger, insbesondere diejenigen, die auf dem Terminmarkt handeln, kontinuierlich überwachen müssen. Welche Hinweise liefert die technische Analyse für Dogecoin, der zum Zeitpunkt der Erstellung des Artikels auf dem Niveau von 0,1005 US-Dollar gehandelt wurde? Wir gehen dieser Frage anhand einer detaillierten Chartanalyse und wichtigen Unterstützungs- und Widerstandsniveaus nach.
Dogecoin Chart Analysis
Dogecoin-Chartanalyse
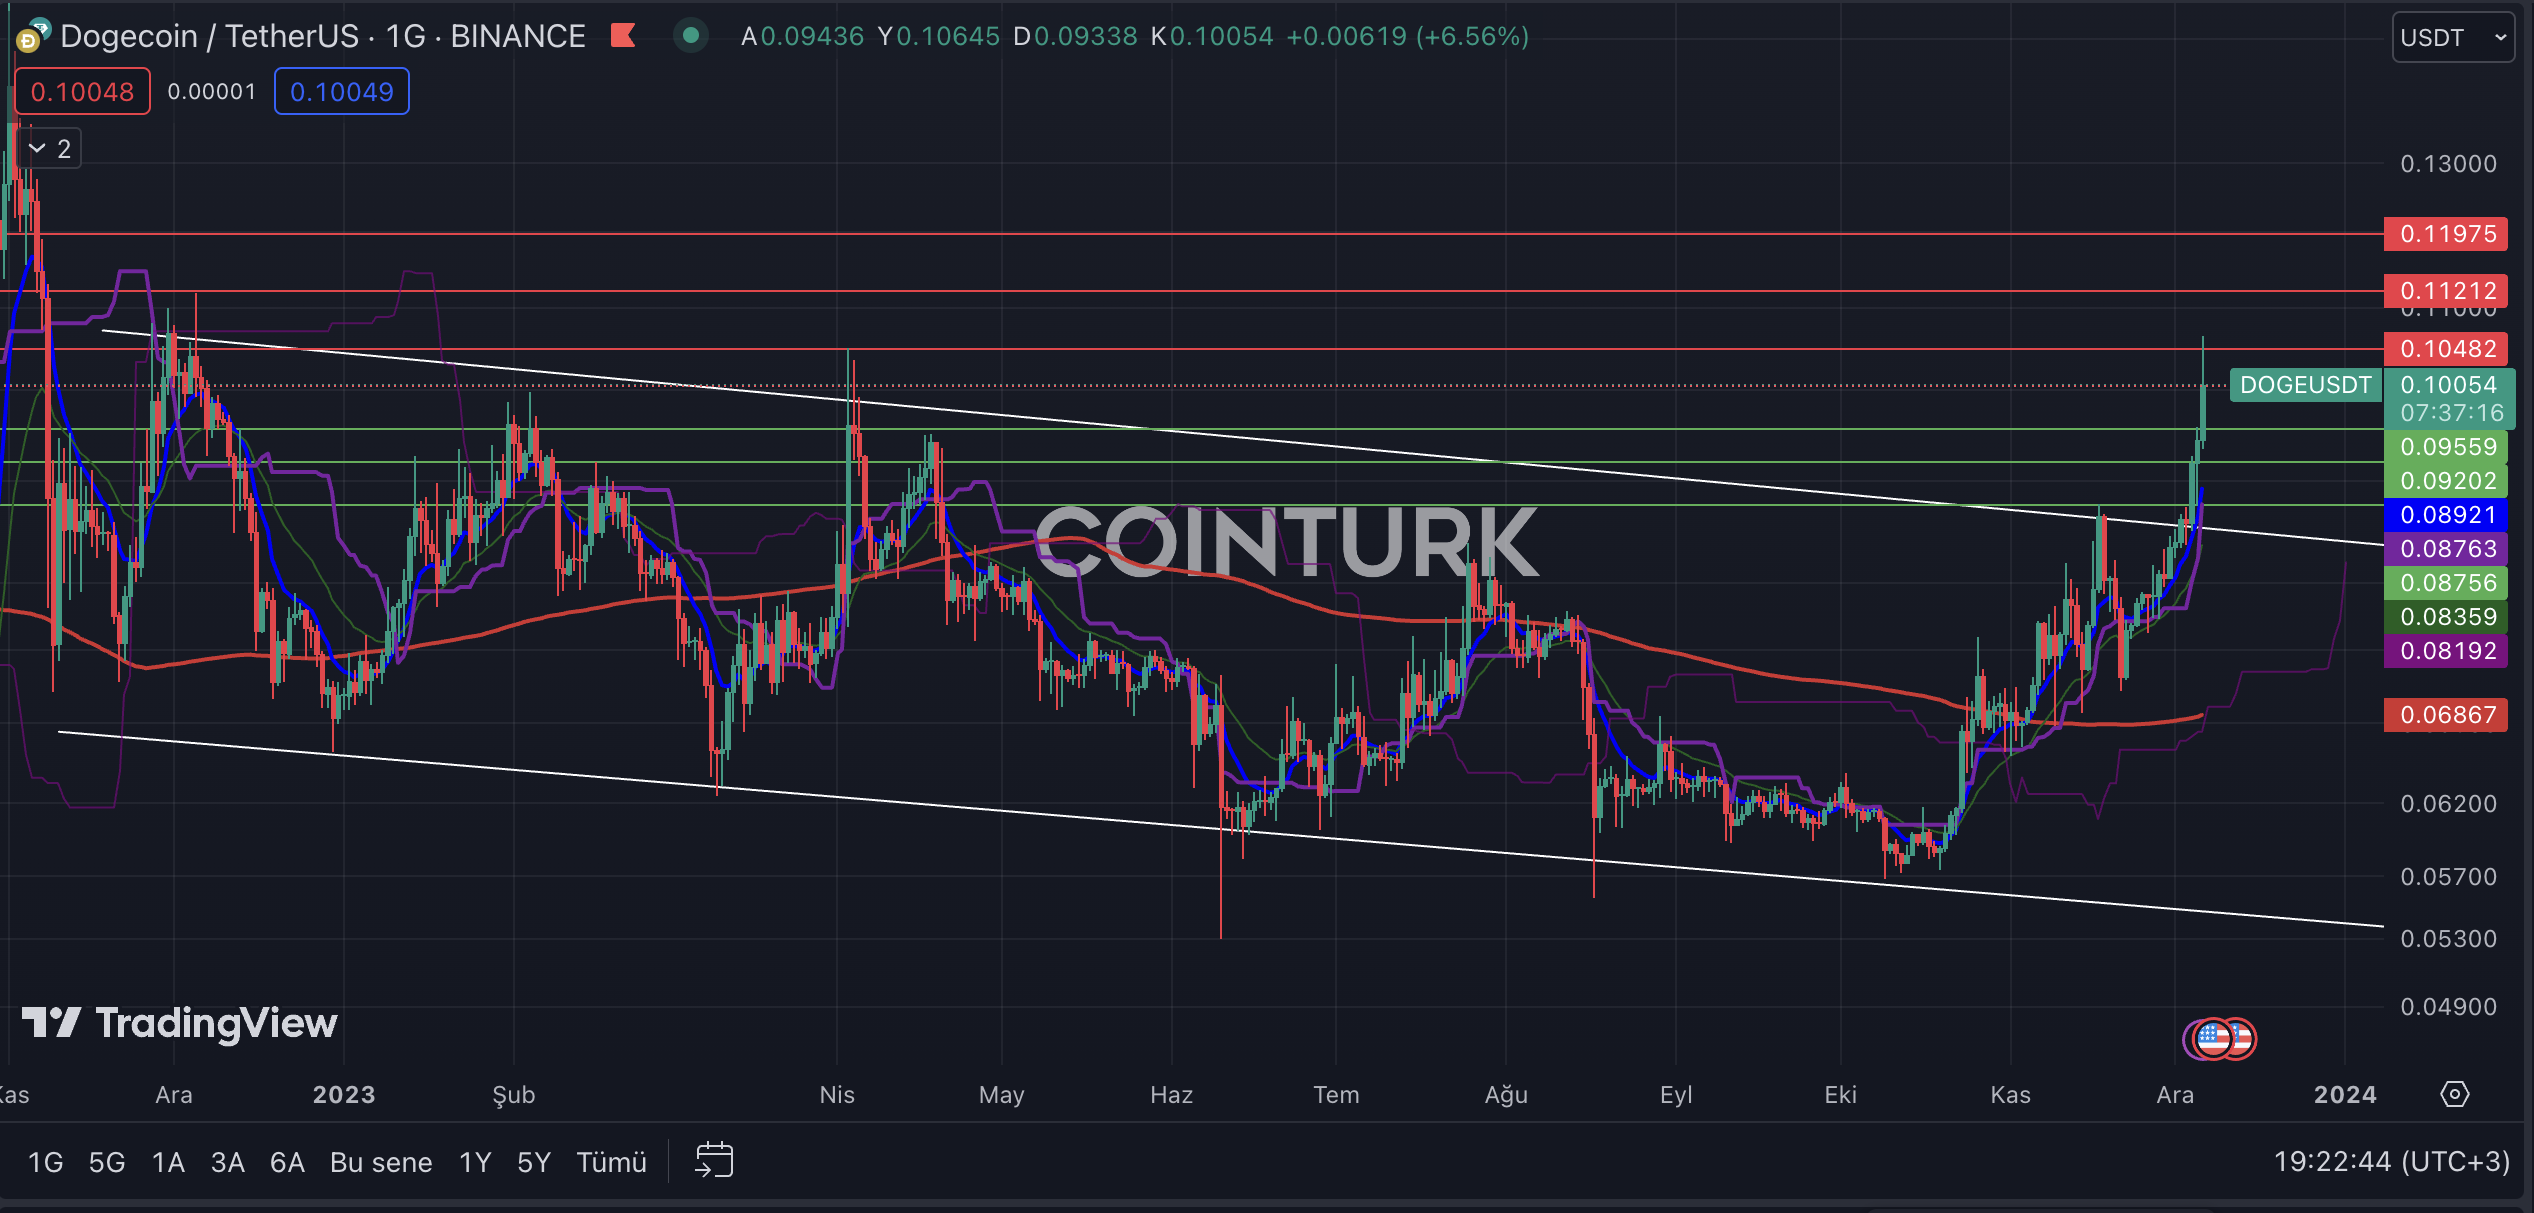
The daily DOGE chart shows that the descending channel formation structure, which has been ongoing since November 2022, was recently surpassed with the latest upward movements due to a resistance breakout. The fact that the resistance line was not retested after this momentum has created a big question mark on the DOGE front. In such breakouts, the first issue of interest to analysts is whether the price will perform a retest or not.
Der tägliche DOGE-Chart zeigt, dass die seit November 2022 andauernde absteigende Kanalbildungsstruktur kürzlich mit den jüngsten Aufwärtsbewegungen aufgrund eines Widerstandsdurchbruchs übertroffen wurde. Die Tatsache, dass die Widerstandslinie nach dieser Dynamik nicht erneut getestet wurde, hat an der DOGE-Front für ein großes Fragezeichen gesorgt. Bei solchen Ausbrüchen ist für Analysten zunächst die Frage von Interesse, ob der Preis erneut getestet wird oder nicht.
The most important support levels to be followed on the DOGE daily chart are, respectively; $0.0955, $0.0920, and $0.0875. In particular, a daily bar closing below the $0.0875 level will cause the price to re-enter the formation zone and create selling pressure on the DOGE front.
Die wichtigsten Unterstützungsniveaus, die auf dem DOGE-Tages-Chart zu verfolgen sind, sind jeweils: 0,0955 $, 0,0920 $ und 0,0875 $. Insbesondere ein Tageskurs, der unter dem Niveau von 0,0875 $ schließt, wird dazu führen, dass der Preis wieder in die Formationszone eintritt und Verkaufsdruck an der DOGE-Front erzeugt.
The most important resistance levels to be observed on the DOGE daily chart are, respectively; $0.1048, $0.1121, and $0.1197. Especially, a daily bar closing above the $0.1048 level, which posed a significant barrier during the last rise on December 6, will accelerate DOGE’s momentum.
Die wichtigsten Widerstandsniveaus, die auf dem DOGE-Tages-Chart zu beobachten sind, sind: 0,1048 $, 0,1121 $ und 0,1197 $. Insbesondere ein Tageskurs, der über dem Niveau von 0,1048 US-Dollar schließt, das beim letzten Anstieg am 6. Dezember ein erhebliches Hindernis darstellte, wird die Dynamik von DOGE beschleunigen.

DOGE/ETH Chart Analysis
DOGE/ETH-Chartanalyse
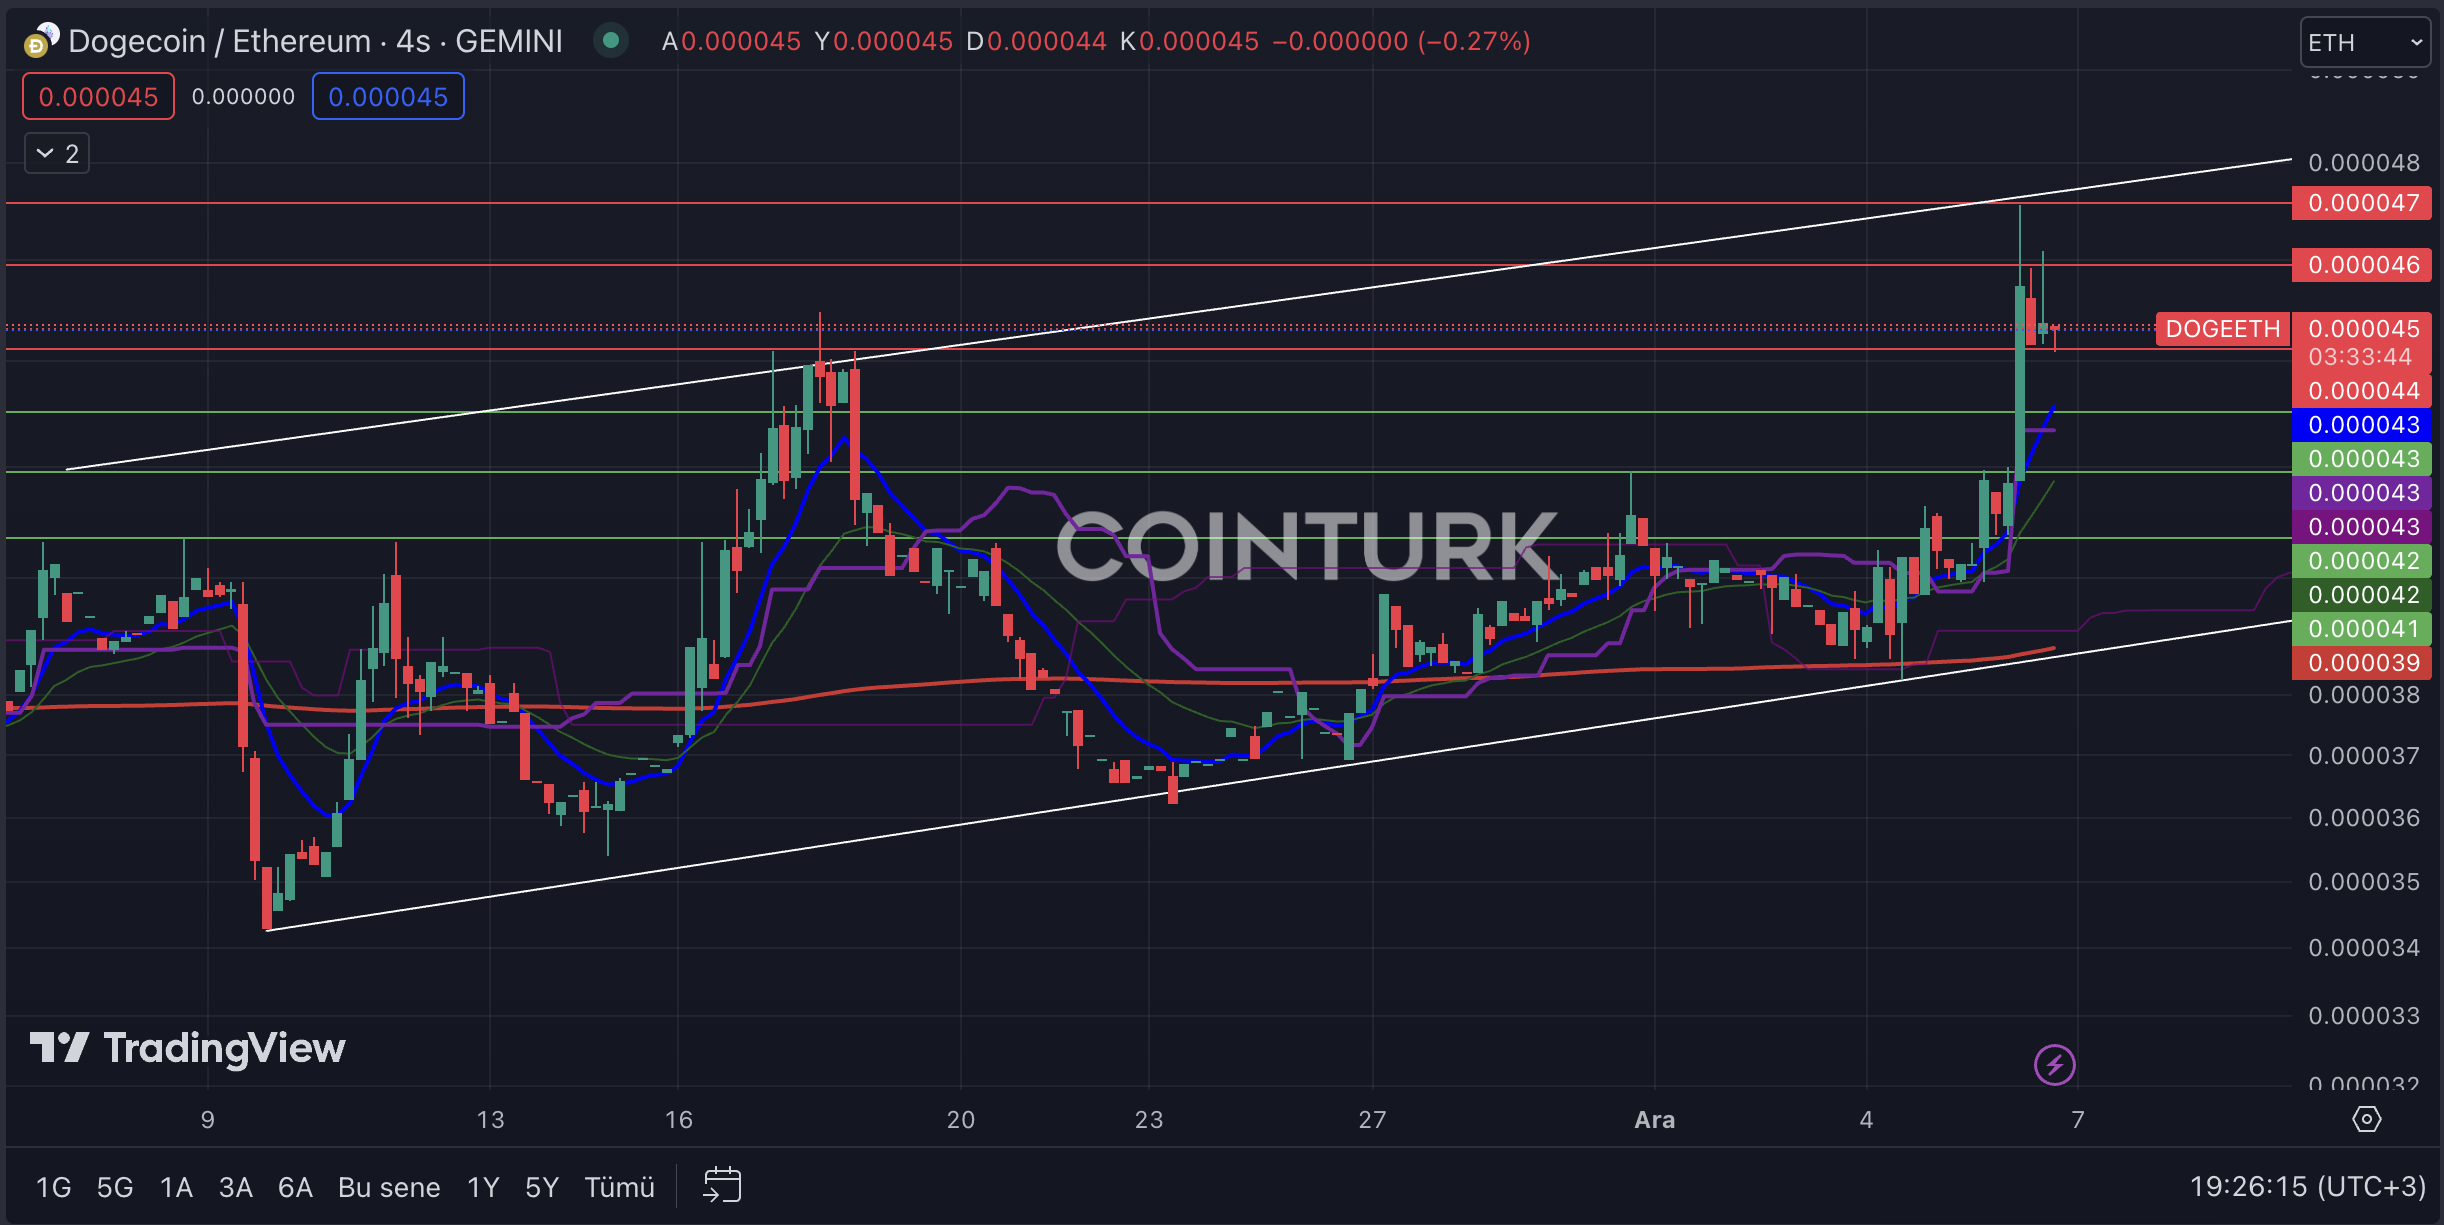
The first noticeable formation structure in the daily DOGE/ETH chart is the ascending channel formation. The lack of resistance breakout in the most recent bar formations, like the process that occurred on November 17, could lead to significant selling pressure.
Die erste auffällige Formationsstruktur im täglichen DOGE/ETH-Chart ist die aufsteigende Kanalformation. Das Fehlen eines Widerstandsdurchbruchs in den jüngsten Balkenformationen, wie er am 17. November stattfand, könnte zu erheblichem Verkaufsdruck führen.
The most important support levels to be monitored on the daily DOGE/ETH chart are, respectively; 0.000041, 0.000042, and 0.000043. In particular, a daily bar closing below the 0.000043 level, which intersects with the EMA 7 (blue line), will cause Dogecoin to lose value against Ethereum.
Die wichtigsten Unterstützungsniveaus, die auf dem täglichen DOGE/ETH-Chart überwacht werden müssen, sind: 0,000041, 0,000042 und 0,000043. Insbesondere ein Tagesbalken, der unter dem Niveau von 0,000043 schließt, das sich mit dem EMA 7 (blaue Linie) schneidet, führt dazu, dass Dogecoin gegenüber Ethereum an Wert verliert.
The most important resistance levels to be considered on the DOGE/ETH chart are, respectively; 0.0000455, 0.0000460, and 0.0000470. Especially, surpassing the 0.000047 level, which posed as a significant barrier during the last rise and intersects with the formation resistance, will accelerate DOGE’s momentum against Ethereum.
Die wichtigsten Widerstandsniveaus, die im DOGE/ETH-Diagramm berücksichtigt werden müssen, sind: 0,0000455, 0,0000460 und 0,0000470. Insbesondere das Überschreiten des Niveaus von 0,000047, das während des letzten Anstiegs eine erhebliche Barriere darstellte und sich mit dem Formationswiderstand kreuzt, wird die Dynamik von DOGE gegenüber Ethereum beschleunigen.

Weiterlesen: https://en.coin-turk.com/technical-analysis-of-the-dogecoin-market/


 DogeHome
 Optimisus
 Crypto News Land
 Optimisus
 Cryptopolitan_News
 Cryptopolitan


