

In the cryptocurrency market, technical analysis stands out as an indicator that investors, especially those trading in the futures market, must continuously monitor. What clues does technical analysis provide for Dogecoin, which was trading at the level of $0.1005 at the time the article was written? We examine this question with a detailed chart analysis and important support and resistance levels.
在加密货币市场中,技术分析是投资者,尤其是期货市场交易者必须持续监控的指标。在撰写本文时,狗狗币的交易价格为 0.1005 美元,技术分析为狗狗币提供了哪些线索?我们通过详细的图表分析以及重要的支撑位和阻力位来研究这个问题。
Dogecoin Chart Analysis
狗狗币图表分析
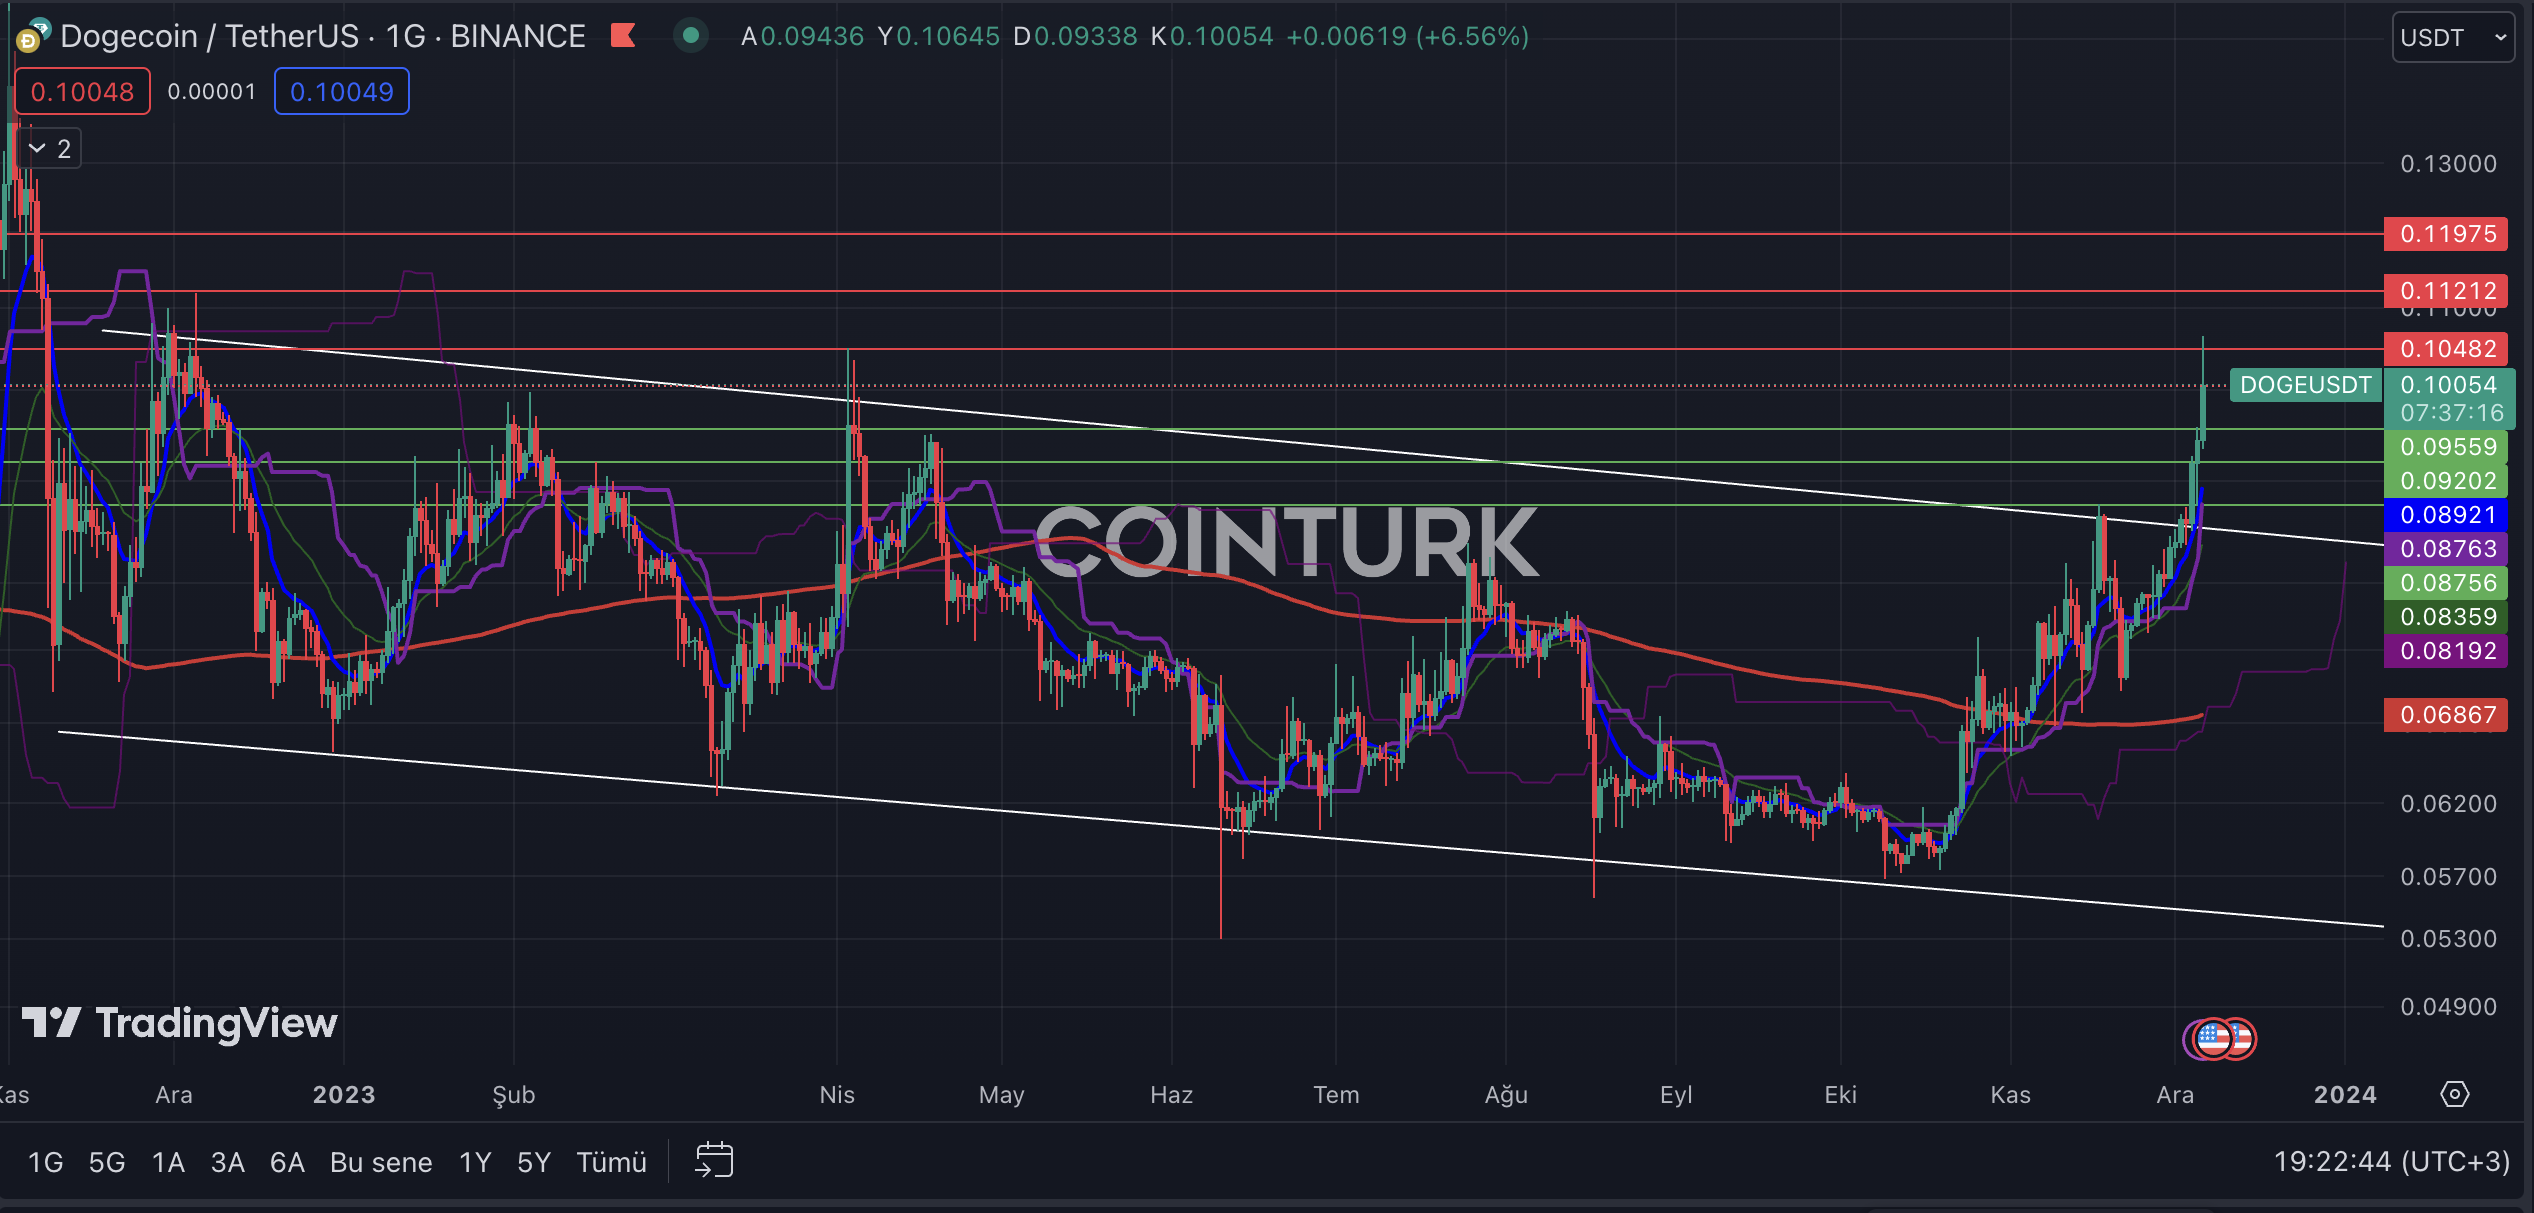
The daily DOGE chart shows that the descending channel formation structure, which has been ongoing since November 2022, was recently surpassed with the latest upward movements due to a resistance breakout. The fact that the resistance line was not retested after this momentum has created a big question mark on the DOGE front. In such breakouts, the first issue of interest to analysts is whether the price will perform a retest or not.
每日 DOGE 图表显示,自 2022 年 11 月以来一直持续的下降通道形成结构最近由于阻力突破而被最新的上升趋势所超越。事实上,在这种势头之后,阻力线没有被重新测试,这给狗狗币前面留下了一个很大的问号。在这种突破中,分析师首先感兴趣的问题是价格是否会进行重新测试。
The most important support levels to be followed on the DOGE daily chart are, respectively; $0.0955, $0.0920, and $0.0875. In particular, a daily bar closing below the $0.0875 level will cause the price to re-enter the formation zone and create selling pressure on the DOGE front.
DOGE 日线图上最重要的支撑位分别是: 0.0955 美元、0.0920 美元和 0.0875 美元。特别是,日线收盘价低于 0.0875 美元水平将导致价格重新进入形成区域,并对 DOGE 前沿造成抛售压力。
The most important resistance levels to be observed on the DOGE daily chart are, respectively; $0.1048, $0.1121, and $0.1197. Especially, a daily bar closing above the $0.1048 level, which posed a significant barrier during the last rise on December 6, will accelerate DOGE’s momentum.
DOGE 日线图上要观察到的最重要的阻力位分别是: 0.1048 美元、0.1121 美元和 0.1197 美元。特别是,日线收于 0.1048 美元上方,这在 12 月 6 日的上次上涨中构成了重大障碍,将加速 DOGE 的势头。
DOGE/ETH Chart Analysis
DOGE/ETH 图表分析
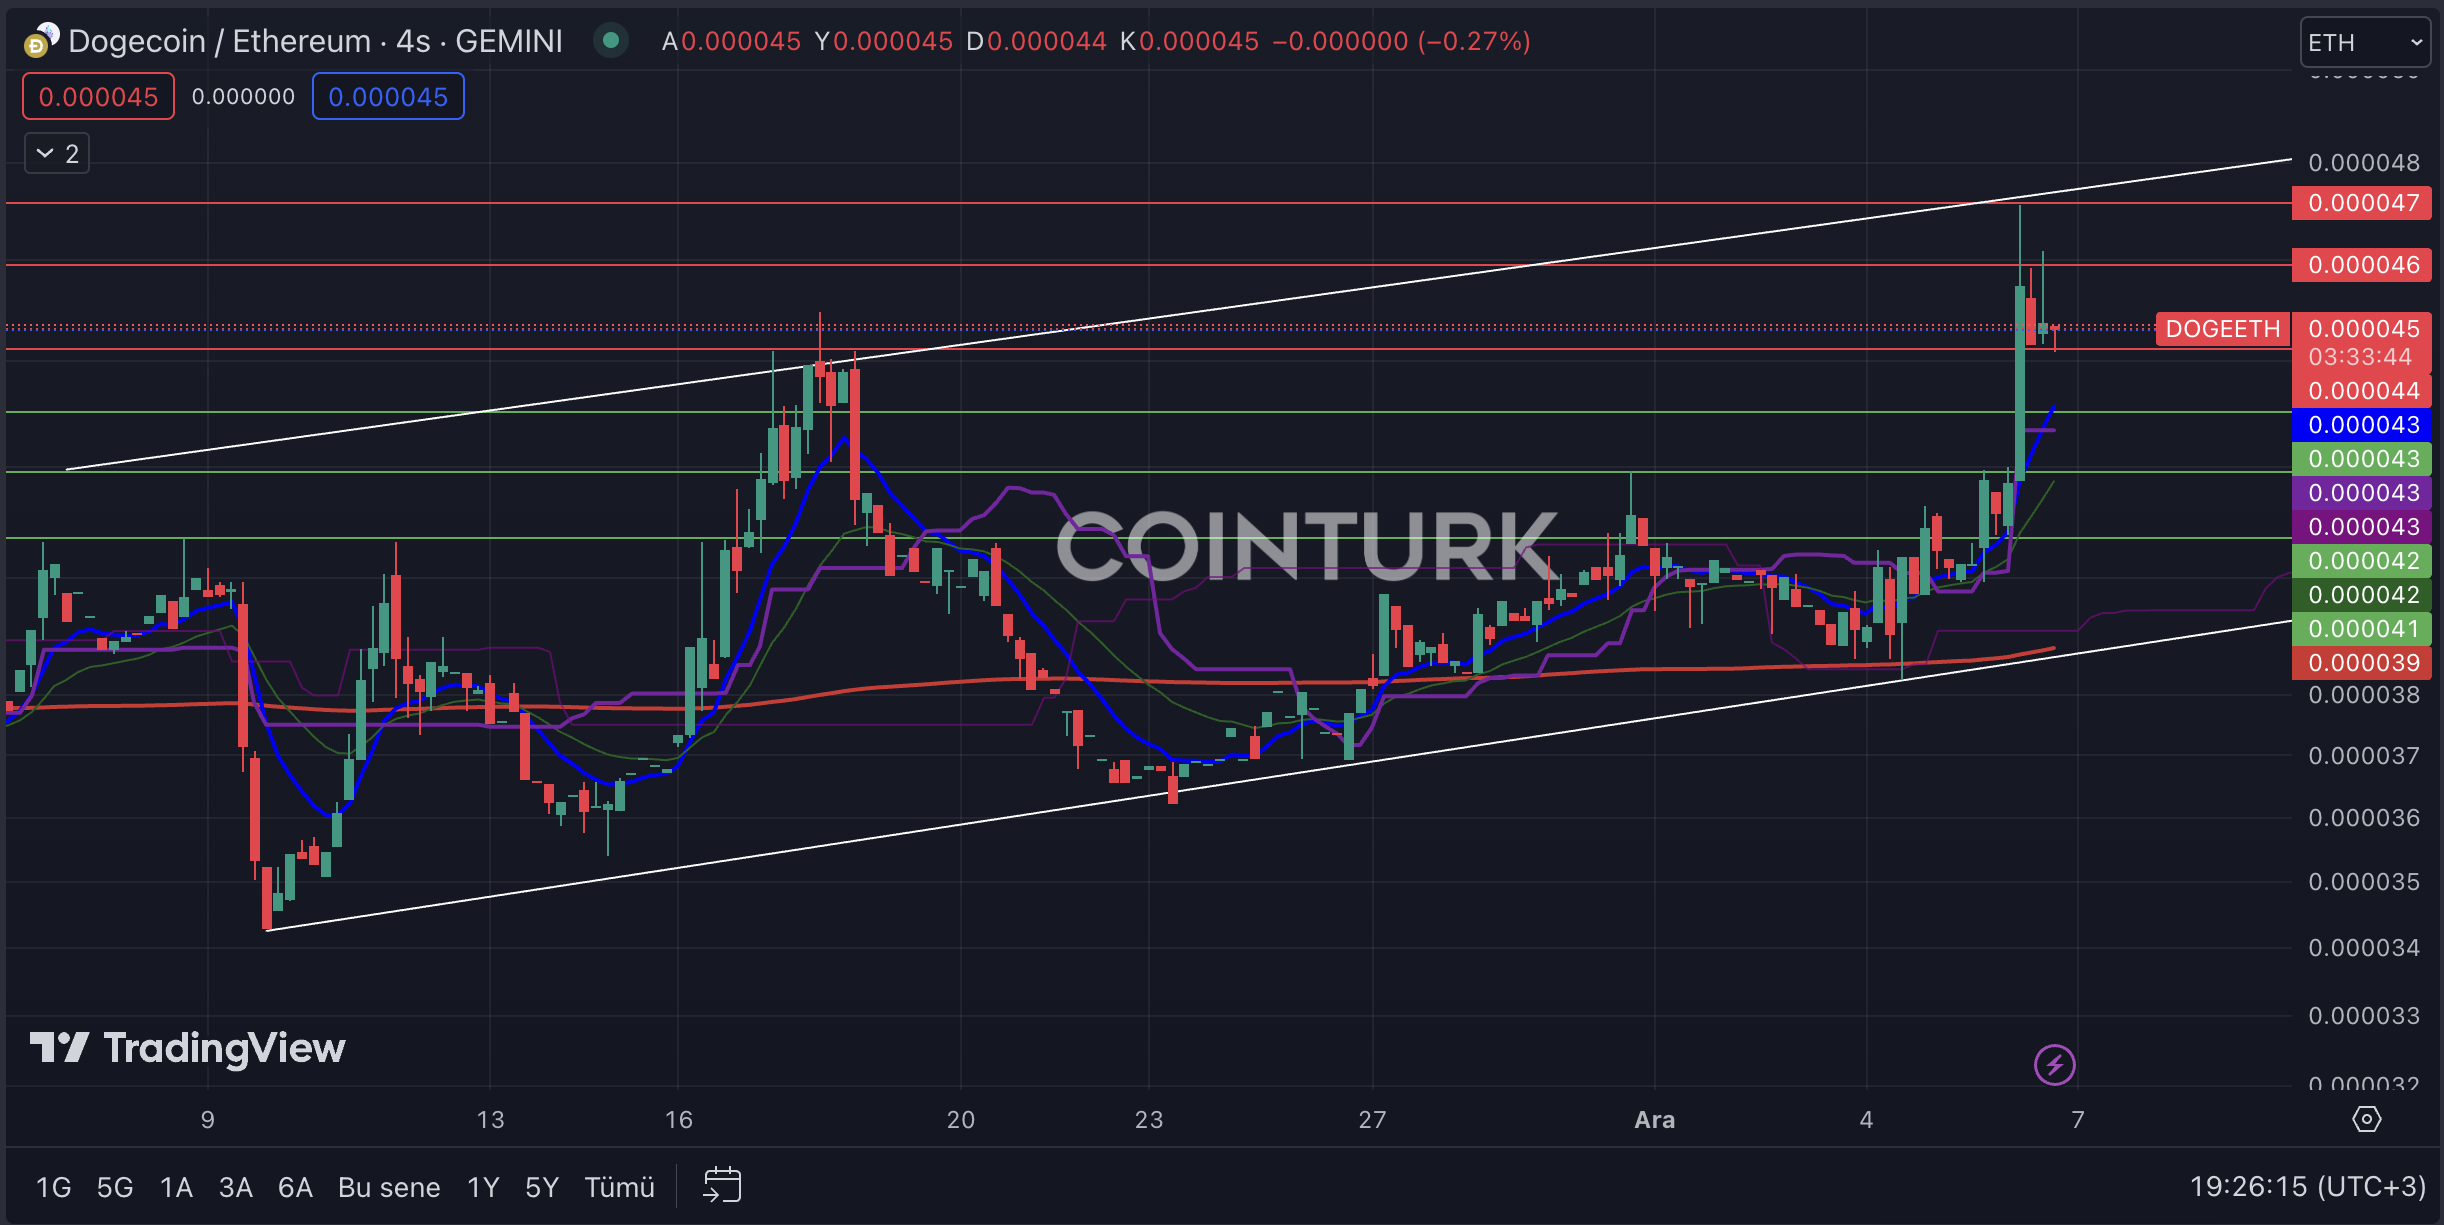
The first noticeable formation structure in the daily DOGE/ETH chart is the ascending channel formation. The lack of resistance breakout in the most recent bar formations, like the process that occurred on November 17, could lead to significant selling pressure.
DOGE/ETH 日线图表中第一个值得注意的形态结构是上升通道形态。最近的柱状结构中缺乏阻力突破,就像 11 月 17 日发生的过程一样,可能会导致巨大的抛售压力。
The most important support levels to be monitored on the daily DOGE/ETH chart are, respectively; 0.000041, 0.000042, and 0.000043. In particular, a daily bar closing below the 0.000043 level, which intersects with the EMA 7 (blue line), will cause Dogecoin to lose value against Ethereum.
DOGE/ETH 每日图表上需要监控的最重要的支撑位分别是: 0.000041、0.000042 和 0.000043。特别是,日线收盘价低于 0.000043 水平(与 EMA 7(蓝线)相交)将导致狗狗币兑以太坊价值下跌。
The most important resistance levels to be considered on the DOGE/ETH chart are, respectively; 0.0000455, 0.0000460, and 0.0000470. Especially, surpassing the 0.000047 level, which posed as a significant barrier during the last rise and intersects with the formation resistance, will accelerate DOGE’s momentum against Ethereum.
DOGE/ETH 图表上要考虑的最重要的阻力位分别是: 0.0000455、0.0000460 和 0.0000470。特别是,突破上次上涨期间构成重大障碍并与形成阻力相交的0.000047水平,将加速DOGE兑以太坊的势头。
继续阅读:https://en.coin-turk.com/technical-analysis-of-the-dogecoin-market/
 TheNewsCrypto
 CFN
CFN DogeHome
 Optimisus
 Crypto News Land
 Optimisus
 Cryptopolitan_News


