In the cryptocurrency market, technical analysis stands out as an indicator that investors, especially those trading in the futures market, must continuously monitor. What clues does technical analysis provide for Dogecoin, which was trading at the level of $0.1005 at the time the article was written? We examine this question with a detailed chart analysis and important support and resistance levels.
暗号通貨市場では、投資家、特に先物市場で取引する投資家が継続的に監視する必要がある指標としてテクニカル分析が際立っています。テクニカル分析は、記事執筆時点で0.1005ドルのレベルで取引されていたドージコインにどのような手がかりを提供するのでしょうか?詳細なチャート分析と重要なサポートとレジスタンスのレベルを使用して、この疑問を検証します。
Dogecoin Chart Analysis
ドージコインチャート分析
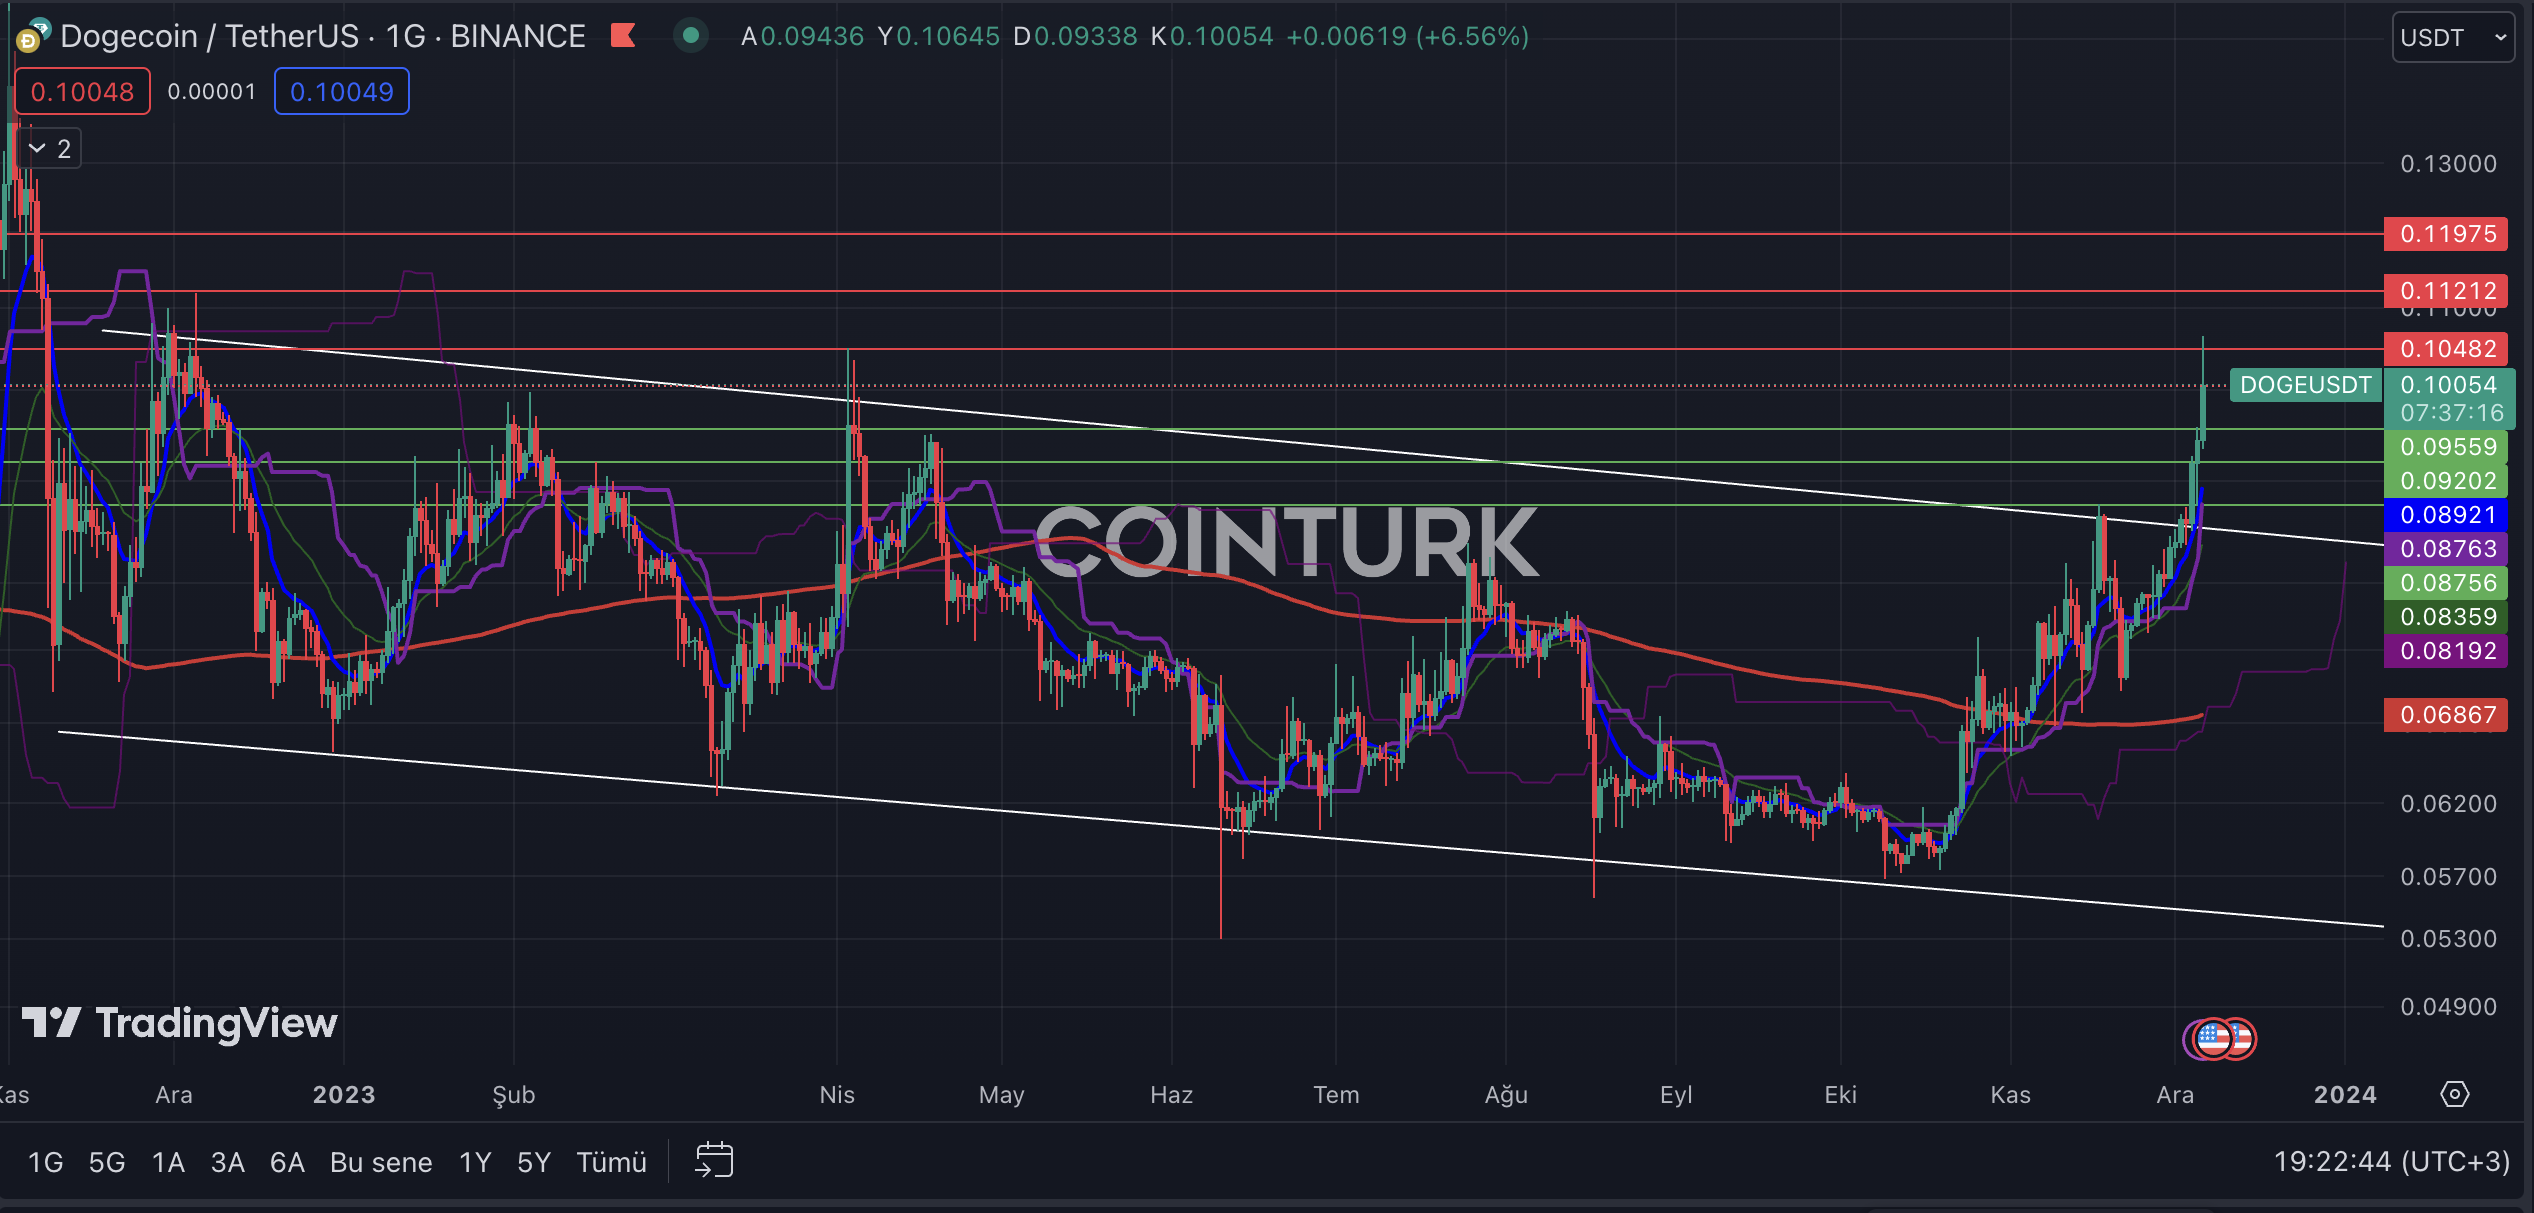
The daily DOGE chart shows that the descending channel formation structure, which has been ongoing since November 2022, was recently surpassed with the latest upward movements due to a resistance breakout. The fact that the resistance line was not retested after this momentum has created a big question mark on the DOGE front. In such breakouts, the first issue of interest to analysts is whether the price will perform a retest or not.
日次DOGEチャートは、2022年11月から続いている下降チャネル形成構造が、抵抗線のブレイクアウトによる最新の上昇動きで最近上回られたことを示しています。この勢いの後、レジスタンスラインが再テストされなかったという事実は、DOGE戦線に大きな疑問符を生み出した。このようなブレイクアウトでは、アナリストが最初に関心を持つのは、価格が再テストされるかどうかです。
The most important support levels to be followed on the DOGE daily chart are, respectively; $0.0955, $0.0920, and $0.0875. In particular, a daily bar closing below the $0.0875 level will cause the price to re-enter the formation zone and create selling pressure on the DOGE front.
DOGE 日足チャートで従うべき最も重要なサポートレベルは、それぞれ次のとおりです。 0.0955 ドル、0.0920 ドル、0.0875 ドル。特に、日足が0.0875ドルのレベルを下回って終了すると、価格はフォーメーションゾーンに再突入し、DOGEフロントに売り圧力が生じる可能性があります。
The most important resistance levels to be observed on the DOGE daily chart are, respectively; $0.1048, $0.1121, and $0.1197. Especially, a daily bar closing above the $0.1048 level, which posed a significant barrier during the last rise on December 6, will accelerate DOGE’s momentum.
DOGE 日足チャートで観察すべき最も重要な抵抗レベルは、それぞれ次のとおりです。 0.1048 ドル、0.1121 ドル、0.1197 ドル。特に、12月6日の最後の上昇時に大きな障壁となった0.1048ドルのレベルを超えて日足が終了すると、DOGEの勢いは加速するだろう。

DOGE/ETH Chart Analysis
DOGE/ETHチャート分析
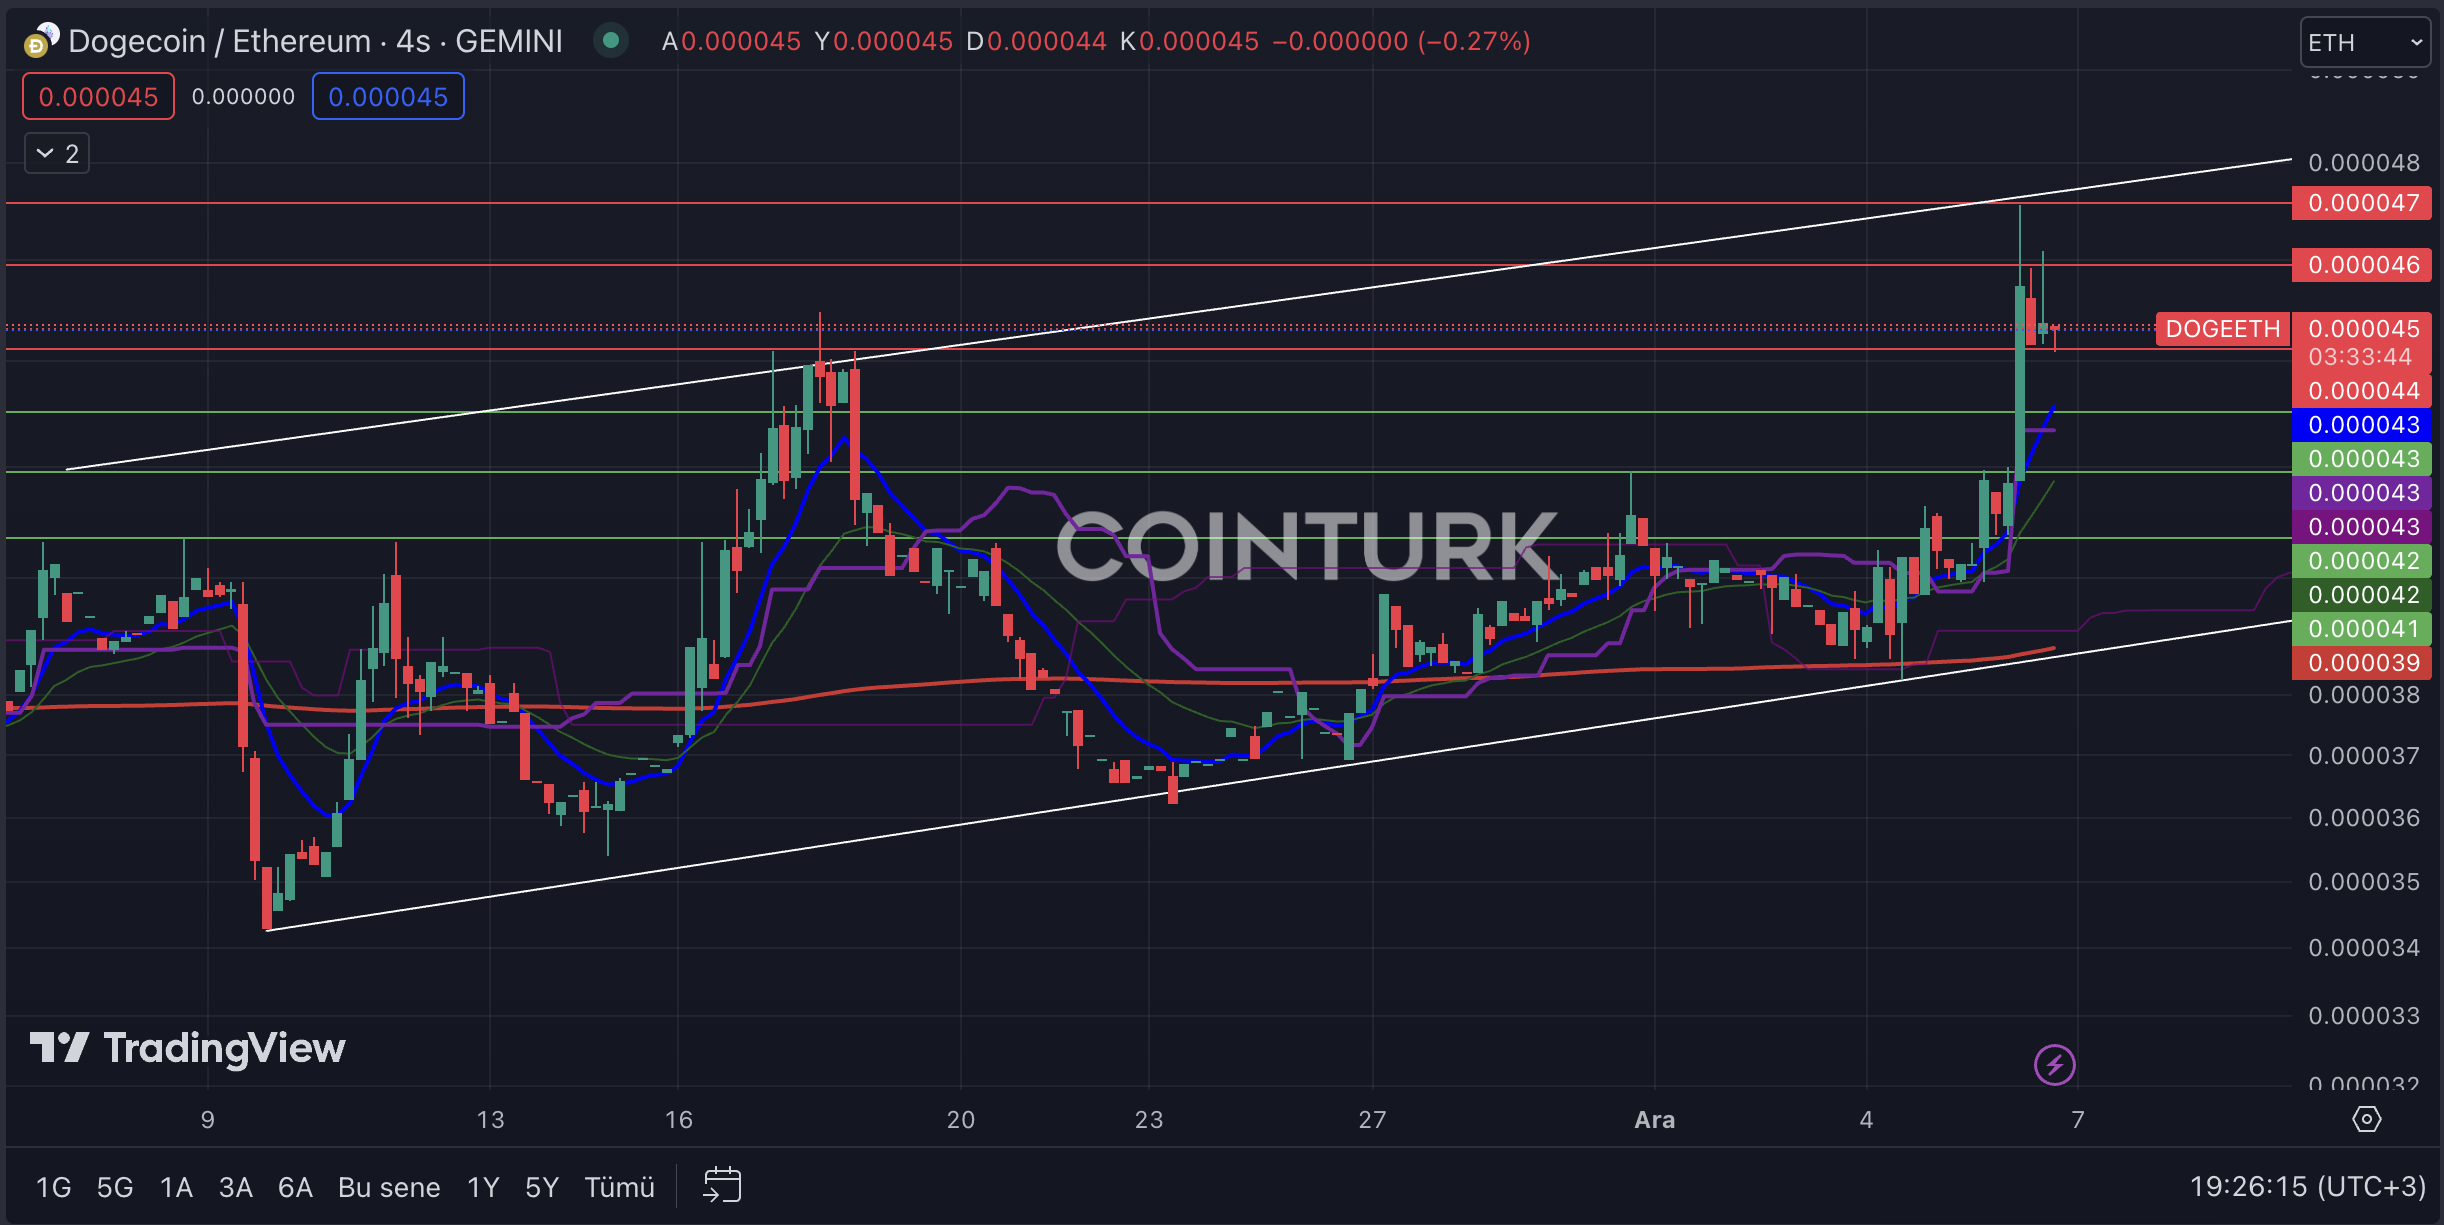
The first noticeable formation structure in the daily DOGE/ETH chart is the ascending channel formation. The lack of resistance breakout in the most recent bar formations, like the process that occurred on November 17, could lead to significant selling pressure.
日次DOGE/ETHチャートで最初に注目すべき形成構造は、上昇チャネル形成です。 11月17日に発生したプロセスのような、直近の足形成における抵抗線のブレイクアウトが欠如している場合、大きな売り圧力につながる可能性がある。
The most important support levels to be monitored on the daily DOGE/ETH chart are, respectively; 0.000041, 0.000042, and 0.000043. In particular, a daily bar closing below the 0.000043 level, which intersects with the EMA 7 (blue line), will cause Dogecoin to lose value against Ethereum.
毎日のDOGE/ETHチャートで監視すべき最も重要なサポートレベルは、それぞれ次のとおりです。 0.000041、0.000042、0.000043。特に、日足がEMA 7(青い線)と交差する0.000043レベルを下回って終了すると、ドージコインはイーサリアムに対して価値を失うことになります。
The most important resistance levels to be considered on the DOGE/ETH chart are, respectively; 0.0000455, 0.0000460, and 0.0000470. Especially, surpassing the 0.000047 level, which posed as a significant barrier during the last rise and intersects with the formation resistance, will accelerate DOGE’s momentum against Ethereum.
DOGE/ETH チャートで考慮すべき最も重要な抵抗レベルは、それぞれ次のとおりです。 0.0000455、0.0000460、0.0000470。特に、前回の上昇時に大きな障壁となり、形成抵抗と交差する0.000047レベルを超えると、イーサリアムに対するDOGEの勢いが加速するでしょう。

続きを読む: https://en.coin-turk.com/technical-analysis-of-the-dogecoin-market/


 BlockchainReporter
 CoinPedia News
 TheNewsCrypto
 CFN
CFN DogeHome
 Optimisus
 Crypto News Land
 Optimisus


