

Following recent weekly lows, Bitcoin and prominent alternative cryptocurrencies are observing a slight retraction, suggesting that investors might be capitalizing on the decline.
In a recent assembly on September 20, the Federal Reserve chose against elevating interest rates. However, a prolonged period of elevated rates might be on the horizon. Jerome Powell, the Fed’s Chair, underscored in the subsequent media briefing that achieving a consistent 2% inflation rate remains a distant target.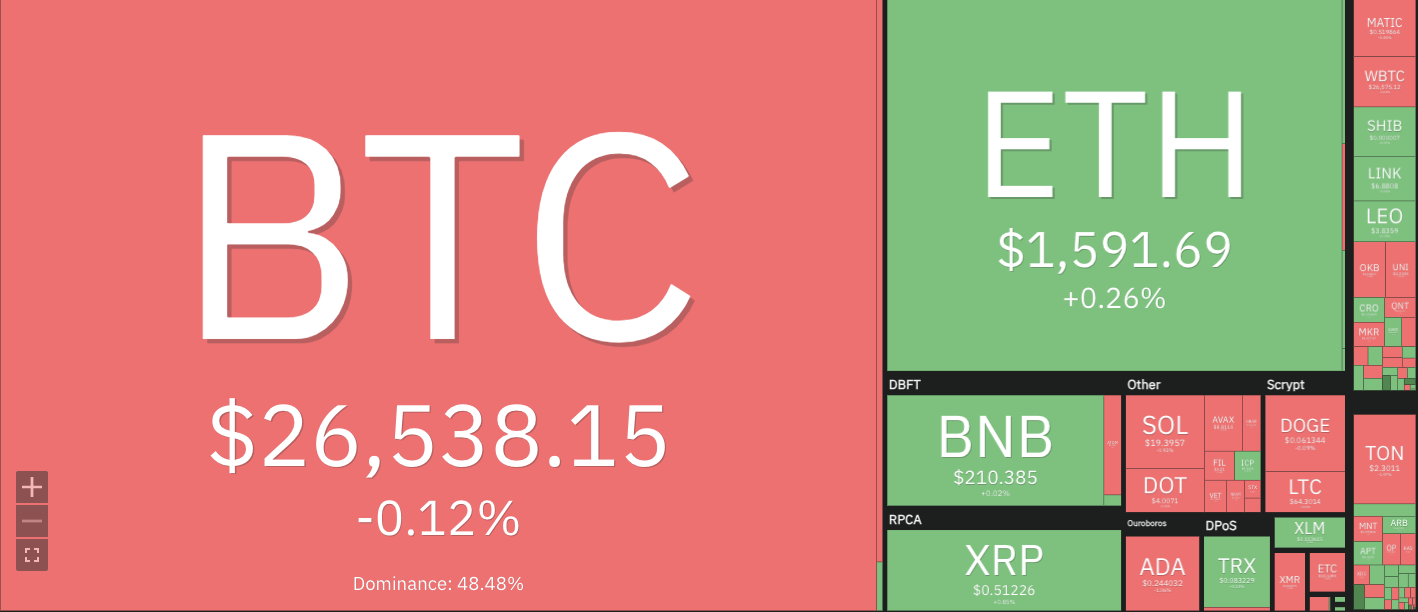
Cryptocurrencies Price Heatmap, Source: Coin360
Such indications potentially instigated the recent downtrend in the US stock market and extended to the digital currency domain. Elevated interest rates typically weigh on the performance of assets perceived as high risk.
The week saw the S&P 500 index retract by over 2%, with the Nasdaq pulling back approximately 3%. In contrast, Bitcoin’s performance remained relatively unchanged. While alternative cryptocurrencies grappled to retain the week’s gains, primarily due to heightened risk aversion, there’s a silver lining. Bitcoin and its significant counterparts maintained positions above their vital support benchmarks. The impending price trajectory will be pivotal, and expected to spotlight a fierce tug-of-war between optimistic and cautious investors.
Most of the cryptocurrencies in the past seven days have been trading in a sideways trend, with bulls and bears attempting to assert dominance. This has resulted in minor fluctuations in prices with no clear direction.
BTC/USD
Bitcoin price analysis shows that the dominant cryptocurrency has been trading in a tight range between $27,465 and $26,400 for most of the past week. This suggests that there is strong support at these levels, and any significant dips could be seen as buying opportunities by traders. BTC/USD is currently trading at $26,588, with a minimal decrease of 0.4% in the past 24 hours; however, in the past 7 days, it has recorded a modest 0.86% gain.
The support level for BTC/USD is seen at $26,400, while the resistance level remains at $27,465. If the price breaks above this resistance level, a retest of the key psychological level of $28,000 could be on the cards. However, if the support level is breached, we could see a dip towards the $26,000 region.
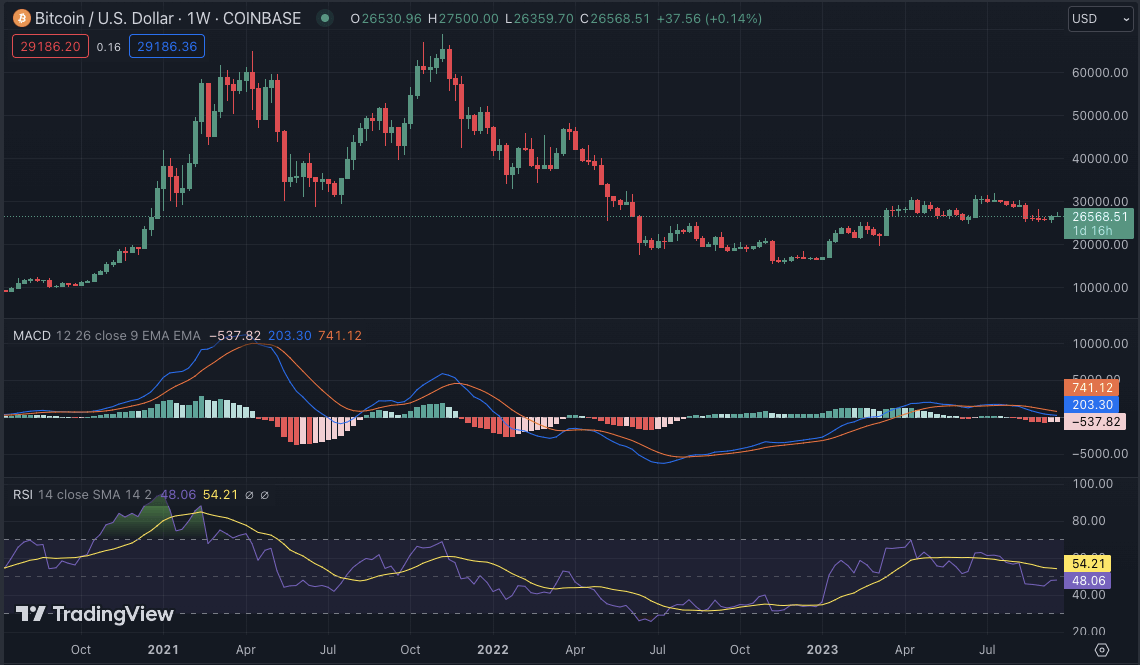
The technical indicators in the past few days have been in neutral territory, suggesting that the market is in a state of indecision. The MACD indicator is hovering around the zero line, while the RSI has been ranging between 40 and 50. The 50-EMA is currently acting as a support level, indicating that the bulls may have the upper hand in the short term.
ETH/USD
Ethereum price analysis shows that the second-largest cryptocurrency has successfully broken below the key support level of $1,600. The bears have been successful in pushing the price towards a low of $1,570. However, ETH/USD has managed to bounce back and is currently trading at $1,594, with an increase of 0.36% in the past 24 hours. In the past week, ETH/USD has recorded a minor loss of 1.73%. The bulls and bears are currently in a tug-of-war at this level and the outcome of this battle could determine the short-term price trajectory.
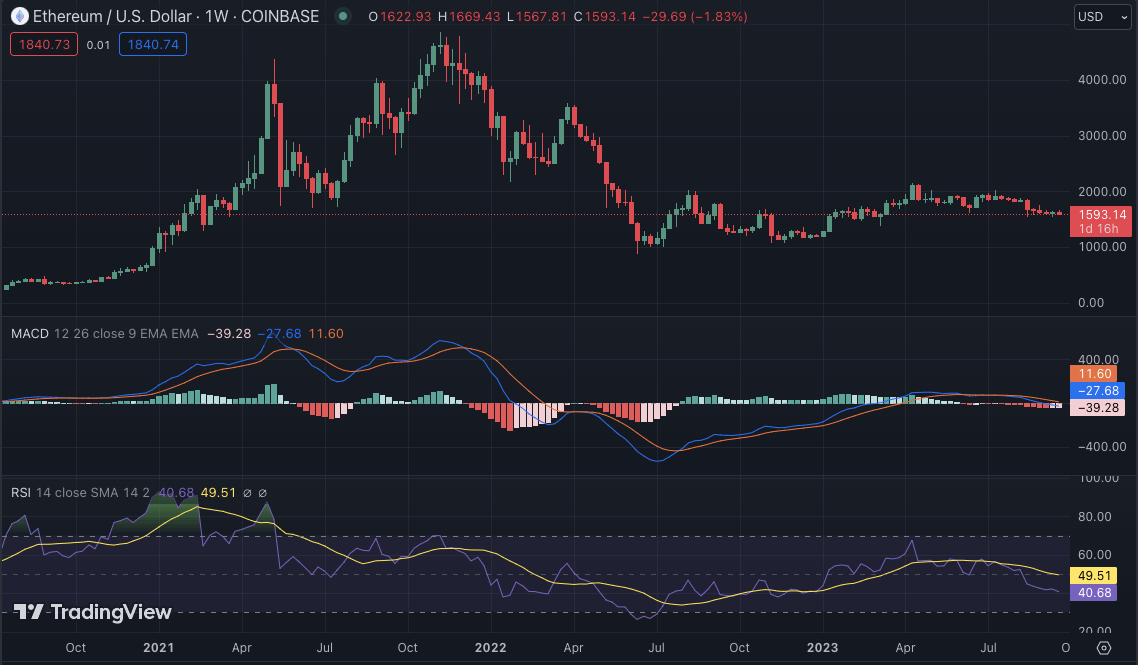
The support level for ETH/USD is seen at $1,570, while the resistance level remains at $1,620. If the bulls manage to break above this resistance level, ETH/USD could see a retest of the $1,650 level. However, if the bears take control and break below the support level, we could see a dip towards the next key support level at $1,500.
The technical indicators for ETH/USD also indicate indecision in the market. The 20-SMA and 50-EMA are both trending below the price, suggesting bearish pressure. However, the RSI is hovering around 40, indicating a balance between buying and selling pressure. The MACD indicator shows signs of a neutral crossover, which could indicate a potential reversal in the short term.
BNB/USD
Binance Coin (BNB) price analysis shows that the fourth-largest cryptocurrency has been trading in a tight range between $221 and $208 for most of the past week. This suggests that there is strong support at these levels, and any significant dips could be seen as buying opportunities by traders. BNB/USD is currently trading at $210, with a decrease of 0.09% in the past 24 hours. In the past week, BNB/USD has recorded a modest loss of 1.04%.
On 18th September, BNB touched a weekly high of $221.6 but failed to sustain the bullish momentum, falling back towards the $210 level. The support level for BNB/USD is seen at $200, while the resistance level remains at $221. If the bulls manage to break above this resistance level, a retest of the key psychological level of $230 could be on the cards. However, if the bears take control and break below the support level, the next key support at $200.
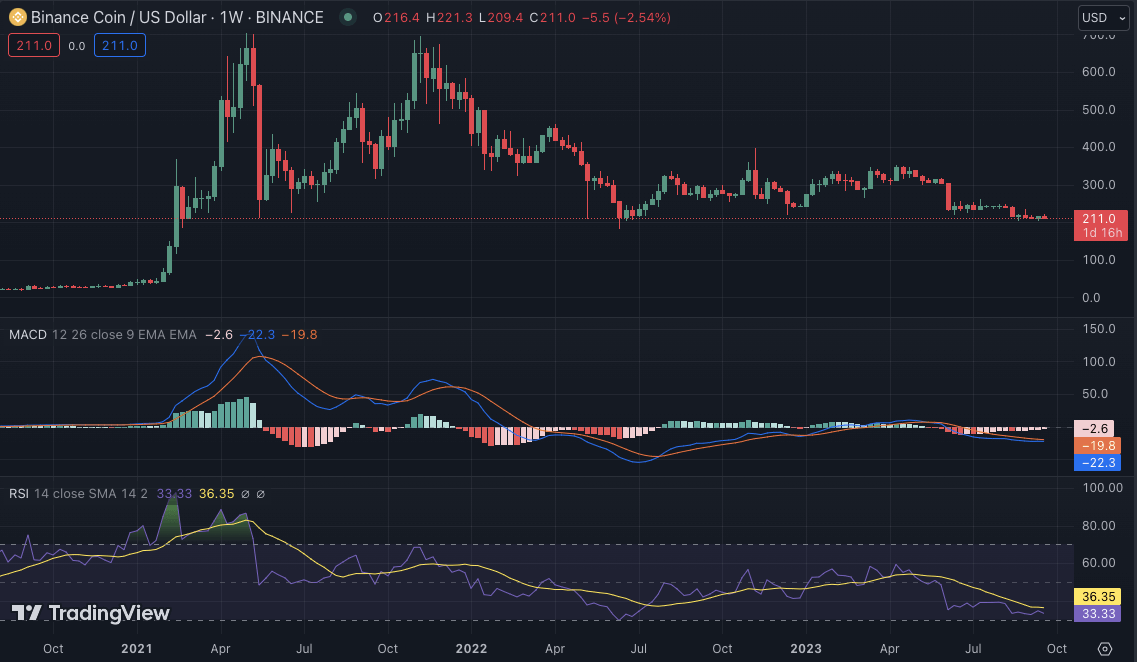
The technical indicators for BNB/USD also suggest neutral sentiment in the market. The 20-SMA is slightly above the price and acting as a resistance level, while the 50-EMA is trending below, indicating bearish pressure. The MACD indicator is hovering around the zero line, and the RSI is showing the balance between buying and selling pressure.
XRP/USD
XRP has been trading below the $0.52 level for most of this week, with bears and bulls locked in a battle. The weekly high was seen at $0.5235 on 21st September and touched a low of $0.4896 on 18th September. The bulls have been gaining the upper hand in the past 24 hours, with XRP/USD currently trading at $0.515, recording a modest increase of 1.28% and a 7-day loss of 3.67%.
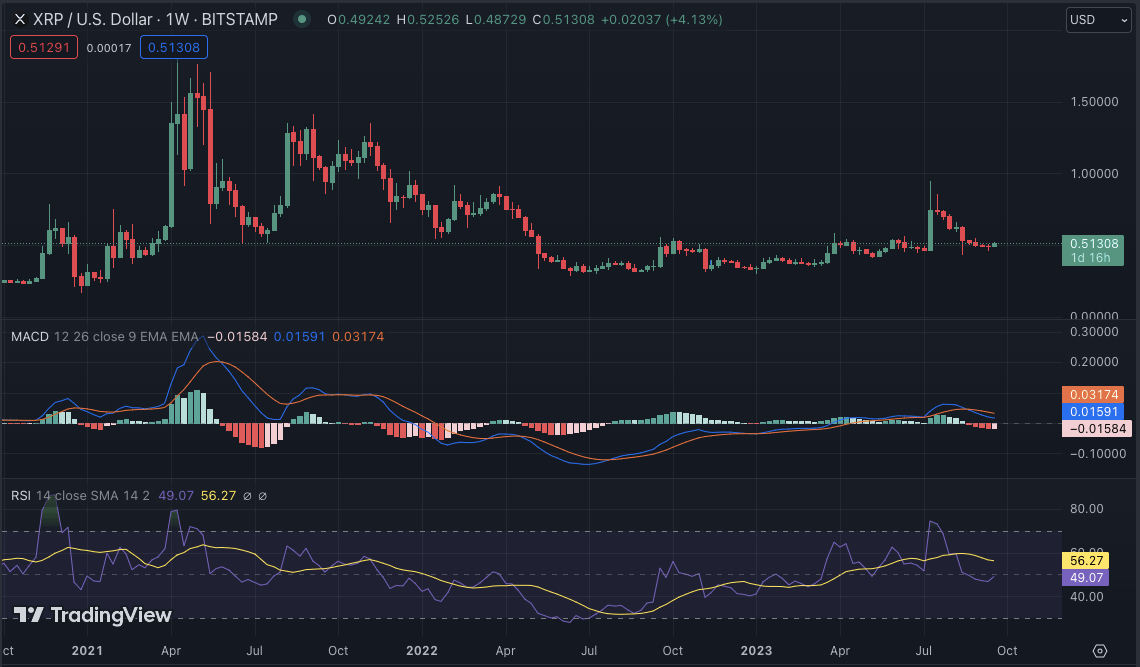
The moving averages for XRP/USD indicate a bullish trend, with the 20-EMA trending above the 50-SMA. The MACD indicator has also turned bullish, indicating a potential crossover in the short term. The RSI is hovering above the 40.00 level, showing buying momentum. The support level for XRP/USD is seen at $0.48, while the resistance level remains at $0.52.
DOGE/USD
Dogecoin price analysis shows that the meme-inspired cryptocurrency has maintained its position above the key support level of $0.0600 this week, with minor fluctuations in prices. DOGE/USD is currently trading at $0.06145, recording a loss of 0.04% in the past 24 hours and a 7-day loss of 0.92%. The bears have been in control in the past few days, and if momentum continues, DOGE/USD could see a dip towards the support at $0.05800.
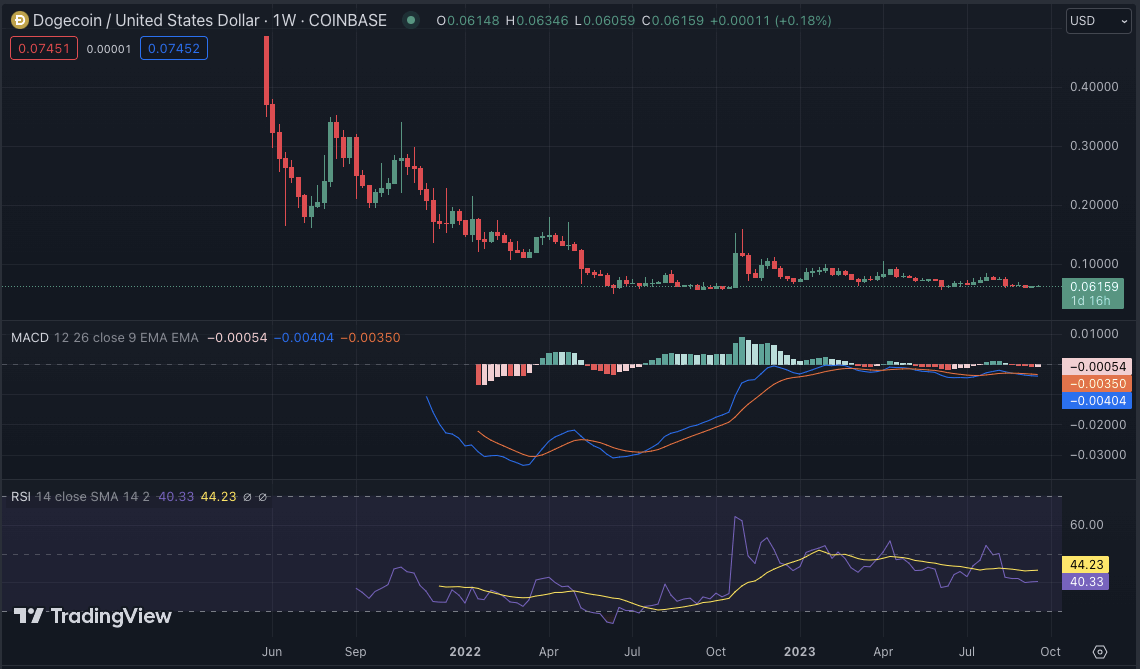
The technical indicators for DOGE/USD show that the 20-SMA is acting as a resistance level, with the 50-EMA trending below, indicating bearish pressure. The MACD indicator has also turned bearish, suggesting a potential crossover in the short term. The RSI is hovering around the 40.00 level, indicating a balance between buying and selling pressure.
LTC/USD
Litecoin price analysis shows that LTC has been trading in a tight range between $63.30 and $68.00 for the past week. The sideways movement suggests indecision in the market, with neither bulls nor bears taking control. The bulls and bears have been in a tug-of-war near the key support level of $65.00, with LTC/USD currently trading at $66.33, recording an increase of 0.33% in the past 24 hours and a 7-day loss of 0.95%.
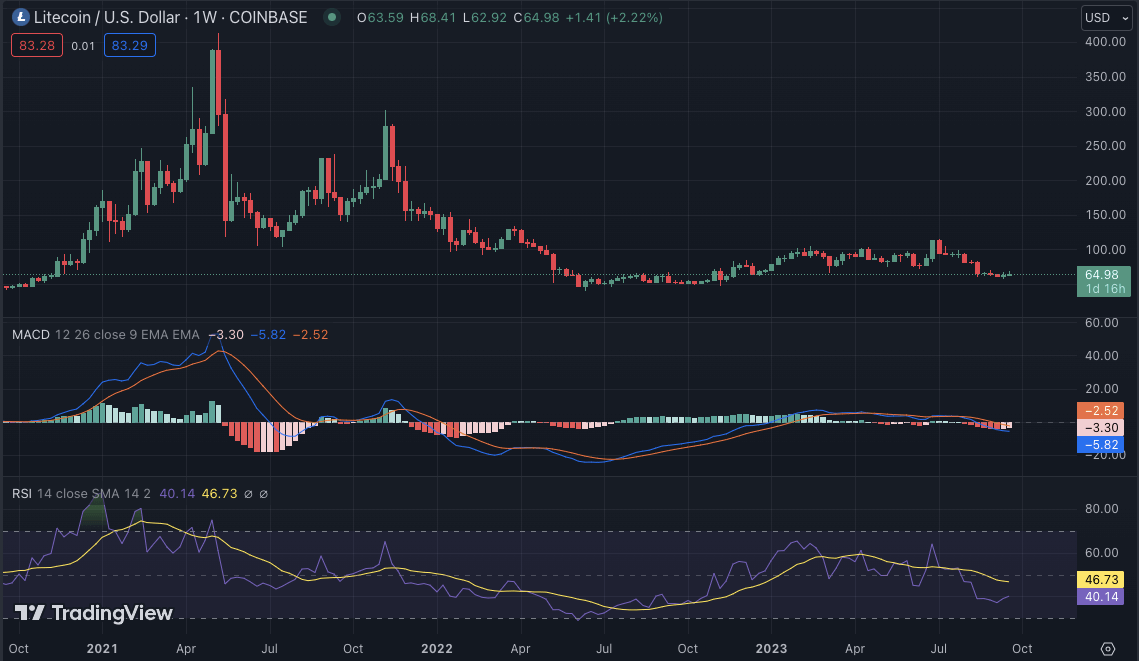
The technical indicators for LTC/USD are currently in neutral territory, with the moving averages closely tracking the price and the MACD indicator hovering around the zero line. The RSI is also ranging between 40 and 50, indicating indecision in the market. The 20-EMA is currently below the price and acting as a support level, while the 50-SMA is above, suggesting potential resistance.
Weekly Crypto Analysis Conclusion
Overall, the crypto market is in a period of consolidation, with most coins trading within range-bound conditions. The bullish and bearish divergences being seen on many coins indicate that there is a tug-of-war occurring between the bulls and bears. In the near term, it is likely that some coins will break out of their current levels and begin to rally higher, while others might drop lower.
 CFN
CFN U_Today
 Thecoinrepublic.com
 DogeHome
 Optimisus
 Optimisus
 DeFi Planet
 Crypto Daily™
 BlockchainReporter


