

Following recent weekly lows, Bitcoin and prominent alternative cryptocurrencies are observing a slight retraction, suggesting that investors might be capitalizing on the decline.
最近の週間安値を受けて、ビットコインと著名な代替仮想通貨は若干の反発を観察しており、投資家が下落を利用している可能性があることを示唆している。
In a recent assembly on September 20, the Federal Reserve chose against elevating interest rates. However, a prolonged period of elevated rates might be on the horizon. Jerome Powell, the Fed’s Chair, underscored in the subsequent media briefing that achieving a consistent 2% inflation rate remains a distant target.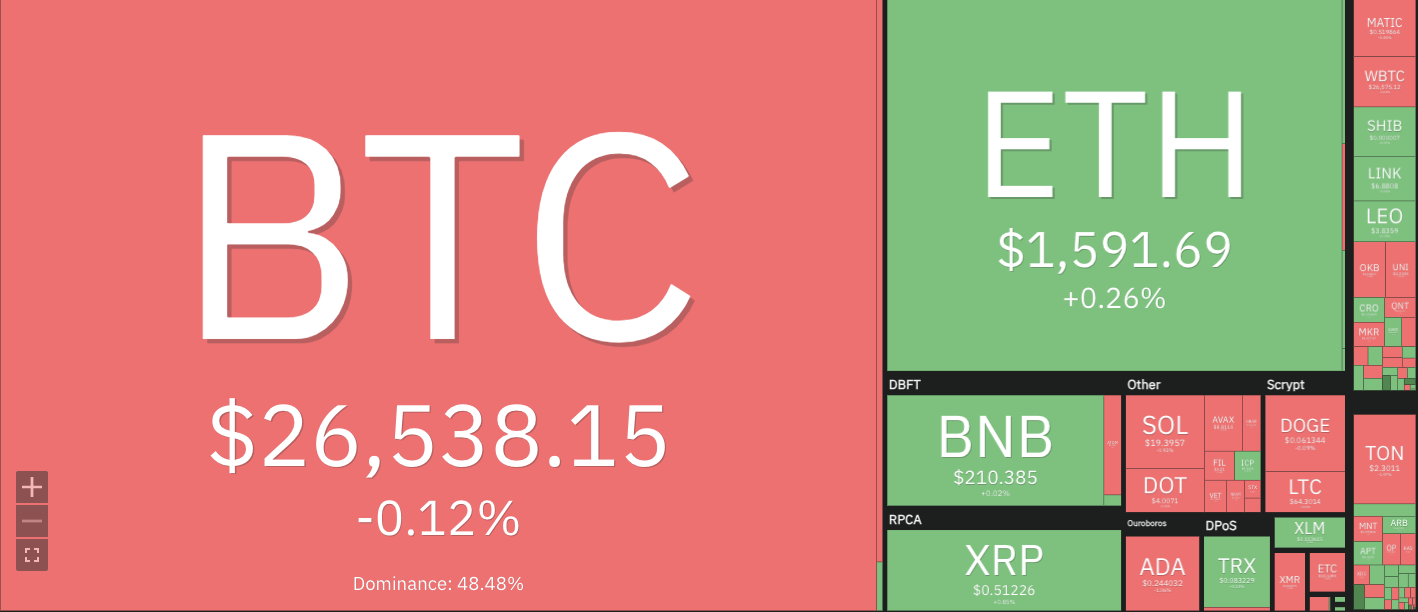
9月20日の最近の議会で、FRBは金利引き上げを見送った。しかし、長期にわたる金利上昇が予想される。 FRBのジェローム・パウエル議長はその後の記者会見で、一貫した2%のインフレ率の達成は依然として遠い目標であると強調した。
Cryptocurrencies Price Heatmap, Source: Coin360
暗号通貨価格ヒートマップ、出典: Coin360
Such indications potentially instigated the recent downtrend in the US stock market and extended to the digital currency domain. Elevated interest rates typically weigh on the performance of assets perceived as high risk.
このような兆候は、米国株式市場の最近の下落傾向を潜在的に引き起こし、デジタル通貨の領域にも拡大した。金利の上昇は通常、リスクが高いとみなされる資産のパフォーマンスを圧迫します。
The week saw the S&P 500 index retract by over 2%, with the Nasdaq pulling back approximately 3%. In contrast, Bitcoin’s performance remained relatively unchanged. While alternative cryptocurrencies grappled to retain the week’s gains, primarily due to heightened risk aversion, there’s a silver lining. Bitcoin and its significant counterparts maintained positions above their vital support benchmarks. The impending price trajectory will be pivotal, and expected to spotlight a fierce tug-of-war between optimistic and cautious investors.
今週はS&P500指数が2%以上下落し、ナスダックは約3%下落した。対照的に、ビットコインのパフォーマンスは比較的変化しませんでした。代替仮想通貨は主にリスク回避の高まりにより今週の上昇を維持しようと奮闘したが、希望の兆しもある。ビットコインとその重要な対応物は、重要なサポートベンチマークを上回る位置を維持しました。差し迫った価格の軌道は極めて重要であり、楽観的な投資家と慎重な投資家の間での激しい綱引きに注目が集まることが予想される。
Most of the cryptocurrencies in the past seven days have been trading in a sideways trend, with bulls and bears attempting to assert dominance. This has resulted in minor fluctuations in prices with no clear direction.
過去7日間の仮想通貨のほとんどは横ばいの傾向で取引されており、強気派と弱気派が優位性を主張しようとしている。これにより、価格には明確な方向性のない小さな変動が生じています。
BTC/USD
BTC/USD
Bitcoin price analysis shows that the dominant cryptocurrency has been trading in a tight range between $27,465 and $26,400 for most of the past week. This suggests that there is strong support at these levels, and any significant dips could be seen as buying opportunities by traders. BTC/USD is currently trading at $26,588, with a minimal decrease of 0.4% in the past 24 hours; however, in the past 7 days, it has recorded a modest 0.86% gain.
ビットコインの価格分析によると、この主要な仮想通貨は過去 1 週間のほとんどの間、27,465 ドルから 26,400 ドルの間の狭い範囲で取引されています。これは、これらのレベルに強力なサポートがあることを示唆しており、トレーダーにとって大幅な下落は買いの機会とみなされる可能性があります。 BTC/USD は現在 26,588 ドルで取引されており、過去 24 時間で最小の下落率は 0.4% でした。ただし、過去 7 日間では 0.86% の小幅な上昇を記録しました。
The support level for BTC/USD is seen at $26,400, while the resistance level remains at $27,465. If the price breaks above this resistance level, a retest of the key psychological level of $28,000 could be on the cards. However, if the support level is breached, we could see a dip towards the $26,000 region.
BTC/USDのサポートレベルは26,400ドルとみられていますが、レジスタンスレベルは27,465ドルのままです。価格がこのレジスタンスレベルを超えた場合、主要な心理的レベルである28,000ドルが再試される可能性があります。ただし、サポートレベルを突破した場合は、26,000ドルの領域に向けて下落する可能性があります。
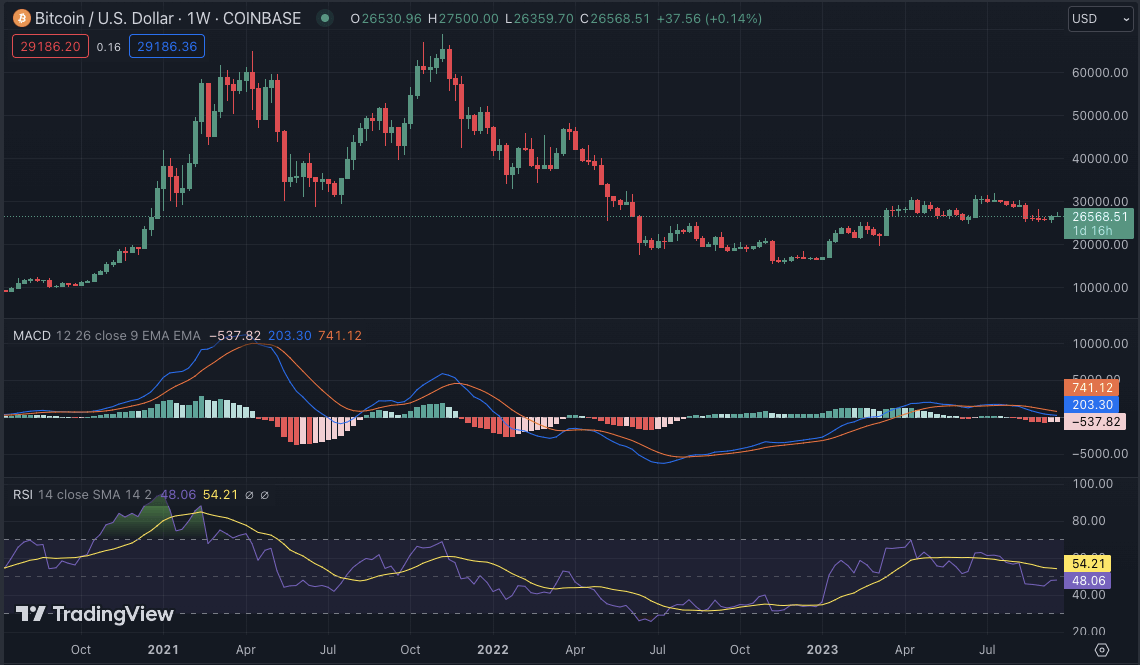
The technical indicators in the past few days have been in neutral territory, suggesting that the market is in a state of indecision. The MACD indicator is hovering around the zero line, while the RSI has been ranging between 40 and 50. The 50-EMA is currently acting as a support level, indicating that the bulls may have the upper hand in the short term.
ここ数日間のテクニカル指標は中立領域にあり、市場が優柔不断な状態にあることを示唆している。 MACD 指標はゼロライン付近で推移していますが、RSI は 40 ~ 50 の範囲で推移しています。現在 50-EMA がサポートレベルとして機能しており、短期的には強気派が優勢である可能性があることを示しています。
ETH/USD
ETH/米ドル
Ethereum price analysis shows that the second-largest cryptocurrency has successfully broken below the key support level of $1,600. The bears have been successful in pushing the price towards a low of $1,570. However, ETH/USD has managed to bounce back and is currently trading at $1,594, with an increase of 0.36% in the past 24 hours. In the past week, ETH/USD has recorded a minor loss of 1.73%. The bulls and bears are currently in a tug-of-war at this level and the outcome of this battle could determine the short-term price trajectory.
イーサリアムの価格分析では、2番目に大きい仮想通貨が主要サポートレベルである1,600ドルを下回ることに成功したことが示されている。弱気派は価格を1,570ドルの安値に向けて押し上げることに成功した。しかし、ETH/USDは何とか反発し、現在は過去24時間で0.36%上昇し、1,594ドルで取引されています。過去 1 週間で、ETH/USD は 1.73% というわずかな損失を記録しました。現在、強気派と弱気派はこの水準で綱引きをしており、この戦いの結果が短期的な価格の軌道を決定する可能性がある。
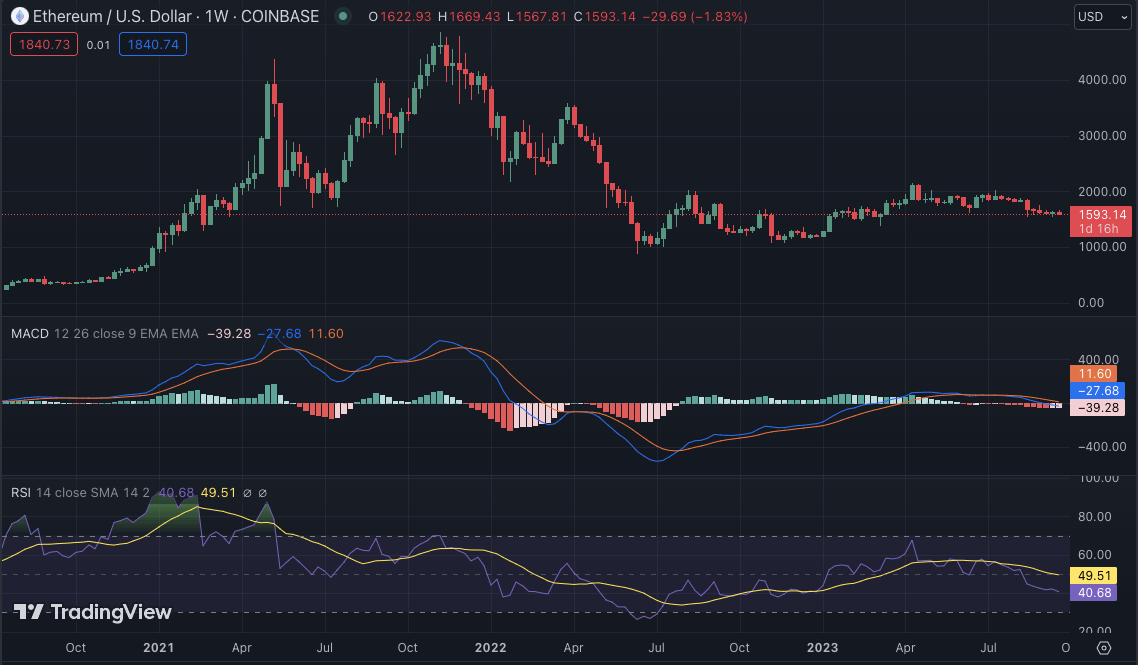
The support level for ETH/USD is seen at $1,570, while the resistance level remains at $1,620. If the bulls manage to break above this resistance level, ETH/USD could see a retest of the $1,650 level. However, if the bears take control and break below the support level, we could see a dip towards the next key support level at $1,500.
ETH/USDのサポートレベルは1,570ドルと見られていますが、レジスタンスレベルは依然として1,620ドルです。強気派がこのレジスタンスレベルをなんとか突破できれば、ETH/USDは1,650ドルのレベルを再び試す可能性がある。しかし、弱気派が主導権を握ってサポートレベルを下回った場合、次の重要なサポートレベルである1,500ドルに向けての下落が見られる可能性があります。
The technical indicators for ETH/USD also indicate indecision in the market. The 20-SMA and 50-EMA are both trending below the price, suggesting bearish pressure. However, the RSI is hovering around 40, indicating a balance between buying and selling pressure. The MACD indicator shows signs of a neutral crossover, which could indicate a potential reversal in the short term.
ETH/USDのテクニカル指標も市場の優柔不断さを示しています。 20-SMA と 50-EMA は両方とも価格を下回る傾向にあり、弱気圧力を示唆しています。しかし、RSIは40付近で推移しており、買い圧力と売り圧力のバランスが取れていることを示している。 MACD 指標はニュートラルクロスオーバーの兆候を示しており、短期的に反転する可能性があることを示しています。
BNB/USD
BNB/USD
Binance Coin (BNB) price analysis shows that the fourth-largest cryptocurrency has been trading in a tight range between $221 and $208 for most of the past week. This suggests that there is strong support at these levels, and any significant dips could be seen as buying opportunities by traders. BNB/USD is currently trading at $210, with a decrease of 0.09% in the past 24 hours. In the past week, BNB/USD has recorded a modest loss of 1.04%.
バイナンスコイン(BNB)の価格分析によると、4位の仮想通貨は過去1週間のほとんどの間、221ドルから208ドルの間の狭い範囲で取引されている。これは、これらのレベルに強力なサポートがあることを示唆しており、トレーダーにとって大幅な下落は買いの機会とみなされる可能性があります。 BNB/USDは現在210ドルで取引されており、過去24時間で0.09%下落した。過去 1 週間で、BNB/USD は 1.04% という小幅な下落を記録しました。
On 18th September, BNB touched a weekly high of $221.6 but failed to sustain the bullish momentum, falling back towards the $210 level. The support level for BNB/USD is seen at $200, while the resistance level remains at $221. If the bulls manage to break above this resistance level, a retest of the key psychological level of $230 could be on the cards. However, if the bears take control and break below the support level, the next key support at $200.
9月18日、BNBは週間高値221.6ドルを記録したが、強気の勢いを維持できず、210ドル水準に向けて後退した。 BNB/USD のサポートレベルは 200 ドルと見られていますが、レジスタンスレベルは引き続き 221 ドルです。強気派がこの抵抗水準をなんとか突破できれば、重要な心理的水準である230ドルを再試行する可能性がある。ただし、弱気派が主導権を握り、サポートレベルを下回った場合、次の重要なサポートは200ドルになります。
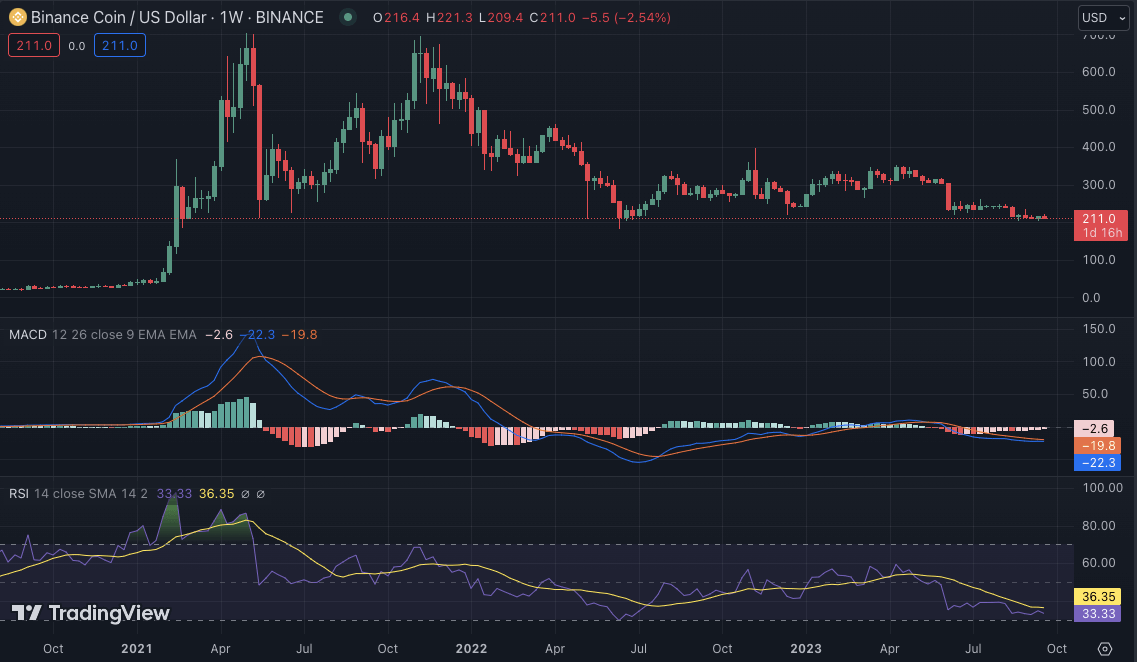
The technical indicators for BNB/USD also suggest neutral sentiment in the market. The 20-SMA is slightly above the price and acting as a resistance level, while the 50-EMA is trending below, indicating bearish pressure. The MACD indicator is hovering around the zero line, and the RSI is showing the balance between buying and selling pressure.
BNB/USD のテクニカル指標も、市場の中立的なセンチメントを示唆しています。 20-SMA は価格をわずかに上回っており、抵抗線として機能していますが、50-EMA は価格を下回る傾向にあり、弱気圧力を示しています。 MACD 指標はゼロライン付近を推移しており、RSI は買い圧力と売り圧力のバランスを示しています。
XRP/USD
XRP/米ドル
XRP has been trading below the $0.52 level for most of this week, with bears and bulls locked in a battle. The weekly high was seen at $0.5235 on 21st September and touched a low of $0.4896 on 18th September. The bulls have been gaining the upper hand in the past 24 hours, with XRP/USD currently trading at $0.515, recording a modest increase of 1.28% and a 7-day loss of 3.67%.
XRPは今週のほとんどの期間、0.52ドルの水準を下回って取引されており、弱気派と強気派が拮抗している。週間高値は9月21日の0.5235米ドルで、安値は9月18日の0.4896米ドルだった。過去24時間で強気派が優勢となり、XRP/USDは現在0.515ドルで取引されており、1.28%の小幅上昇、7日間で3.67%の下落を記録している。
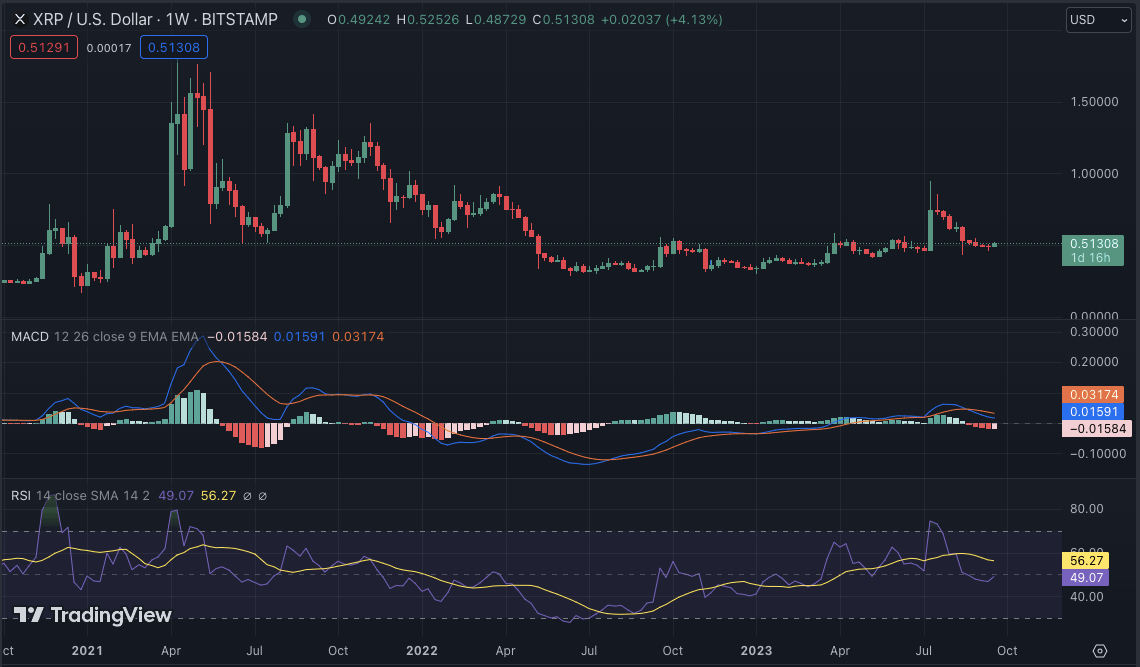
The moving averages for XRP/USD indicate a bullish trend, with the 20-EMA trending above the 50-SMA. The MACD indicator has also turned bullish, indicating a potential crossover in the short term. The RSI is hovering above the 40.00 level, showing buying momentum. The support level for XRP/USD is seen at $0.48, while the resistance level remains at $0.52.
XRP/USDの移動平均は強気傾向を示しており、20-EMAは50-SMAを上回る傾向にあります。 MACD指標も強気に転じており、短期的にクロスオーバーする可能性があることを示しています。 RSIは40.00レベルを超えて推移しており、買いの勢いがみられる。 XRP/USDのサポートレベルは0.48ドルとみられていますが、レジスタンスレベルは0.52ドルのままです。
DOGE/USD
ドージ/米ドル
Dogecoin price analysis shows that the meme-inspired cryptocurrency has maintained its position above the key support level of $0.0600 this week, with minor fluctuations in prices. DOGE/USD is currently trading at $0.06145, recording a loss of 0.04% in the past 24 hours and a 7-day loss of 0.92%. The bears have been in control in the past few days, and if momentum continues, DOGE/USD could see a dip towards the support at $0.05800.
ドージコインの価格分析によると、ミームにインスピレーションを得たこの暗号通貨は今週、価格に若干の変動はあるものの、主要なサポートレベルである0.0600ドルを上回る位置を維持していることが示された。 DOGE/USD は現在 0.06145 ドルで取引されており、過去 24 時間で 0.04% の損失、7 日間で 0.92% の損失を記録しています。ここ数日間は弱気派が主導権を握っており、この勢いが続けば、DOGE/USDは0.05800ドルのサポートに向けて下落する可能性がある。
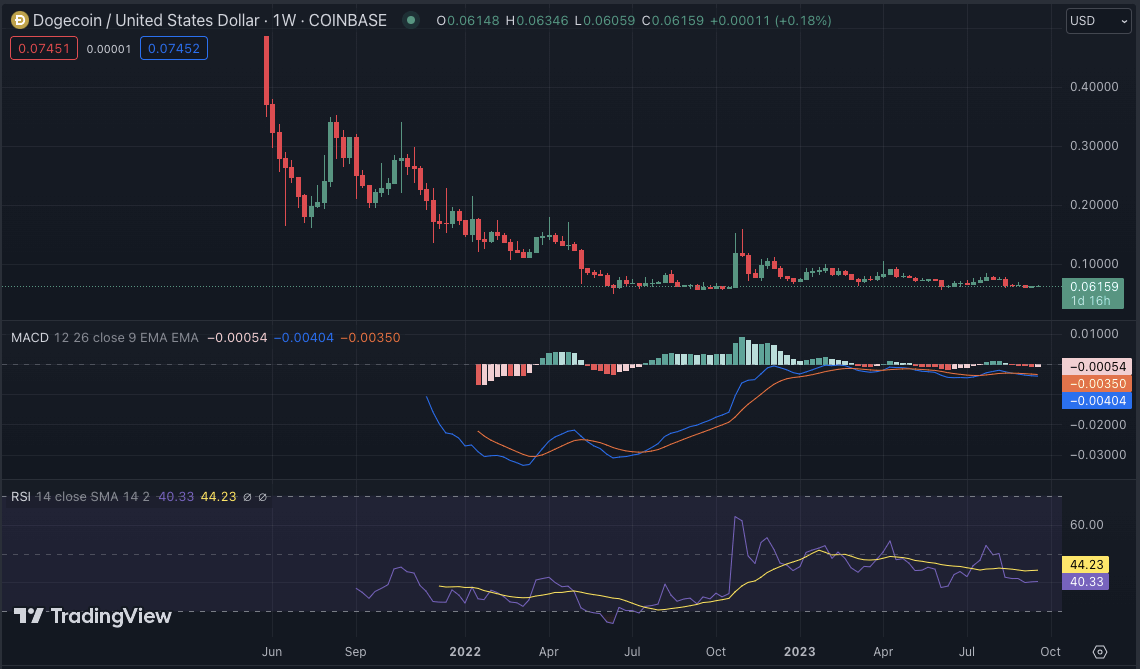
The technical indicators for DOGE/USD show that the 20-SMA is acting as a resistance level, with the 50-EMA trending below, indicating bearish pressure. The MACD indicator has also turned bearish, suggesting a potential crossover in the short term. The RSI is hovering around the 40.00 level, indicating a balance between buying and selling pressure.
DOGE/USD のテクニカル指標は、20-SMA が抵抗線として機能し、50-EMA が下降傾向にあることを示しており、弱気圧力を示しています。 MACD指標も弱気に転じており、短期的にはクロスオーバーの可能性があることを示唆しています。 RSIは40.00レベル付近で推移しており、買い圧力と売り圧力のバランスが取れていることを示している。
LTC/USD
LTC/米ドル
Litecoin price analysis shows that LTC has been trading in a tight range between $63.30 and $68.00 for the past week. The sideways movement suggests indecision in the market, with neither bulls nor bears taking control. The bulls and bears have been in a tug-of-war near the key support level of $65.00, with LTC/USD currently trading at $66.33, recording an increase of 0.33% in the past 24 hours and a 7-day loss of 0.95%.
ライトコインの価格分析によると、LTCは過去1週間、63.30ドルから68.00ドルの間の狭い範囲で取引されている。横ばいの動きは、強気派も弱気派も主導権を握っておらず、市場が優柔不断であることを示唆している。強気派と弱気派は主要なサポートレベルである65.00ドル付近で綱引きをしており、LTC/USDは現在66.33ドルで取引されており、過去24時間で0.33%の上昇、7日間で0.95%の下落を記録している。 。
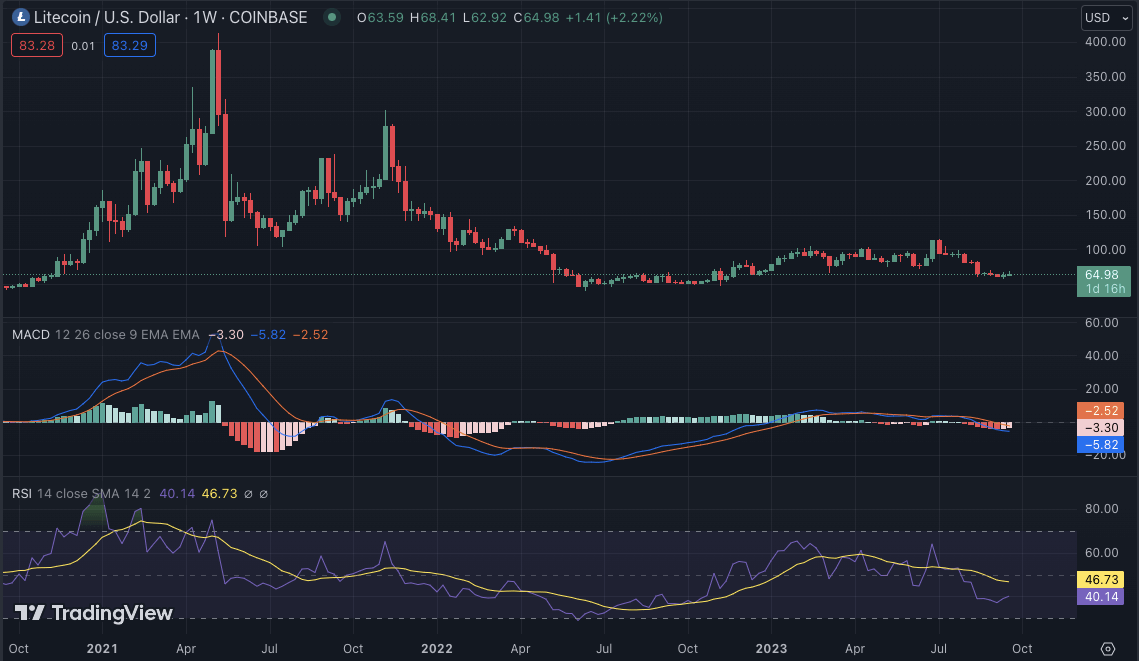
The technical indicators for LTC/USD are currently in neutral territory, with the moving averages closely tracking the price and the MACD indicator hovering around the zero line. The RSI is also ranging between 40 and 50, indicating indecision in the market. The 20-EMA is currently below the price and acting as a support level, while the 50-SMA is above, suggesting potential resistance.
LTC/USD のテクニカル指標は現在中立領域にあり、移動平均は価格を厳密に追跡し、MACD 指標はゼロライン付近を推移しています。 RSIも40から50の範囲で推移しており、市場が優柔不断であることを示している。 20-EMAは現在価格を下回っており、サポートレベルとして機能していますが、50-SMAは上にあり、潜在的な抵抗線であることを示唆しています。
Weekly Crypto Analysis Conclusion
週刊暗号分析の結論
Overall, the crypto market is in a period of consolidation, with most coins trading within range-bound conditions. The bullish and bearish divergences being seen on many coins indicate that there is a tug-of-war occurring between the bulls and bears. In the near term, it is likely that some coins will break out of their current levels and begin to rally higher, while others might drop lower.
全体として、暗号通貨市場は統合の時期にあり、ほとんどのコインはレンジ内で取引されています。多くのコインに見られる強気派と弱気派の乖離は、強気派と弱気派の間で綱引きが起こっていることを示しています。短期的には、一部のコインが現在のレベルを抜け出して上昇し始める可能性が高く、一方で、他のコインは下落する可能性があります。
 CFN
CFN U_Today
 Thecoinrepublic.com
 DogeHome
 Optimisus
 Optimisus
 DeFi Planet
 Crypto Daily™
 BlockchainReporter


