

Following recent weekly lows, Bitcoin and prominent alternative cryptocurrencies are observing a slight retraction, suggesting that investors might be capitalizing on the decline.
在最近的每周低点之后,比特币和著名的替代加密货币正在观察小幅回落,这表明投资者可能正在利用下跌的机会。
In a recent assembly on September 20, the Federal Reserve chose against elevating interest rates. However, a prolonged period of elevated rates might be on the horizon. Jerome Powell, the Fed’s Chair, underscored in the subsequent media briefing that achieving a consistent 2% inflation rate remains a distant target.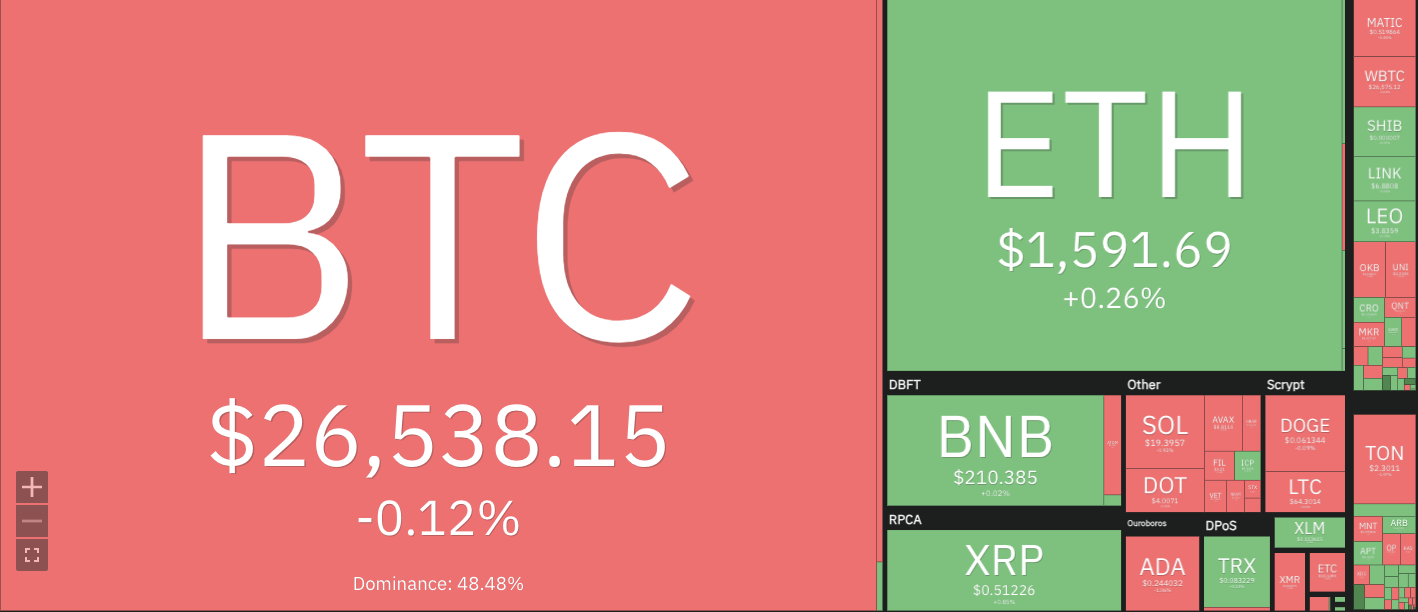
在 9 月 20 日的最近一次会议上,美联储选择不加息。然而,长期的高利率可能即将到来。美联储主席杰罗姆·鲍威尔在随后的媒体吹风会上强调,实现2%的通胀率始终是一个遥远的目标。
Cryptocurrencies Price Heatmap, Source: Coin360
加密货币价格热图,来源:Coin360
Such indications potentially instigated the recent downtrend in the US stock market and extended to the digital currency domain. Elevated interest rates typically weigh on the performance of assets perceived as high risk.
这些迹象可能会引发近期美国股市的下跌趋势,并延伸到数字货币领域。利率上升通常会影响被视为高风险的资产的表现。
The week saw the S&P 500 index retract by over 2%, with the Nasdaq pulling back approximately 3%. In contrast, Bitcoin’s performance remained relatively unchanged. While alternative cryptocurrencies grappled to retain the week’s gains, primarily due to heightened risk aversion, there’s a silver lining. Bitcoin and its significant counterparts maintained positions above their vital support benchmarks. The impending price trajectory will be pivotal, and expected to spotlight a fierce tug-of-war between optimistic and cautious investors.
本周标普 500 指数下跌超过 2%,纳斯达克指数下跌约 3%。相比之下,比特币的表现相对保持不变。虽然主要由于避险情绪加剧,其他加密货币努力保住本周的涨幅,但也有一线希望。比特币及其重要同行的头寸维持在其重要支撑基准之上。即将到来的价格轨迹将至关重要,预计将引发乐观和谨慎投资者之间的激烈拉锯战。
Most of the cryptocurrencies in the past seven days have been trading in a sideways trend, with bulls and bears attempting to assert dominance. This has resulted in minor fluctuations in prices with no clear direction.
过去 7 天,大多数加密货币一直处于横盘趋势,多头和空头试图占据主导地位。这导致价格小幅波动,没有明确的方向。
BTC/USD
比特币/美元
Bitcoin price analysis shows that the dominant cryptocurrency has been trading in a tight range between $27,465 and $26,400 for most of the past week. This suggests that there is strong support at these levels, and any significant dips could be seen as buying opportunities by traders. BTC/USD is currently trading at $26,588, with a minimal decrease of 0.4% in the past 24 hours; however, in the past 7 days, it has recorded a modest 0.86% gain.
比特币价格分析显示,过去一周的大部分时间里,主流加密货币一直在 27,465 美元至 26,400 美元之间窄幅波动。这表明这些水平有强大的支撑,任何大幅下跌都可能被交易者视为买入机会。 BTC/USD目前交易价格为26,588美元,过去24小时内最小跌幅为0.4%;然而,在过去 7 天里,它录得小幅上涨 0.86%。
The support level for BTC/USD is seen at $26,400, while the resistance level remains at $27,465. If the price breaks above this resistance level, a retest of the key psychological level of $28,000 could be on the cards. However, if the support level is breached, we could see a dip towards the $26,000 region.
BTC/USD 的支撑位为 26,400 美元,阻力位仍为 27,465 美元。如果价格突破这一阻力位,则可能会重新测试 28,000 美元的关键心理水平。然而,如果支撑位被突破,我们可能会看到价格跌向 26,000 美元区域。
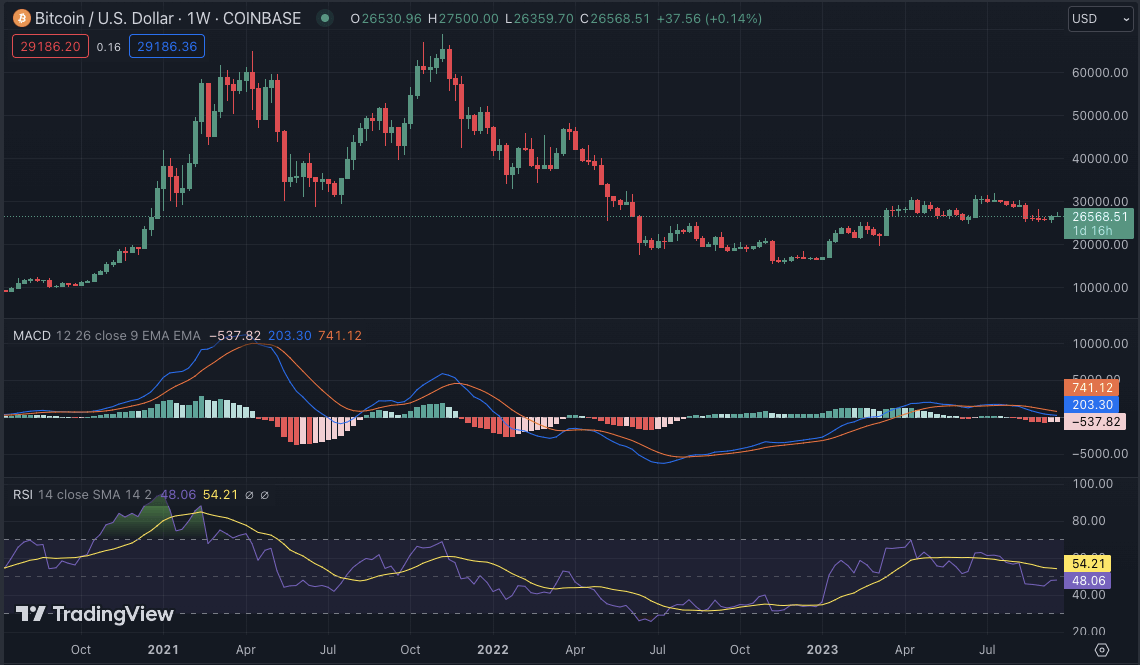
The technical indicators in the past few days have been in neutral territory, suggesting that the market is in a state of indecision. The MACD indicator is hovering around the zero line, while the RSI has been ranging between 40 and 50. The 50-EMA is currently acting as a support level, indicating that the bulls may have the upper hand in the short term.
过去几天的技术指标一直处于中性区域,表明市场处于犹豫不决的状态。 MACD指标徘徊在零线附近,RSI则一直在40至50之间徘徊。50日均线目前充当支撑位,表明多头短期内可能占据上风。
ETH/USD
以太坊/美元
Ethereum price analysis shows that the second-largest cryptocurrency has successfully broken below the key support level of $1,600. The bears have been successful in pushing the price towards a low of $1,570. However, ETH/USD has managed to bounce back and is currently trading at $1,594, with an increase of 0.36% in the past 24 hours. In the past week, ETH/USD has recorded a minor loss of 1.73%. The bulls and bears are currently in a tug-of-war at this level and the outcome of this battle could determine the short-term price trajectory.
以太坊价格分析显示,第二大加密货币已成功跌破 1,600 美元的关键支撑位。空头成功地将价格推向 1,570 美元的低点。不过,ETH/USD 已成功反弹,目前交投于 1,594 美元,过去 24 小时内上涨 0.36%。过去一周,ETH/美元小幅下跌 1.73%。多头和空头目前正在这一水平上展开拉锯战,这场战斗的结果可能决定短期价格走势。
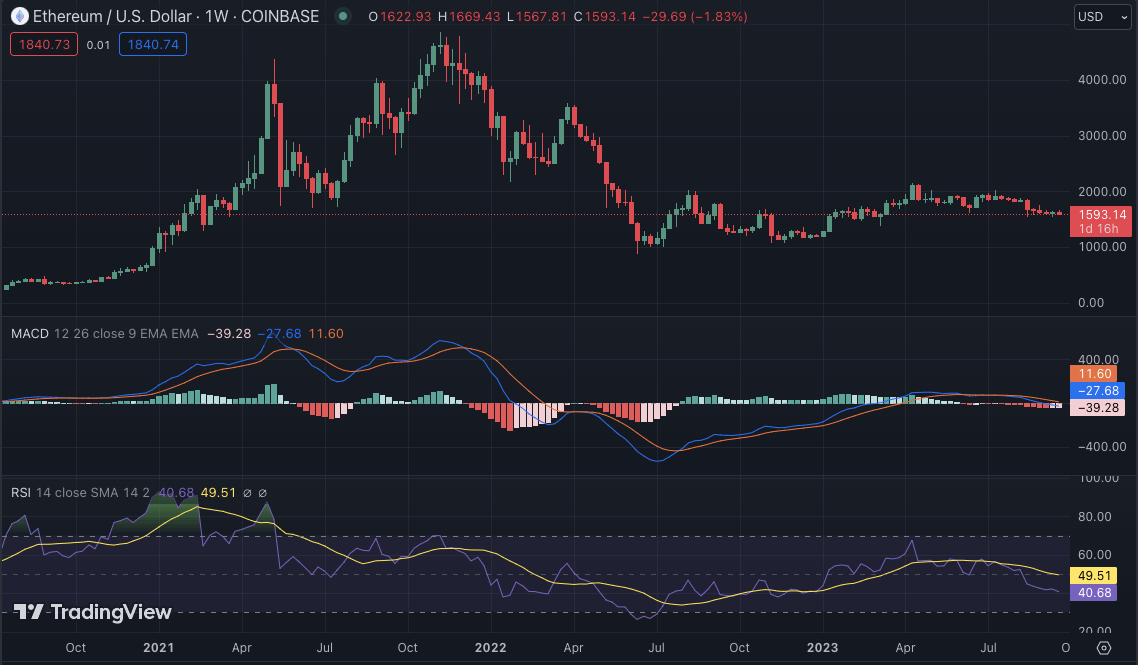
The support level for ETH/USD is seen at $1,570, while the resistance level remains at $1,620. If the bulls manage to break above this resistance level, ETH/USD could see a retest of the $1,650 level. However, if the bears take control and break below the support level, we could see a dip towards the next key support level at $1,500.
ETH/美元的支撑位为 1,570 美元,而阻力位仍为 1,620 美元。如果多头成功突破这一阻力位,ETH/美元可能会重新测试 1,650 美元的水平。然而,如果空头控制并跌破支撑位,我们可能会看到价格跌向下一个关键支撑位 1,500 美元。
The technical indicators for ETH/USD also indicate indecision in the market. The 20-SMA and 50-EMA are both trending below the price, suggesting bearish pressure. However, the RSI is hovering around 40, indicating a balance between buying and selling pressure. The MACD indicator shows signs of a neutral crossover, which could indicate a potential reversal in the short term.
ETH/USD 的技术指标也表明市场犹豫不决。 20 移动平均线和 50 移动均线均处于价格下方,表明存在看跌压力。然而,RSI 徘徊在 40 左右,表明买卖压力平衡。 MACD指标显示出中性交叉的迹象,这可能表明短期内可能出现逆转。
BNB/USD
币安币/美元
Binance Coin (BNB) price analysis shows that the fourth-largest cryptocurrency has been trading in a tight range between $221 and $208 for most of the past week. This suggests that there is strong support at these levels, and any significant dips could be seen as buying opportunities by traders. BNB/USD is currently trading at $210, with a decrease of 0.09% in the past 24 hours. In the past week, BNB/USD has recorded a modest loss of 1.04%.
币安币 (BNB) 价格分析显示,过去一周的大部分时间里,第四大加密货币一直在 221 美元至 208 美元之间窄幅波动。这表明这些水平有强大的支撑,任何大幅下跌都可能被交易者视为买入机会。 BNB/美元目前交易价格为210美元,过去24小时下跌0.09%。过去一周,BNB/美元小幅下跌 1.04%。
On 18th September, BNB touched a weekly high of $221.6 but failed to sustain the bullish momentum, falling back towards the $210 level. The support level for BNB/USD is seen at $200, while the resistance level remains at $221. If the bulls manage to break above this resistance level, a retest of the key psychological level of $230 could be on the cards. However, if the bears take control and break below the support level, the next key support at $200.
9 月 18 日,BNB 触及 221.6 美元的周高位,但未能维持看涨势头,回落至 210 美元水平。 BNB/USD 的支撑位为 200 美元,阻力位仍为 221 美元。如果多头成功突破这一阻力位,则可能会重新测试 230 美元的关键心理水平。然而,如果空头控制并跌破支撑位,则下一个关键支撑位为 200 美元。
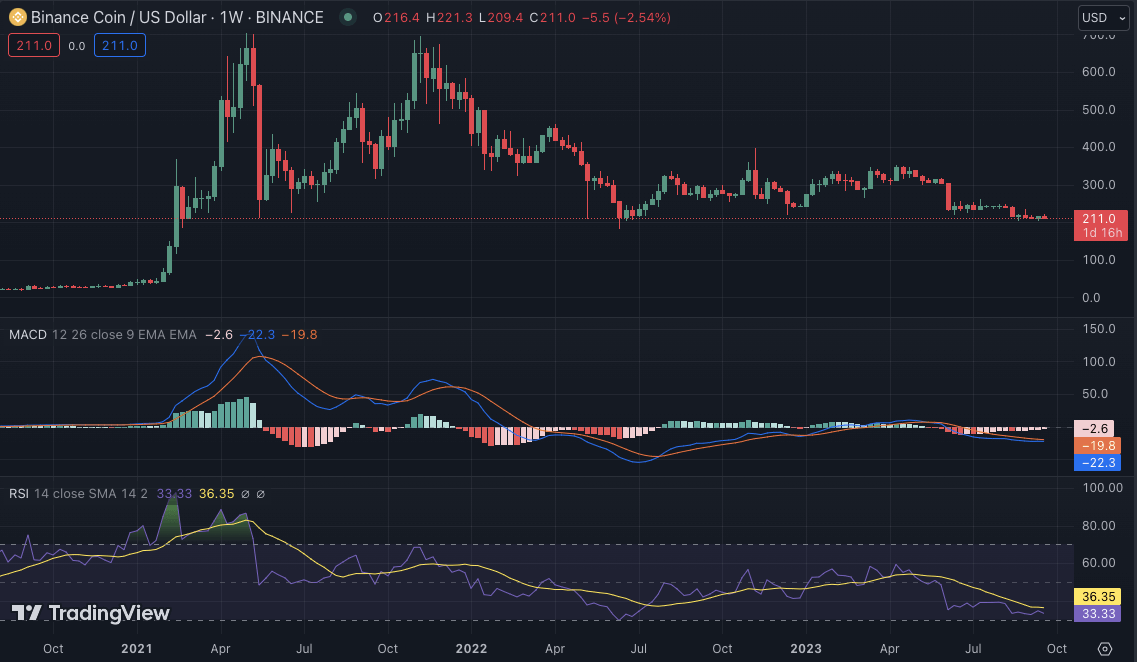
The technical indicators for BNB/USD also suggest neutral sentiment in the market. The 20-SMA is slightly above the price and acting as a resistance level, while the 50-EMA is trending below, indicating bearish pressure. The MACD indicator is hovering around the zero line, and the RSI is showing the balance between buying and selling pressure.
BNB/美元的技术指标也表明市场情绪中性。 20-SMA 略高于价格并充当阻力位,而 50-EMA 则趋向下方,表明看跌压力。 MACD指标徘徊在零线附近,RSI显示买卖压力平衡。
XRP/USD
瑞波币/美元
XRP has been trading below the $0.52 level for most of this week, with bears and bulls locked in a battle. The weekly high was seen at $0.5235 on 21st September and touched a low of $0.4896 on 18th September. The bulls have been gaining the upper hand in the past 24 hours, with XRP/USD currently trading at $0.515, recording a modest increase of 1.28% and a 7-day loss of 3.67%.
本周大部分时间 XRP 交易价格均低于 0.52 美元,空头和多头陷入战斗。 9 月 21 日,周高点为 0.5235 美元,9 月 18 日触及低点 0.4896 美元。过去24小时多头占据上风,XRP/美元目前交易价格为0.515美元,小幅上涨1.28%,7天下跌3.67%。
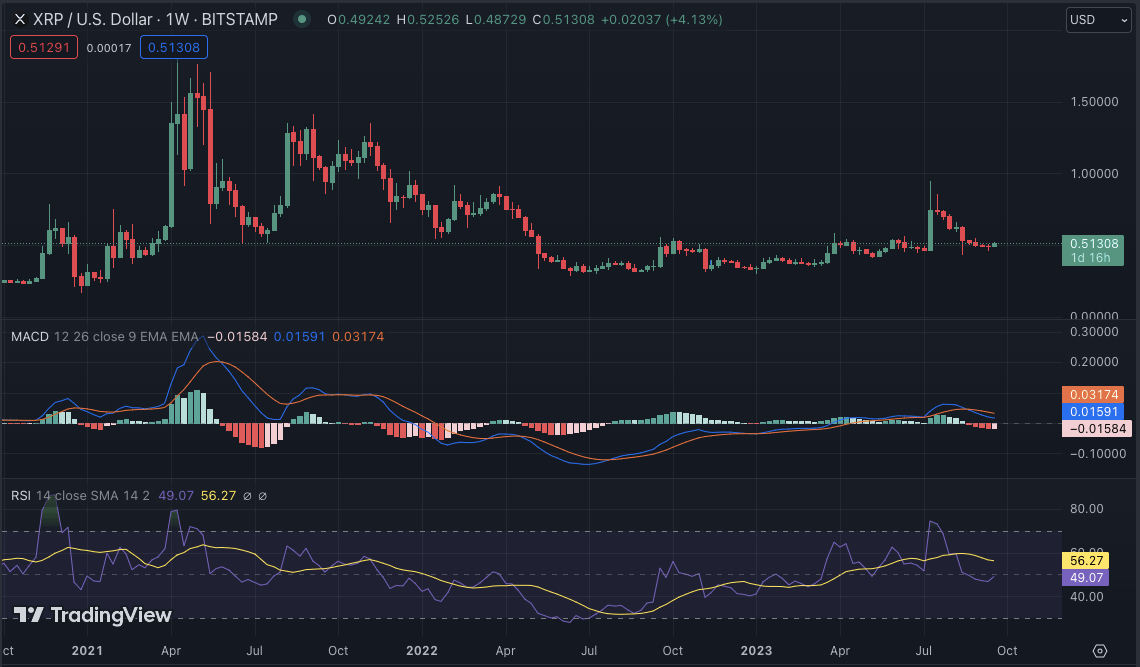
The moving averages for XRP/USD indicate a bullish trend, with the 20-EMA trending above the 50-SMA. The MACD indicator has also turned bullish, indicating a potential crossover in the short term. The RSI is hovering above the 40.00 level, showing buying momentum. The support level for XRP/USD is seen at $0.48, while the resistance level remains at $0.52.
XRP/USD 的移动平均线表明看涨趋势,20-EMA 趋势高于 50-SMA。 MACD指标也转为看涨,表明短期内可能出现交叉。 RSI 徘徊在 40.00 水平之上,显示出买盘动力。 XRP/USD 的支撑位为 0.48 美元,阻力位仍为 0.52 美元。
DOGE/USD
狗狗币/美元
Dogecoin price analysis shows that the meme-inspired cryptocurrency has maintained its position above the key support level of $0.0600 this week, with minor fluctuations in prices. DOGE/USD is currently trading at $0.06145, recording a loss of 0.04% in the past 24 hours and a 7-day loss of 0.92%. The bears have been in control in the past few days, and if momentum continues, DOGE/USD could see a dip towards the support at $0.05800.
狗狗币价格分析显示,这种受 meme 启发的加密货币本周维持在 0.0600 美元关键支撑位上方,价格小幅波动。 DOGE/USD目前交易价格为0.06145美元,过去24小时下跌0.04%,7天下跌0.92%。过去几天空头一直处于控制地位,如果势头持续下去,狗狗/美元可能会跌向 0.05800 美元的支撑位。
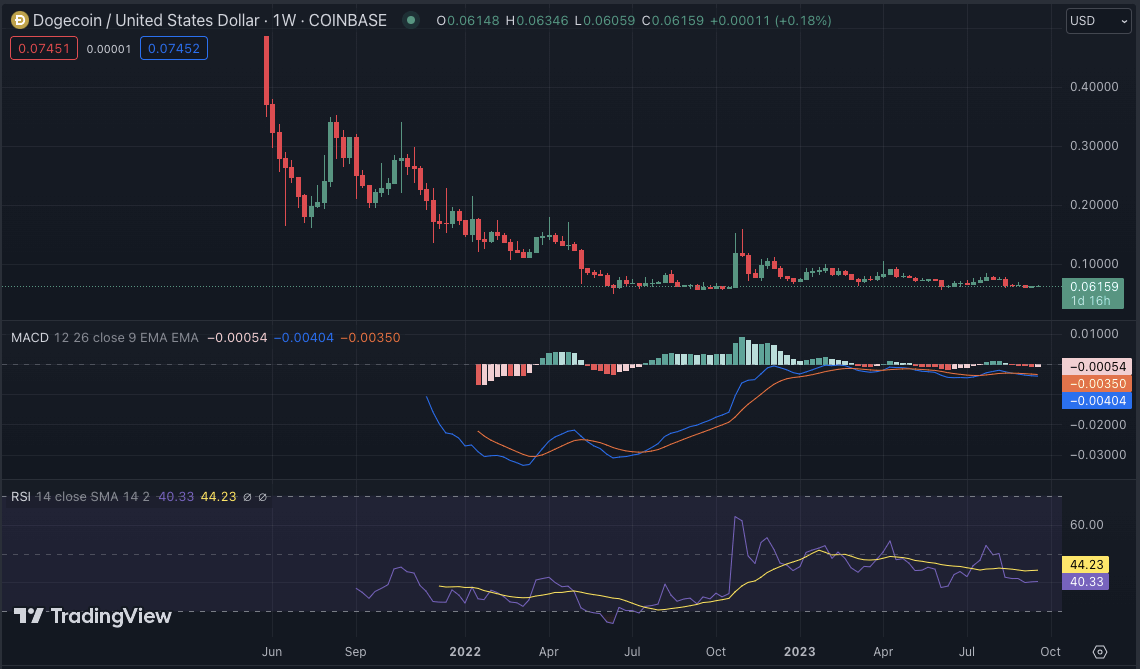
The technical indicators for DOGE/USD show that the 20-SMA is acting as a resistance level, with the 50-EMA trending below, indicating bearish pressure. The MACD indicator has also turned bearish, suggesting a potential crossover in the short term. The RSI is hovering around the 40.00 level, indicating a balance between buying and selling pressure.
DOGE/USD的技术指标显示,20-SMA作为阻力位,50-EMA趋向下方,表明看跌压力。 MACD指标也转为看跌,暗示短期内可能出现交叉。 RSI徘徊在40.00水平附近,表明买卖压力平衡。
LTC/USD
莱特币/美元
Litecoin price analysis shows that LTC has been trading in a tight range between $63.30 and $68.00 for the past week. The sideways movement suggests indecision in the market, with neither bulls nor bears taking control. The bulls and bears have been in a tug-of-war near the key support level of $65.00, with LTC/USD currently trading at $66.33, recording an increase of 0.33% in the past 24 hours and a 7-day loss of 0.95%.
莱特币价格分析显示,过去一周 LTC 一直在 63.30 美元至 68.00 美元之间窄幅波动。横盘走势表明市场犹豫不决,多头和空头都没有占据主导地位。多空在65.00美元关键支撑位附近展开拉锯战,LTC/USD目前交投于66.33美元,过去24小时上涨0.33%,7日跌幅为0.95% 。
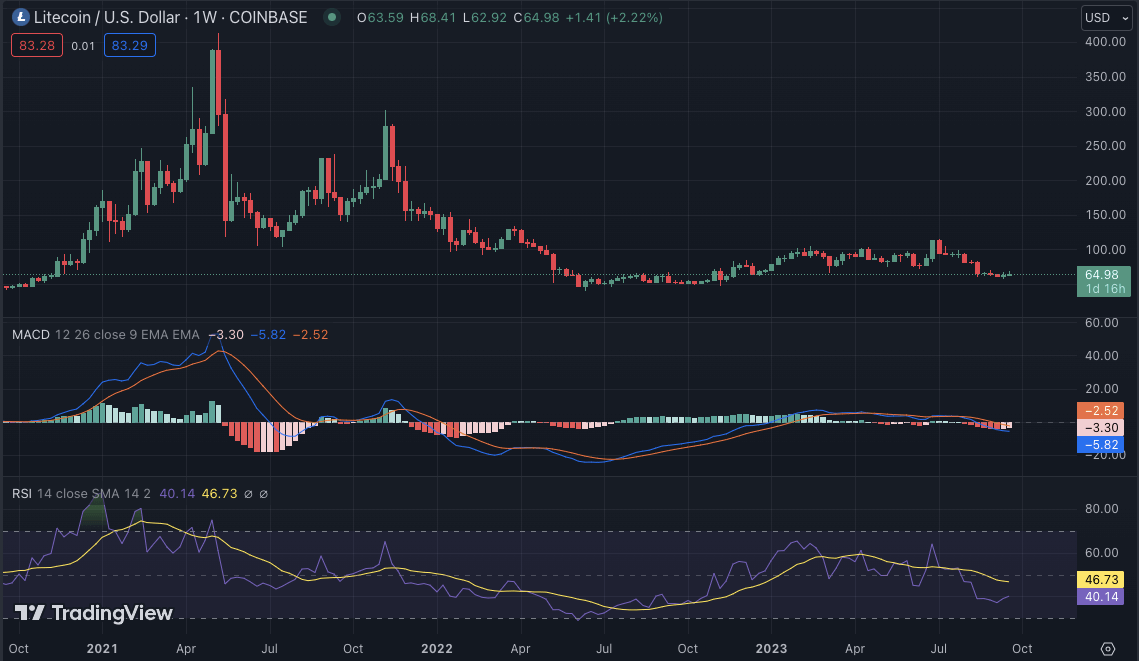
The technical indicators for LTC/USD are currently in neutral territory, with the moving averages closely tracking the price and the MACD indicator hovering around the zero line. The RSI is also ranging between 40 and 50, indicating indecision in the market. The 20-EMA is currently below the price and acting as a support level, while the 50-SMA is above, suggesting potential resistance.
LTC/USD的技术指标目前处于中性区域,移动平均线密切跟踪价格,MACD指标徘徊在零线附近。 RSI 也在 40 至 50 之间波动,表明市场犹豫不决。 20 均线目前位于价格下方,充当支撑位,而 50 移动平均线位于价格上方,表明存在潜在阻力。
Weekly Crypto Analysis Conclusion
每周加密分析结论
Overall, the crypto market is in a period of consolidation, with most coins trading within range-bound conditions. The bullish and bearish divergences being seen on many coins indicate that there is a tug-of-war occurring between the bulls and bears. In the near term, it is likely that some coins will break out of their current levels and begin to rally higher, while others might drop lower.
总体而言,加密货币市场正处于整合时期,大多数代币的交易都在区间内进行。许多代币上出现的看涨和看跌背离表明多头和空头之间正在发生拉锯战。短期内,一些代币可能会突破当前水平并开始上涨,而另一些代币可能会下跌。
 Cryptopolitan_News
 Optimisus
 Crypto News Land
 DogeHome
 Crypto News Flash
 CoinsProbe
 CFN
CFN Cryptos Newss


