

Following recent weekly lows, Bitcoin and prominent alternative cryptocurrencies are observing a slight retraction, suggesting that investors might be capitalizing on the decline.
최근 주간 최저치에 이어 비트코인과 주요 대체 암호화폐가 약간의 후퇴를 보이고 있어 투자자들이 하락세를 활용하고 있을 수도 있음을 시사합니다.
In a recent assembly on September 20, the Federal Reserve chose against elevating interest rates. However, a prolonged period of elevated rates might be on the horizon. Jerome Powell, the Fed’s Chair, underscored in the subsequent media briefing that achieving a consistent 2% inflation rate remains a distant target.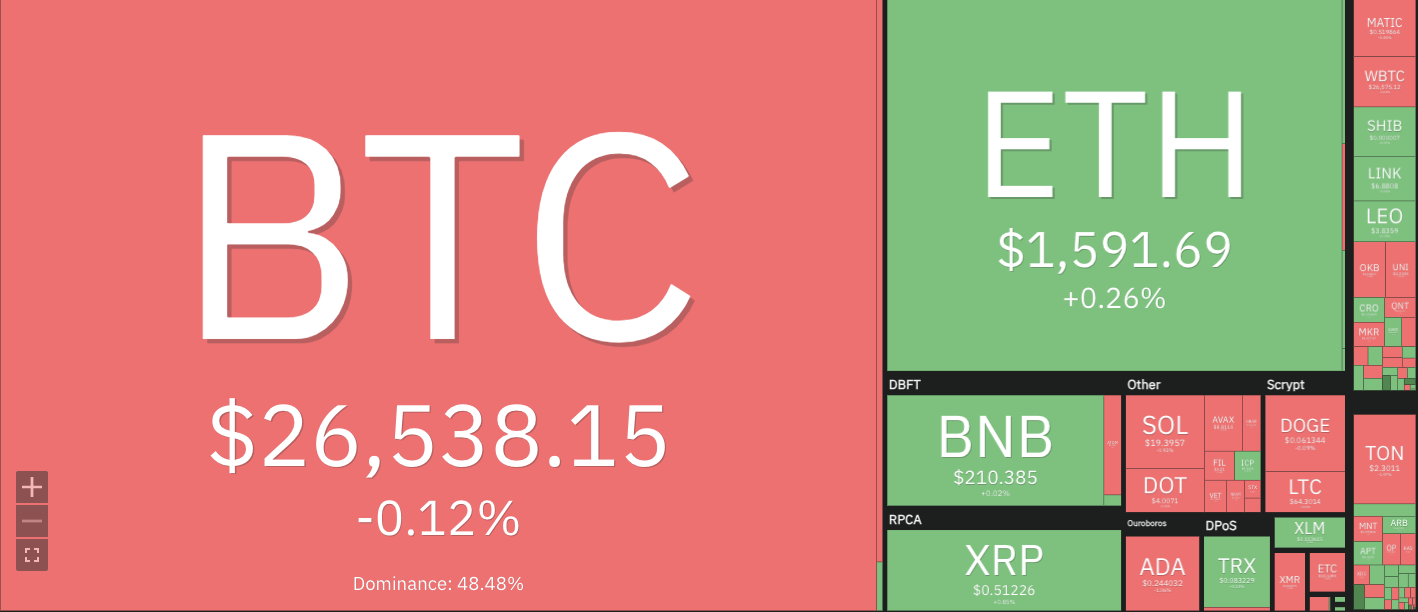
지난 9월 20일 의회에서 연준은 금리 인상을 반대하기로 결정했습니다. 그러나 장기간의 금리 인상이 예상될 수 있습니다. 제롬 파월 연준 의장은 후속 언론 브리핑에서 일관된 2% 인플레이션율 달성은 여전히 먼 목표라고 강조했습니다.
Cryptocurrencies Price Heatmap, Source: Coin360
암호화폐 가격 히트맵, 출처: Coin360
Such indications potentially instigated the recent downtrend in the US stock market and extended to the digital currency domain. Elevated interest rates typically weigh on the performance of assets perceived as high risk.
The week saw the S&P 500 index retract by over 2%, with the Nasdaq pulling back approximately 3%. In contrast, Bitcoin’s performance remained relatively unchanged. While alternative cryptocurrencies grappled to retain the week’s gains, primarily due to heightened risk aversion, there’s a silver lining. Bitcoin and its significant counterparts maintained positions above their vital support benchmarks. The impending price trajectory will be pivotal, and expected to spotlight a fierce tug-of-war between optimistic and cautious investors.
이번 주에 S&P 500 지수는 2% 이상 하락했고, 나스닥은 약 3% 하락했습니다. 반면 비트코인의 실적은 상대적으로 변함이 없었다. 대체 암호화폐는 주로 위험 회피가 높아지면서 이번 주 상승세를 유지하기 위해 고군분투하고 있지만 희망적인 면이 있습니다. 비트코인과 그 주요 상대는 중요한 지원 벤치마크 이상의 위치를 유지했습니다. 임박한 가격 궤적은 중추적인 역할을 할 것이며 낙관적인 투자자와 신중한 투자자 사이의 치열한 줄다리기를 부각시킬 것으로 예상됩니다.
Most of the cryptocurrencies in the past seven days have been trading in a sideways trend, with bulls and bears attempting to assert dominance. This has resulted in minor fluctuations in prices with no clear direction.
지난 7일 동안 대부분의 암호화폐는 상승세와 하락세가 지배권을 주장하는 등 횡보 추세로 거래되었습니다. 이로 인해 명확한 방향이 없는 가격의 작은 변동이 발생했습니다.
BTC/USD
BTC/USD
Bitcoin price analysis shows that the dominant cryptocurrency has been trading in a tight range between $27,465 and $26,400 for most of the past week. This suggests that there is strong support at these levels, and any significant dips could be seen as buying opportunities by traders. BTC/USD is currently trading at $26,588, with a minimal decrease of 0.4% in the past 24 hours; however, in the past 7 days, it has recorded a modest 0.86% gain.
비트코인 가격 분석에 따르면 지배적인 암호화폐는 지난 주 대부분 동안 27,465달러에서 26,400달러 사이의 좁은 범위에서 거래되었습니다. 이는 해당 수준에서 강력한 지지가 있음을 의미하며 상당한 하락은 트레이더의 매수 기회로 볼 수 있습니다. BTC/USD는 현재 $26,588에 거래되고 있으며 지난 24시간 동안 최소 0.4% 감소했습니다. 그러나 지난 7일 동안 소폭 0.86% 상승을 기록했습니다.
The support level for BTC/USD is seen at $26,400, while the resistance level remains at $27,465. If the price breaks above this resistance level, a retest of the key psychological level of $28,000 could be on the cards. However, if the support level is breached, we could see a dip towards the $26,000 region.
BTC/USD의 지지 수준은 $26,400이고 저항 수준은 $27,465입니다. 가격이 이 저항선을 넘어설 경우 주요 심리적 수준인 28,000달러를 다시 테스트할 수 있습니다. 그러나 지원 수준이 위반되면 $26,000 지역으로 하락할 수 있습니다.
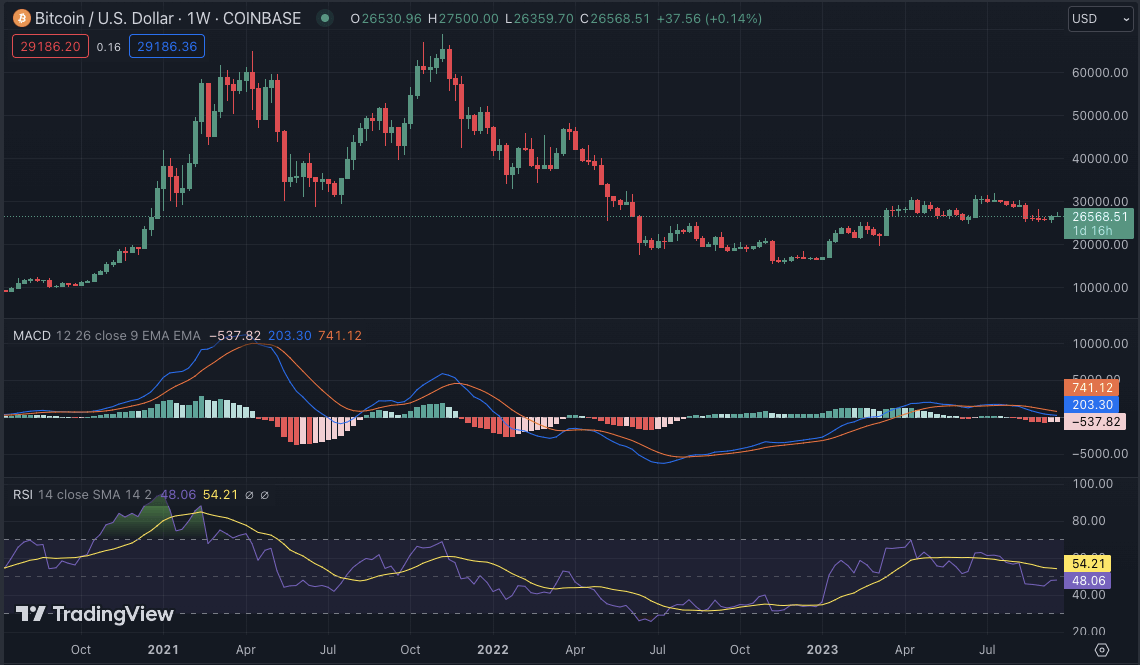
The technical indicators in the past few days have been in neutral territory, suggesting that the market is in a state of indecision. The MACD indicator is hovering around the zero line, while the RSI has been ranging between 40 and 50. The 50-EMA is currently acting as a support level, indicating that the bulls may have the upper hand in the short term.
지난 며칠 동안의 기술 지표는 중립 영역에 있었으며 이는 시장이 우유부단한 상태에 있음을 시사합니다. MACD 지표는 0선을 맴돌고 있고 RSI는 40~50 사이에 머물고 있습니다. 현재 50-EMA는 지지선 역할을 하고 있어 단기적으로는 상승세가 우위를 점할 수 있음을 나타냅니다.
ETH/USD
ETH/USD
Ethereum price analysis shows that the second-largest cryptocurrency has successfully broken below the key support level of $1,600. The bears have been successful in pushing the price towards a low of $1,570. However, ETH/USD has managed to bounce back and is currently trading at $1,594, with an increase of 0.36% in the past 24 hours. In the past week, ETH/USD has recorded a minor loss of 1.73%. The bulls and bears are currently in a tug-of-war at this level and the outcome of this battle could determine the short-term price trajectory.
이더리움 가격 분석에 따르면 두 번째로 큰 암호화폐는 주요 지원 수준인 1,600달러 아래로 성공적으로 진입한 것으로 나타났습니다. 하락세는 가격을 최저 $1,570까지 끌어내는 데 성공했습니다. 그러나 ETH/USD는 반등에 성공하여 현재 지난 24시간 동안 0.36% 오른 $1,594에 거래되고 있습니다. 지난 주 ETH/USD는 1.73%의 소폭 손실을 기록했습니다. 현재 이 수준에서는 황소와 곰이 줄다리기를 하고 있으며, 이 싸움의 결과에 따라 단기 가격 궤적이 결정될 수 있습니다.
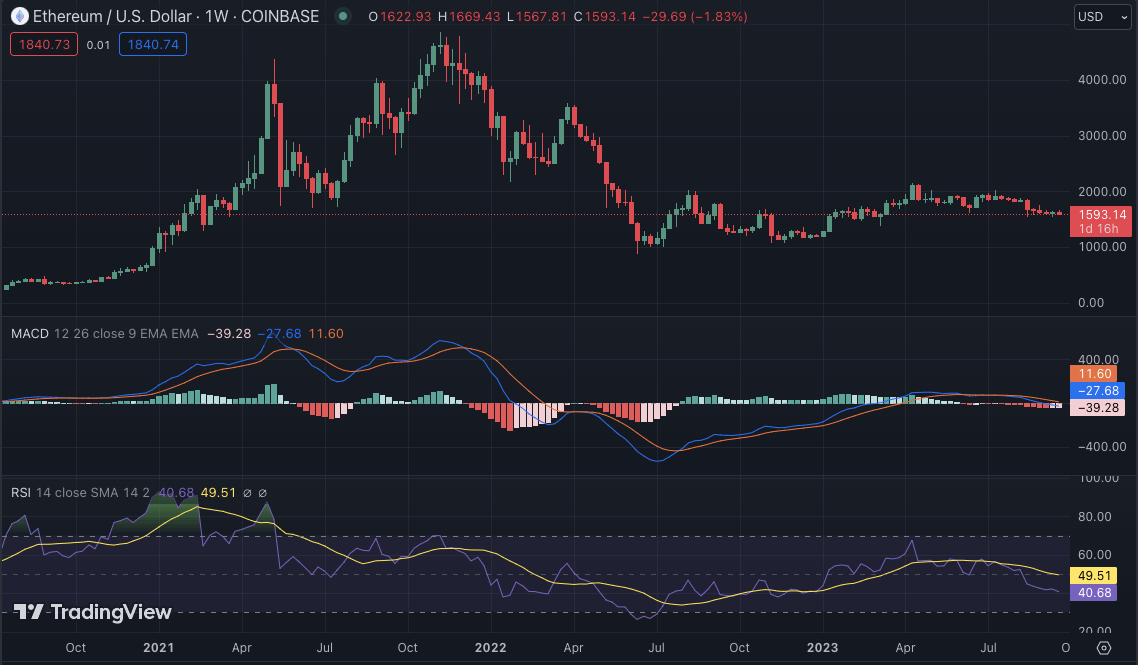
The support level for ETH/USD is seen at $1,570, while the resistance level remains at $1,620. If the bulls manage to break above this resistance level, ETH/USD could see a retest of the $1,650 level. However, if the bears take control and break below the support level, we could see a dip towards the next key support level at $1,500.
ETH/USD의 지지 수준은 $1,570이고 저항 수준은 $1,620입니다. 상승세가 이 저항 수준을 넘어설 경우 ETH/USD는 1,650달러 수준을 다시 테스트할 수 있습니다. 그러나 하락세가 주도권을 잡고 지지 수준 아래로 떨어지면 $1,500의 다음 주요 지지 수준으로 하락하는 것을 볼 수 있습니다.
The technical indicators for ETH/USD also indicate indecision in the market. The 20-SMA and 50-EMA are both trending below the price, suggesting bearish pressure. However, the RSI is hovering around 40, indicating a balance between buying and selling pressure. The MACD indicator shows signs of a neutral crossover, which could indicate a potential reversal in the short term.
BNB/USD
BNB/USD
Binance Coin (BNB) price analysis shows that the fourth-largest cryptocurrency has been trading in a tight range between $221 and $208 for most of the past week. This suggests that there is strong support at these levels, and any significant dips could be seen as buying opportunities by traders. BNB/USD is currently trading at $210, with a decrease of 0.09% in the past 24 hours. In the past week, BNB/USD has recorded a modest loss of 1.04%.
바이낸스 코인(BNB) 가격 분석에 따르면 네 번째로 큰 암호화폐는 지난 주 대부분 동안 221달러에서 208달러 사이의 좁은 범위에서 거래되었습니다. 이는 해당 수준에서 강력한 지지가 있음을 의미하며 상당한 하락은 트레이더의 매수 기회로 볼 수 있습니다. BNB/USD는 현재 $210에 거래되고 있으며 지난 24시간 동안 0.09% 하락했습니다. 지난 주 BNB/USD는 1.04%의 소폭 손실을 기록했습니다.
On 18th September, BNB touched a weekly high of $221.6 but failed to sustain the bullish momentum, falling back towards the $210 level. The support level for BNB/USD is seen at $200, while the resistance level remains at $221. If the bulls manage to break above this resistance level, a retest of the key psychological level of $230 could be on the cards. However, if the bears take control and break below the support level, the next key support at $200.
9월 18일, BNB는 주간 최고치인 $221.6을 기록했지만 강세 모멘텀을 유지하지 못하고 $210 수준으로 떨어졌습니다. BNB/USD의 지지 수준은 200달러이고 저항 수준은 221달러입니다. 상승세가 이 저항선을 넘어설 경우 주요 심리적 수준인 230달러를 다시 테스트할 수 있습니다. 그러나 하락세가 주도권을 잡고 지지선 아래로 떨어지면 다음 주요 지지선은 200달러가 됩니다.
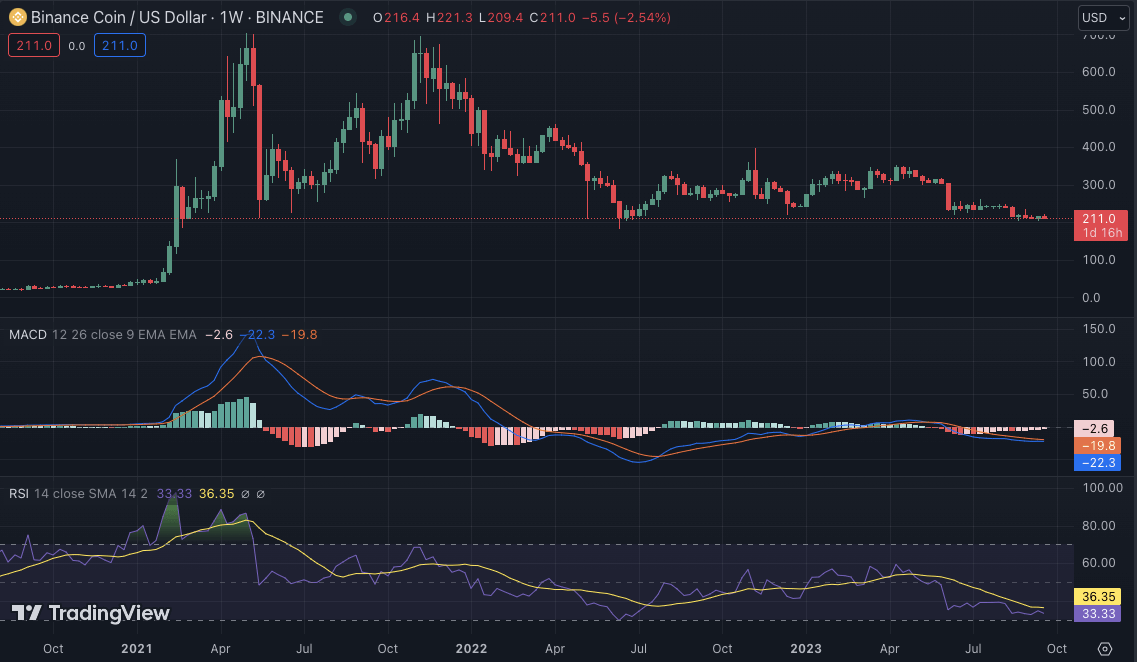
The technical indicators for BNB/USD also suggest neutral sentiment in the market. The 20-SMA is slightly above the price and acting as a resistance level, while the 50-EMA is trending below, indicating bearish pressure. The MACD indicator is hovering around the zero line, and the RSI is showing the balance between buying and selling pressure.
BNB/USD에 대한 기술 지표 역시 시장의 중립적 분위기를 시사합니다. 20-SMA는 가격보다 약간 높으며 저항 수준으로 작용하는 반면, 50-EMA는 하락 추세를 보이고 있어 약세 압력을 나타냅니다. MACD 지표는 0선 주위를 맴돌고 있고 RSI는 매수와 매도 압력 사이의 균형을 보여주고 있습니다.
XRP/USD
XRP has been trading below the $0.52 level for most of this week, with bears and bulls locked in a battle. The weekly high was seen at $0.5235 on 21st September and touched a low of $0.4896 on 18th September. The bulls have been gaining the upper hand in the past 24 hours, with XRP/USD currently trading at $0.515, recording a modest increase of 1.28% and a 7-day loss of 3.67%.
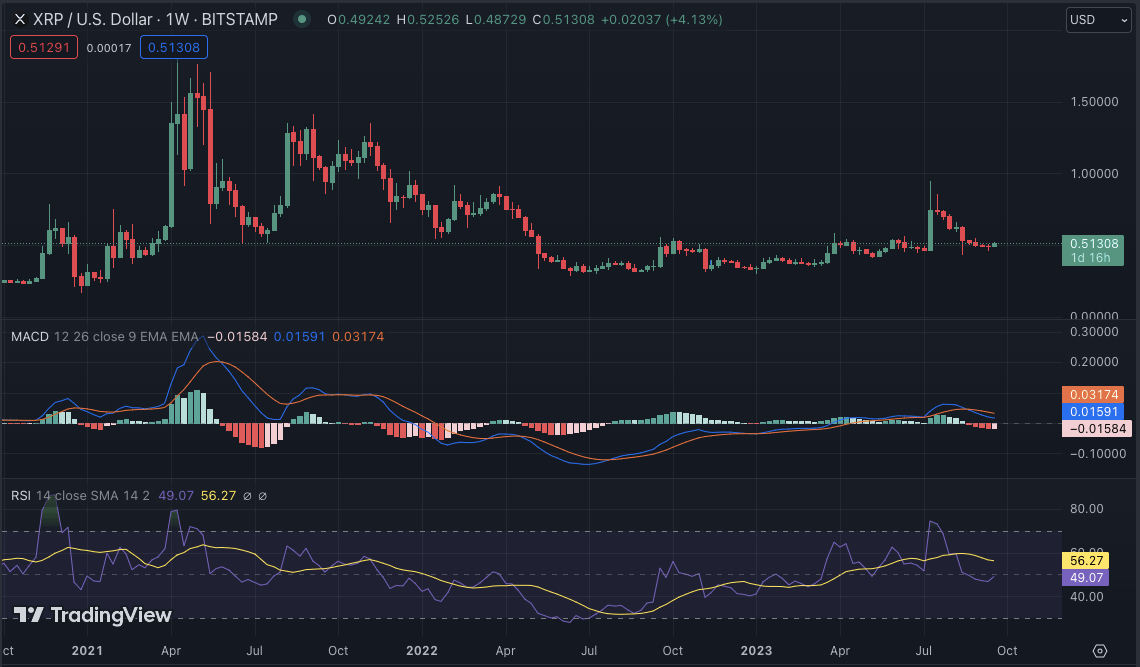
The moving averages for XRP/USD indicate a bullish trend, with the 20-EMA trending above the 50-SMA. The MACD indicator has also turned bullish, indicating a potential crossover in the short term. The RSI is hovering above the 40.00 level, showing buying momentum. The support level for XRP/USD is seen at $0.48, while the resistance level remains at $0.52.
XRP/USD의 이동 평균은 강세 추세를 나타내며 20-EMA는 50-SMA보다 높은 경향을 보입니다. MACD 지표도 강세로 바뀌어 단기적으로 교차할 가능성이 있음을 나타냅니다. RSI는 40.00을 넘어서며 매수 모멘텀을 보여주고 있습니다. XRP/USD의 지지 수준은 0.48달러이고 저항 수준은 0.52달러로 유지됩니다.
DOGE/USD
Dogecoin price analysis shows that the meme-inspired cryptocurrency has maintained its position above the key support level of $0.0600 this week, with minor fluctuations in prices. DOGE/USD is currently trading at $0.06145, recording a loss of 0.04% in the past 24 hours and a 7-day loss of 0.92%. The bears have been in control in the past few days, and if momentum continues, DOGE/USD could see a dip towards the support at $0.05800.
Dogecoin 가격 분석에 따르면 밈에서 영감을 받은 암호화폐는 이번 주에 가격의 소폭 변동과 함께 주요 지지 수준인 $0.0600 이상의 위치를 유지했습니다. DOGE/USD는 현재 $0.06145에 거래되고 있으며 지난 24시간 동안 0.04%, 7일간 0.92%의 손실을 기록했습니다. 지난 며칠 동안 약세가 통제되어 왔으며 모멘텀이 계속된다면 DOGE/USD는 $0.05800의 지지선을 향해 하락할 수 있습니다.
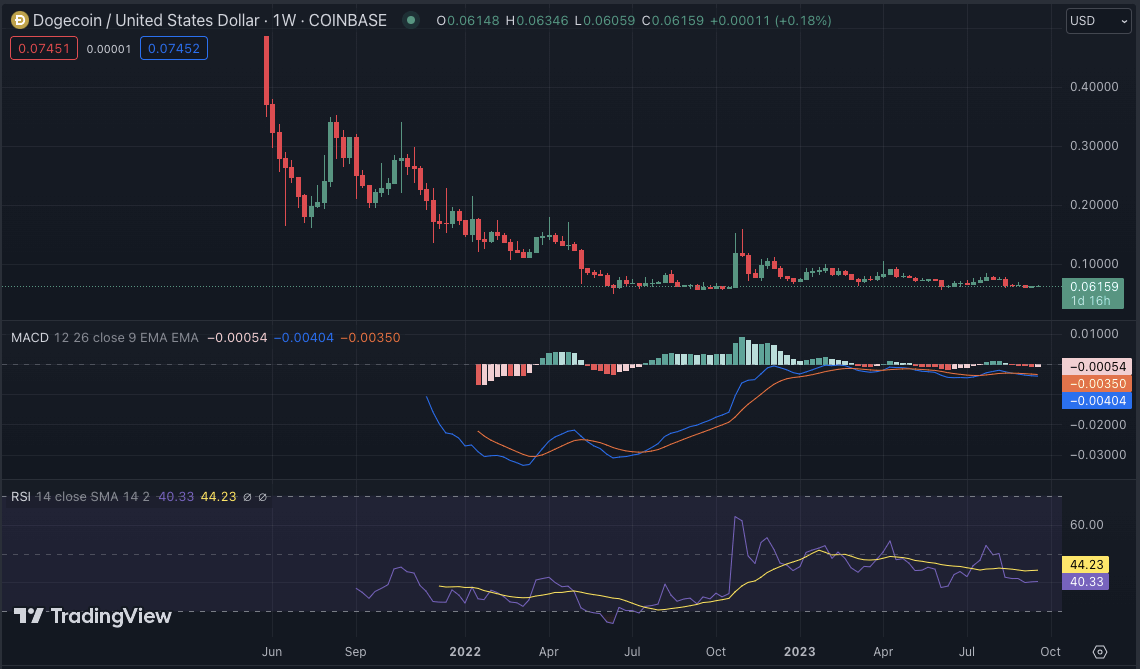
The technical indicators for DOGE/USD show that the 20-SMA is acting as a resistance level, with the 50-EMA trending below, indicating bearish pressure. The MACD indicator has also turned bearish, suggesting a potential crossover in the short term. The RSI is hovering around the 40.00 level, indicating a balance between buying and selling pressure.
DOGE/USD의 기술 지표는 20-SMA가 저항 수준으로 작용하고 있으며 50-EMA 추세가 아래에 있어 약세 압력을 나타냄을 보여줍니다. MACD 지표도 약세로 전환되어 단기적으로 교차할 가능성이 있음을 시사합니다. RSI는 40.00 수준을 맴돌고 있어 매수와 매도 압력 사이의 균형을 나타냅니다.
LTC/USD
LTC/USD
Litecoin price analysis shows that LTC has been trading in a tight range between $63.30 and $68.00 for the past week. The sideways movement suggests indecision in the market, with neither bulls nor bears taking control. The bulls and bears have been in a tug-of-war near the key support level of $65.00, with LTC/USD currently trading at $66.33, recording an increase of 0.33% in the past 24 hours and a 7-day loss of 0.95%.
라이트코인 가격 분석에 따르면 LTC는 지난 주 동안 $63.30에서 $68.00 사이의 좁은 범위에서 거래되었습니다. 횡보 움직임은 강세나 약세가 지배하지 않는 시장의 우유부단함을 암시합니다. 황소와 곰은 주요 지지 수준인 $65.00 근처에서 줄다리기를 해왔습니다. LTC/USD는 현재 $66.33에 거래되고 있으며 지난 24시간 동안 0.33% 증가, 7일간 0.95% 손실을 기록했습니다. .
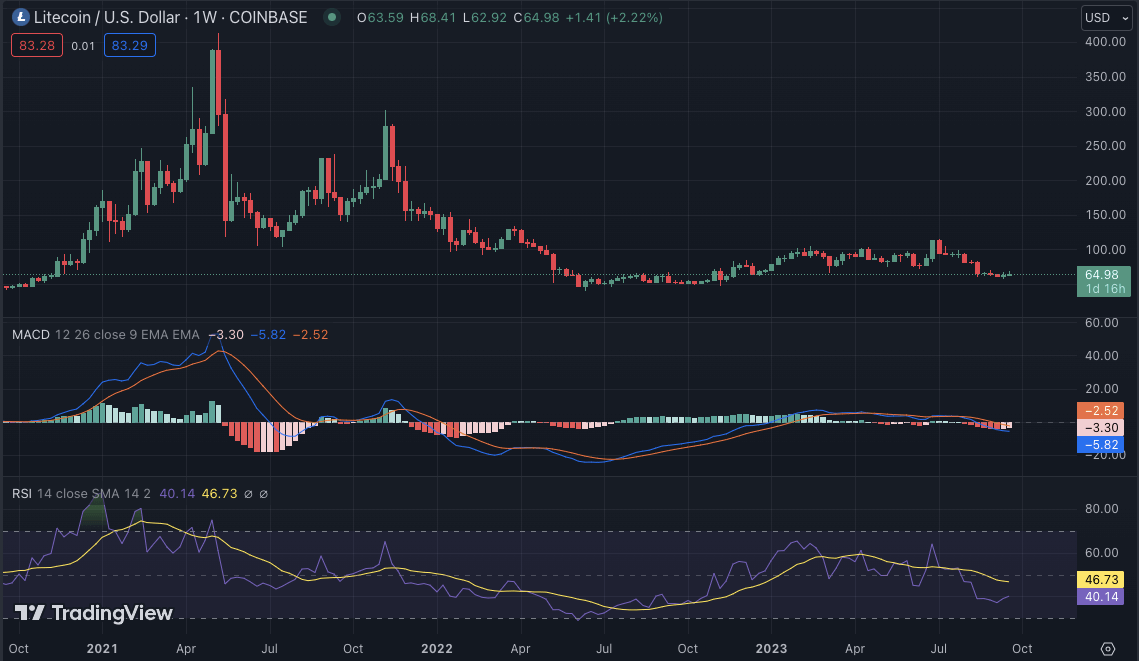
The technical indicators for LTC/USD are currently in neutral territory, with the moving averages closely tracking the price and the MACD indicator hovering around the zero line. The RSI is also ranging between 40 and 50, indicating indecision in the market. The 20-EMA is currently below the price and acting as a support level, while the 50-SMA is above, suggesting potential resistance.
LTC/USD의 기술 지표는 현재 중립 영역에 있으며 이동 평균은 가격을 밀접하게 추적하고 MACD 지표는 0선 주위를 맴돌고 있습니다. RSI도 40~50 사이로 시장의 우유부단함을 나타냅니다. 20-EMA는 현재 가격보다 낮아 지지선 역할을 하고 있는 반면, 50-SMA는 위에 있어 잠재적인 저항을 시사합니다.
Weekly Crypto Analysis Conclusion
주간 암호화폐 분석 결론
Overall, the crypto market is in a period of consolidation, with most coins trading within range-bound conditions. The bullish and bearish divergences being seen on many coins indicate that there is a tug-of-war occurring between the bulls and bears. In the near term, it is likely that some coins will break out of their current levels and begin to rally higher, while others might drop lower.
전반적으로 암호화폐 시장은 통합 기간에 있으며 대부분의 코인은 범위 제한 조건 내에서 거래됩니다. 많은 동전에서 볼 수 있는 강세와 약세 차이는 강세와 약세 사이에 줄다리기가 일어나고 있음을 나타냅니다. 단기적으로는 일부 코인이 현재 수준을 벗어나 더 높은 상승세를 보일 가능성이 높지만 다른 코인은 더 하락할 수도 있습니다.
 DogeHome
 Crypto News Land
 ETHNews
 CFN
CFN U_Today
 Thecoinrepublic.com
 Optimisus
 Optimisus


