

Following recent weekly lows, Bitcoin and prominent alternative cryptocurrencies are observing a slight retraction, suggesting that investors might be capitalizing on the decline.
在最近的每週低點之後,比特幣和著名的替代加密貨幣正在觀察小幅回落,這表明投資者可能正在利用下跌的機會。
In a recent assembly on September 20, the Federal Reserve chose against elevating interest rates. However, a prolonged period of elevated rates might be on the horizon. Jerome Powell, the Fed’s Chair, underscored in the subsequent media briefing that achieving a consistent 2% inflation rate remains a distant target.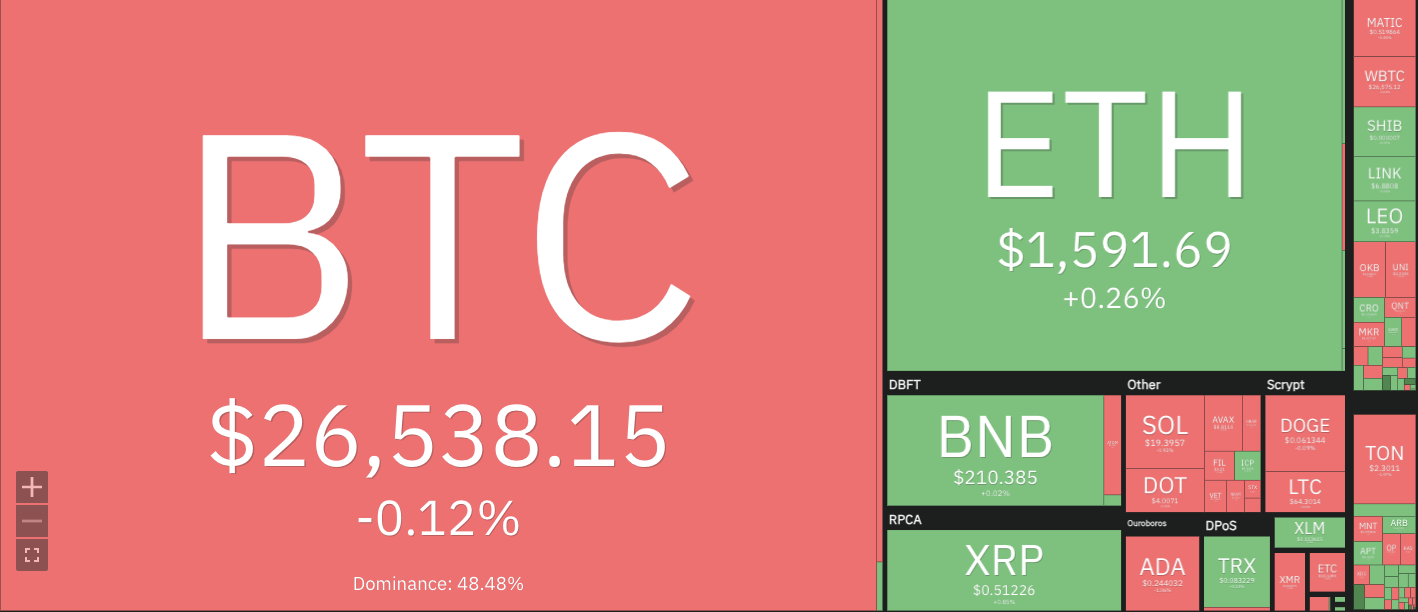
在 9 月 20 日的最近一次會議上,聯準會選擇不升息。然而,長期的高利率可能即將到來。聯準會主席鮑威爾在隨後的媒體簡報會上強調,實現2%的通膨率始終是一個遙遠的目標。
Cryptocurrencies Price Heatmap, Source: Coin360
加密貨幣價格熱圖,來源:Coin360
Such indications potentially instigated the recent downtrend in the US stock market and extended to the digital currency domain. Elevated interest rates typically weigh on the performance of assets perceived as high risk.
這些跡象可能引發近期美國股市的下跌趨勢,並延伸至數位貨幣領域。利率上升通常會影響被視為高風險的資產的表現。
The week saw the S&P 500 index retract by over 2%, with the Nasdaq pulling back approximately 3%. In contrast, Bitcoin’s performance remained relatively unchanged. While alternative cryptocurrencies grappled to retain the week’s gains, primarily due to heightened risk aversion, there’s a silver lining. Bitcoin and its significant counterparts maintained positions above their vital support benchmarks. The impending price trajectory will be pivotal, and expected to spotlight a fierce tug-of-war between optimistic and cautious investors.
本週標普 500 指數下跌超過 2%,那斯達克指數下跌約 3%。相比之下,比特幣的表現相對保持不變。雖然主要由於避險情緒加劇,其他加密貨幣努力保住本週的漲幅,但也有一線希望。比特幣及其重要同業的部位維持在其重要支撐基準之上。即將到來的價格軌跡將至關重要,預計將引發樂觀和謹慎投資者之間的激烈拉鋸戰。
Most of the cryptocurrencies in the past seven days have been trading in a sideways trend, with bulls and bears attempting to assert dominance. This has resulted in minor fluctuations in prices with no clear direction.
過去 7 天,大多數加密貨幣一直處於橫盤趨勢,多頭和空頭試圖佔據主導地位。這導致價格小幅波動,沒有明確的方向。
BTC/USD
比特幣/美元
Bitcoin price analysis shows that the dominant cryptocurrency has been trading in a tight range between $27,465 and $26,400 for most of the past week. This suggests that there is strong support at these levels, and any significant dips could be seen as buying opportunities by traders. BTC/USD is currently trading at $26,588, with a minimal decrease of 0.4% in the past 24 hours; however, in the past 7 days, it has recorded a modest 0.86% gain.
比特幣價格分析顯示,在過去一周的大部分時間裡,主流加密貨幣一直在 27,465 美元至 26,400 美元之間窄幅波動。這表明這些水平存在強大的支撐,任何大幅下跌都可能被交易者視為買入機會。 BTC/USD目前交易價格為26,588美元,過去24小時內最小跌幅為0.4%;然而,在過去 7 天裡,它錄得小幅上漲 0.86%。
The support level for BTC/USD is seen at $26,400, while the resistance level remains at $27,465. If the price breaks above this resistance level, a retest of the key psychological level of $28,000 could be on the cards. However, if the support level is breached, we could see a dip towards the $26,000 region.
BTC/USD 的支撐位為 26,400 美元,阻力位仍為 27,465 美元。如果價格突破這一阻力位,則可能會重新測試 28,000 美元的關鍵心理水平。然而,如果支撐位被突破,我們可能會看到價格跌向 26,000 美元區域。
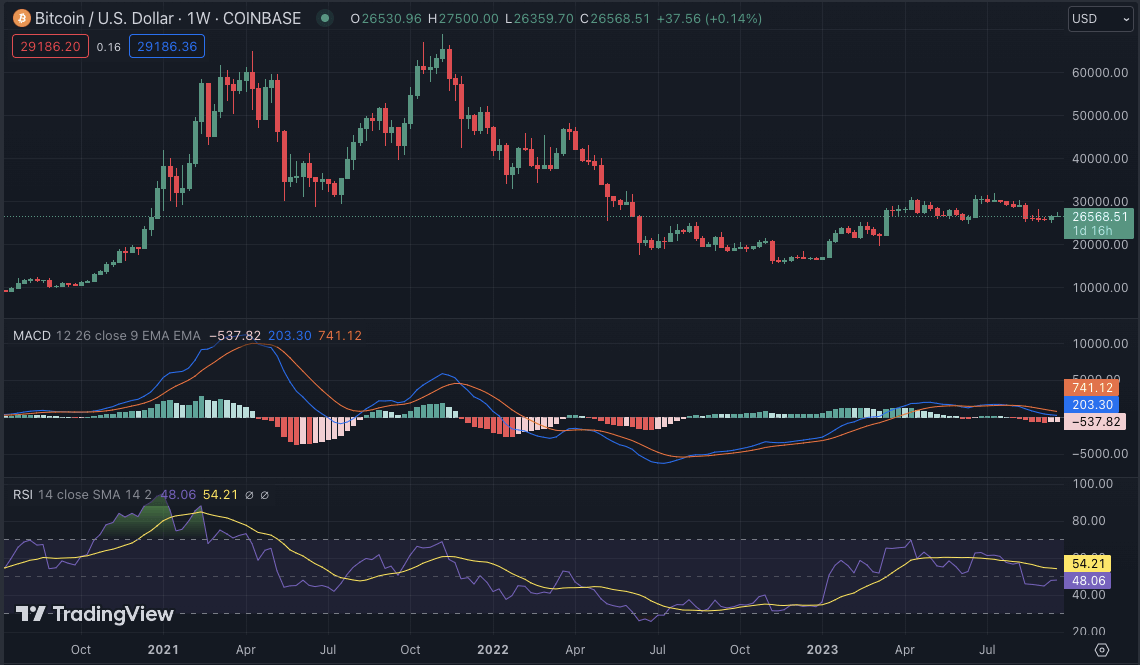
The technical indicators in the past few days have been in neutral territory, suggesting that the market is in a state of indecision. The MACD indicator is hovering around the zero line, while the RSI has been ranging between 40 and 50. The 50-EMA is currently acting as a support level, indicating that the bulls may have the upper hand in the short term.
過去幾天的技術指標一直處於中性區域,顯示市場處於猶豫不決的狀態。 MACD指標徘徊在零線附近,RSI則一直在40至50之間徘徊。50日均線目前充當支撐位,顯示多頭短期內可能佔上風。
ETH/USD
以太坊/美元
Ethereum price analysis shows that the second-largest cryptocurrency has successfully broken below the key support level of $1,600. The bears have been successful in pushing the price towards a low of $1,570. However, ETH/USD has managed to bounce back and is currently trading at $1,594, with an increase of 0.36% in the past 24 hours. In the past week, ETH/USD has recorded a minor loss of 1.73%. The bulls and bears are currently in a tug-of-war at this level and the outcome of this battle could determine the short-term price trajectory.
以太幣價格分析顯示,第二大加密貨幣已成功跌破 1,600 美元的關鍵支撐位。空頭成功地將價格推向 1,570 美元的低點。不過,ETH/USD 已成功反彈,目前交投於 1,594 美元,過去 24 小時內上漲 0.36%。過去一周,ETH/美元小幅下跌 1.73%。多頭和空頭目前正在這一水平上展開拉鋸戰,這場戰鬥的結果可能決定短期價格走勢。
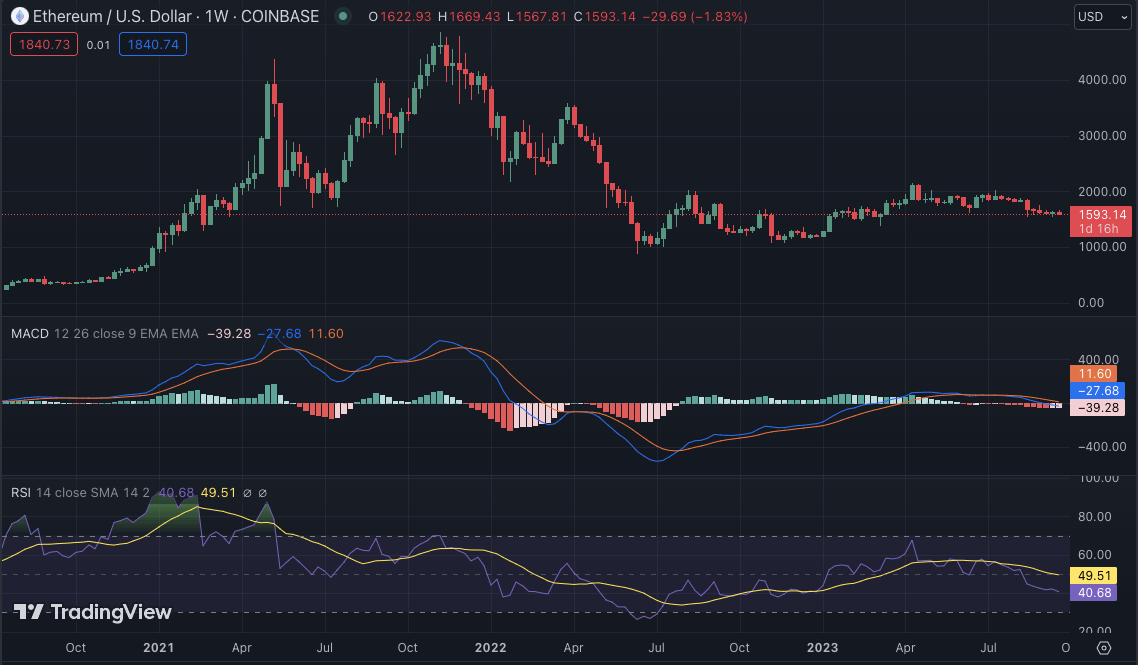
The support level for ETH/USD is seen at $1,570, while the resistance level remains at $1,620. If the bulls manage to break above this resistance level, ETH/USD could see a retest of the $1,650 level. However, if the bears take control and break below the support level, we could see a dip towards the next key support level at $1,500.
ETH/美元的支撐位為 1,570 美元,而阻力位仍為 1,620 美元。如果多頭成功突破這一阻力位,ETH/美元可能會重新測試 1,650 美元的水平。然而,如果空頭控制並跌破支撐位,我們可能會看到價格跌向下一個關鍵支撐位 1,500 美元。
The technical indicators for ETH/USD also indicate indecision in the market. The 20-SMA and 50-EMA are both trending below the price, suggesting bearish pressure. However, the RSI is hovering around 40, indicating a balance between buying and selling pressure. The MACD indicator shows signs of a neutral crossover, which could indicate a potential reversal in the short term.
ETH/USD 的技術指標也顯示市場猶豫不決。 20 移動平均線和 50 移動均線均處於價格下方,表示存在看跌壓力。然而,RSI 徘徊在 40 左右,顯示買賣壓力平衡。 MACD指標顯示中性交叉的跡象,這可能表明短期內可能出現逆轉。
BNB/USD
幣安幣/美元
Binance Coin (BNB) price analysis shows that the fourth-largest cryptocurrency has been trading in a tight range between $221 and $208 for most of the past week. This suggests that there is strong support at these levels, and any significant dips could be seen as buying opportunities by traders. BNB/USD is currently trading at $210, with a decrease of 0.09% in the past 24 hours. In the past week, BNB/USD has recorded a modest loss of 1.04%.
幣安幣 (BNB) 價格分析顯示,在過去一周的大部分時間裡,第四大加密貨幣一直在 221 美元至 208 美元之間窄幅波動。這表明這些水平存在強大的支撐,任何大幅下跌都可能被交易者視為買入機會。 BNB/美元目前交易價格為210美元,過去24小時下跌0.09%。過去一周,BNB/美元小幅下跌 1.04%。
On 18th September, BNB touched a weekly high of $221.6 but failed to sustain the bullish momentum, falling back towards the $210 level. The support level for BNB/USD is seen at $200, while the resistance level remains at $221. If the bulls manage to break above this resistance level, a retest of the key psychological level of $230 could be on the cards. However, if the bears take control and break below the support level, the next key support at $200.
9 月 18 日,BNB 觸及 221.6 美元的周高位,但未能維持看漲勢頭,回落至 210 美元水準。 BNB/USD 的支撐位為 200 美元,阻力位仍為 221 美元。如果多頭成功突破這一阻力位,則可能會重新測試 230 美元的關鍵心理水平。然而,如果空頭控制並跌破支撐位,則下一個關鍵支撐位為 200 美元。
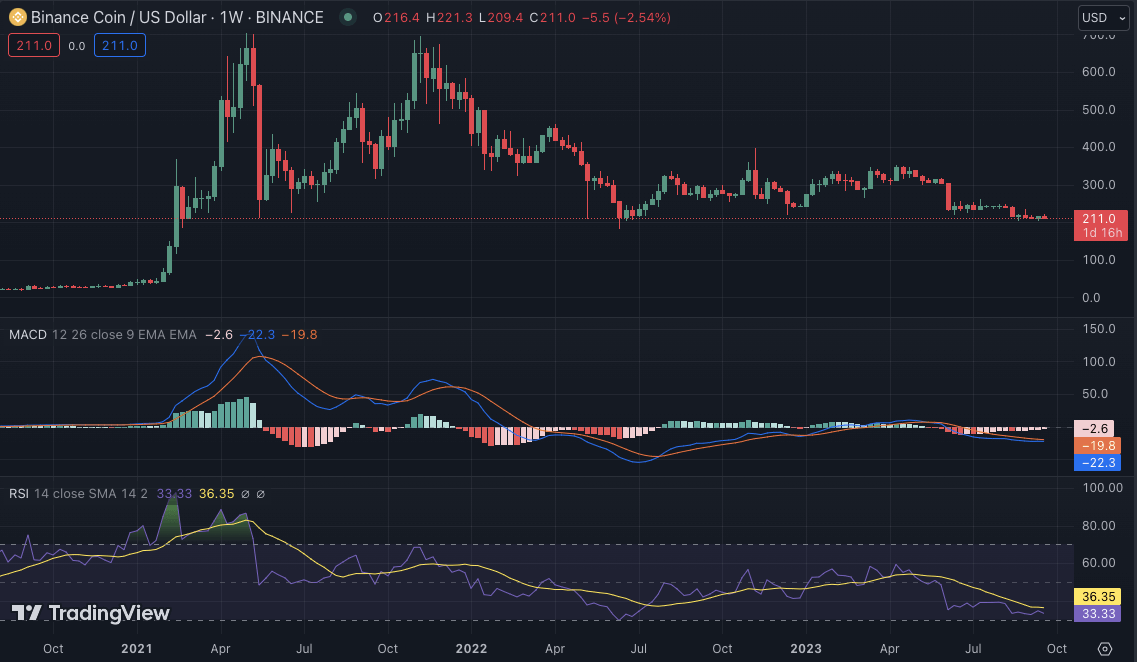
The technical indicators for BNB/USD also suggest neutral sentiment in the market. The 20-SMA is slightly above the price and acting as a resistance level, while the 50-EMA is trending below, indicating bearish pressure. The MACD indicator is hovering around the zero line, and the RSI is showing the balance between buying and selling pressure.
BNB/美元的技術指標也顯示市場情緒中立。 20-SMA 略高於價格並充當阻力位,而 50-EMA 則趨向下方,表明看跌壓力。 MACD指標徘徊在零線附近,RSI顯示買賣壓力平衡。
XRP/USD
瑞波幣/美元
XRP has been trading below the $0.52 level for most of this week, with bears and bulls locked in a battle. The weekly high was seen at $0.5235 on 21st September and touched a low of $0.4896 on 18th September. The bulls have been gaining the upper hand in the past 24 hours, with XRP/USD currently trading at $0.515, recording a modest increase of 1.28% and a 7-day loss of 3.67%.
本周大部分時間 XRP 交易價格均低於 0.52 美元,空頭和多頭陷入戰鬥。 9 月 21 日,周高點為 0.5235 美元,9 月 18 日觸及低點 0.4896 美元。過去24小時多頭佔上風,XRP/USD目前交易價格0.515美元,小漲1.28%,7天下跌3.67%。
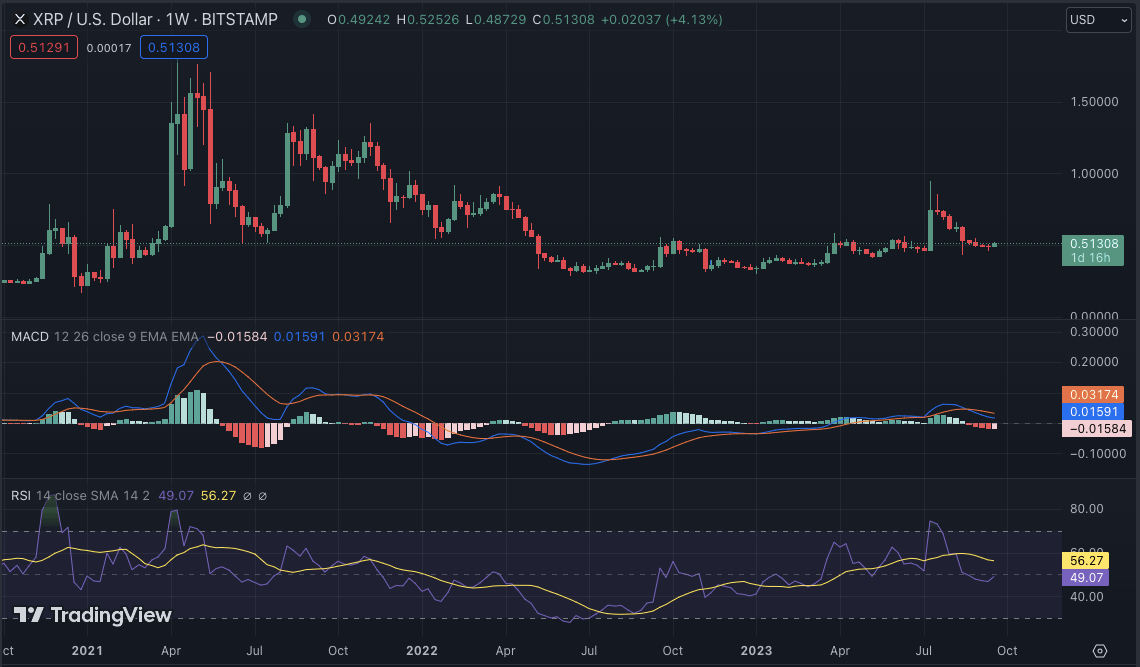
The moving averages for XRP/USD indicate a bullish trend, with the 20-EMA trending above the 50-SMA. The MACD indicator has also turned bullish, indicating a potential crossover in the short term. The RSI is hovering above the 40.00 level, showing buying momentum. The support level for XRP/USD is seen at $0.48, while the resistance level remains at $0.52.
XRP/USD 的移動平均線顯示看漲趨勢,20-EMA 趨勢高於 50-SMA。 MACD指標也轉為看漲,顯示短期內可能出現交叉。 RSI 徘徊在 40.00 水平之上,顯示出買盤動力。 XRP/USD 的支撐位為 0.48 美元,阻力位仍為 0.52 美元。
DOGE/USD
狗狗幣/美元
Dogecoin price analysis shows that the meme-inspired cryptocurrency has maintained its position above the key support level of $0.0600 this week, with minor fluctuations in prices. DOGE/USD is currently trading at $0.06145, recording a loss of 0.04% in the past 24 hours and a 7-day loss of 0.92%. The bears have been in control in the past few days, and if momentum continues, DOGE/USD could see a dip towards the support at $0.05800.
狗狗幣價格分析顯示,這種受 meme 啟發的加密貨幣本週維持在 0.0600 美元關鍵支撐位上方,價格小幅波動。 DOGE/USD目前交易價格為0.06145美元,過去24小時下跌0.04%,7天下跌0.92%。過去幾天空頭一直處於控制地位,如果勢頭持續下去,狗狗/美元可能會跌向 0.05800 美元的支撐位。
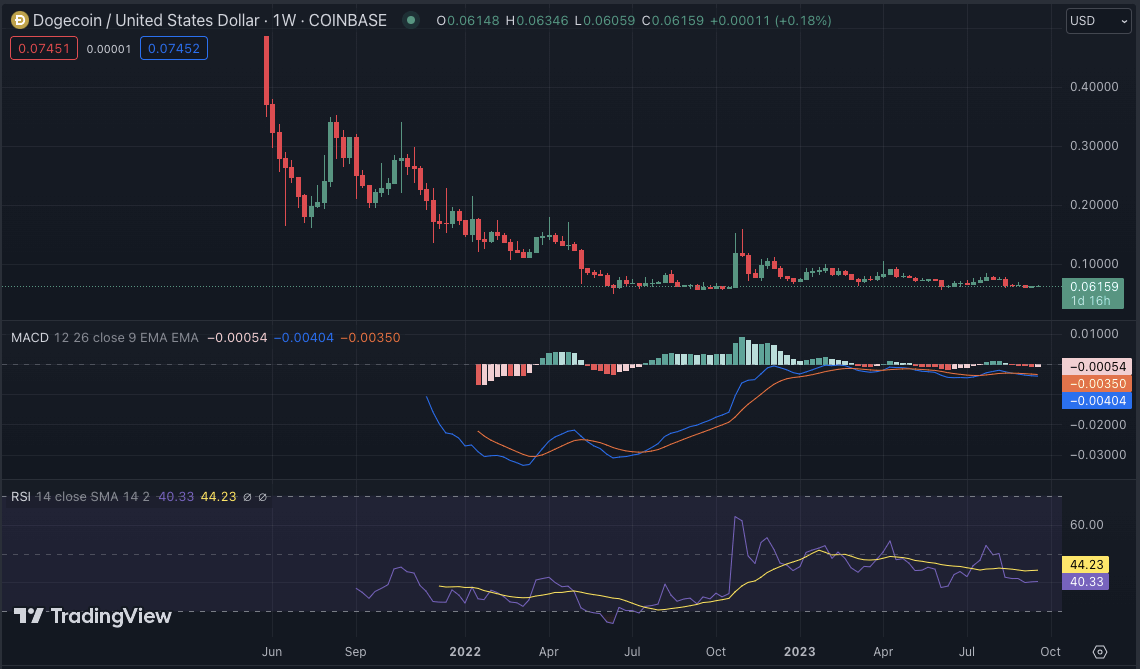
The technical indicators for DOGE/USD show that the 20-SMA is acting as a resistance level, with the 50-EMA trending below, indicating bearish pressure. The MACD indicator has also turned bearish, suggesting a potential crossover in the short term. The RSI is hovering around the 40.00 level, indicating a balance between buying and selling pressure.
DOGE/USD的技術指標顯示,20-SMA作為阻力位,50-EMA趨向下方,顯示看跌壓力。 MACD指標也轉為看跌,暗示短期內可能出現交叉。 RSI徘徊在40.00水平附近,顯示買賣壓力平衡。
LTC/USD
萊特幣/美元
Litecoin price analysis shows that LTC has been trading in a tight range between $63.30 and $68.00 for the past week. The sideways movement suggests indecision in the market, with neither bulls nor bears taking control. The bulls and bears have been in a tug-of-war near the key support level of $65.00, with LTC/USD currently trading at $66.33, recording an increase of 0.33% in the past 24 hours and a 7-day loss of 0.95%.
萊特幣價格分析顯示,過去一週 LTC 一直在 63.30 美元至 68.00 美元之間窄幅波動。橫盤走勢顯示市場猶豫不決,多頭和空頭都沒有佔據主導地位。多空在65.00美元關鍵支撐位附近展開拉鋸戰,LTC/USD目前交投於66.33美元,過去24小時上漲0.33%,7日跌幅為0.95% 。
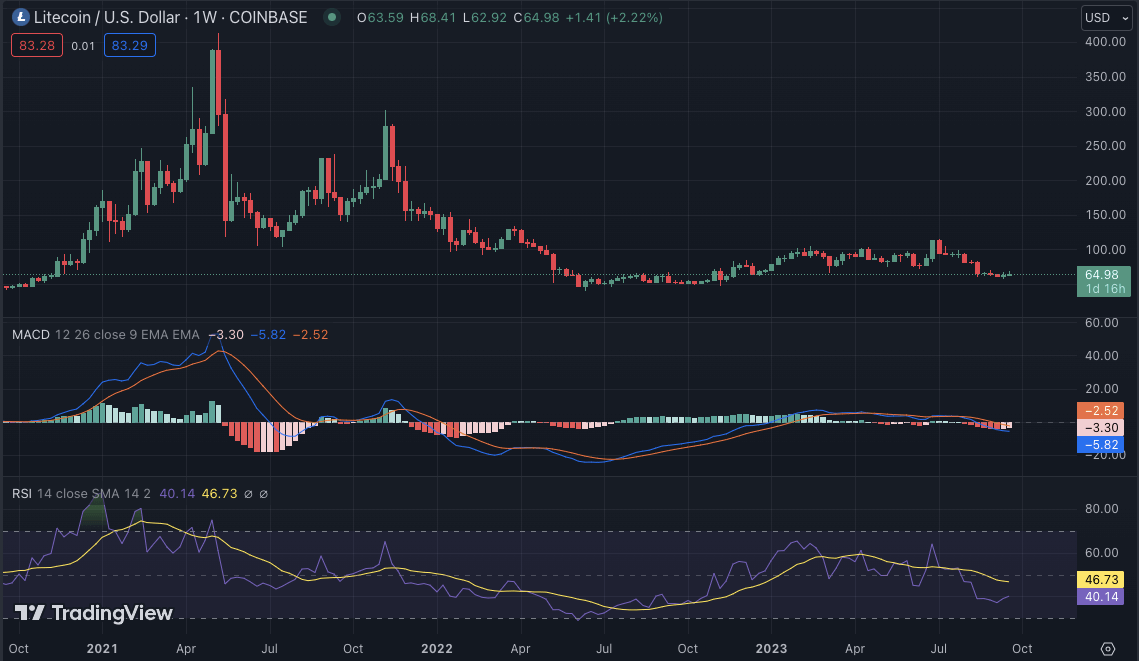
The technical indicators for LTC/USD are currently in neutral territory, with the moving averages closely tracking the price and the MACD indicator hovering around the zero line. The RSI is also ranging between 40 and 50, indicating indecision in the market. The 20-EMA is currently below the price and acting as a support level, while the 50-SMA is above, suggesting potential resistance.
LTC/USD的技術指標目前處於中性區域,移動平均線密切追蹤價格,MACD指標徘徊在零線附近。 RSI 也在 40 至 50 之間波動,顯示市場猶豫不決。 20 均線目前位於價格下方,充當支撐位,而 50 移動平均線位於價格上方,顯示潛在阻力。
Weekly Crypto Analysis Conclusion
每週加密分析結論
Overall, the crypto market is in a period of consolidation, with most coins trading within range-bound conditions. The bullish and bearish divergences being seen on many coins indicate that there is a tug-of-war occurring between the bulls and bears. In the near term, it is likely that some coins will break out of their current levels and begin to rally higher, while others might drop lower.
整體而言,加密貨幣市場正處於整合時期,大多數代幣的交易都在區間內進行。許多代幣上出現的看漲和看跌背離顯示多頭和空頭之間正在發生拉鋸戰。短期內,一些代幣可能會突破當前水平並開始上漲,而另一些代幣可能會下跌。
 CFN
CFN U_Today
 Thecoinrepublic.com
 DogeHome
 Optimisus
 Optimisus
 DeFi Planet
 Crypto Daily™
 BlockchainReporter


