XRP Price Prediction: Symmetrical Triangle Breakout Signals Potential Surge
The crypto market has been relatively subdued this week. Most altcoins have experienced a correction in the range of 5-15%, while Bitcoin has remained mostly stable between $65,300 and $65,700, despite news of BlackRock purchasing more BTC.
However, XRP has been an exception, rising by 6.5% today. It is currently trading just below $0.63. XRP has a history of defying market trends.
Analyst "Mikybull" published an XRP price prediction on Twitter, which has gained significant attention. XRP boasts a large community, and Mikybull has over 73k followers, so the prediction's popularity is unsurprising.
XRP Chart Analysis
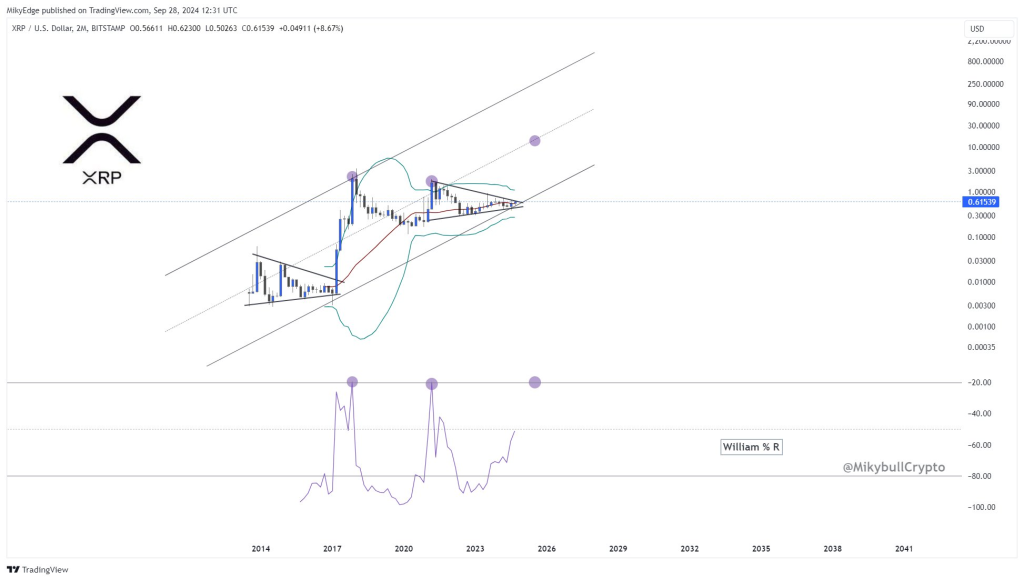
The XRP chart indicates that the price is approaching the end of a symmetrical triangle, a consolidation pattern that often precedes a significant price movement. The price is currently trading within a range defined by converging trend lines, suggesting a breakout may be imminent as XRP nears the triangle's apex.

Source: Twitter/@MikybullCrypto
The chart also displays an ascending channel formed by two parallel lines. XRP has historically respected this channel, bouncing off its lower boundary multiple times. The lower trend line provides strong support, while the upper channel line represents key resistance.
Currently, XRP is hovering near the midpoint of the channel, potentially poised to test the upper boundary if it breaks out of the symmetrical triangle.
XRP Price Targets and Indicators
The immediate resistance for XRP is in the $0.63-$0.64 range, with the current price at approximately $0.62. This level will likely be a critical decision point for XRP's next move. If the price breaks upward, Mikybull predicts a mid-term target of $10, with a more ambitious projection of $20 aligning with the upper boundary of the ascending channel.
The chart also incorporates Bollinger Bands, which are currently constricting around the price. This volatility contraction often precedes a significant move, supporting the potential for a breakout from the symmetrical triangle.
An RSI indicator (specifically the Williams %R) is shown below the chart. It is approaching a bullish level, implying that XRP could be in the early stages of an upward movement. The indicator highlights historical peaks that correspond to substantial price increases, particularly during the significant bull runs XRP experienced in 2017 and 2021. A similar peak seems to be emerging now.


 Optimisus
 Cryptopolitan_News
 DogeHome
 Cryptopolitan
 crypto.ro English
 Crypto News Land
 ETHNews


