

XRP Price Prediction: Symmetrical Triangle Breakout Signals Potential Surge
XRP 가격 예측: 대칭 삼각형 돌파 신호 잠재적 급등
The crypto market has been relatively subdued this week. Most altcoins have experienced a correction in the range of 5-15%, while Bitcoin has remained mostly stable between $65,300 and $65,700, despite news of BlackRock purchasing more BTC.
이번 주 암호화폐 시장은 상대적으로 침체되었습니다. 대부분의 알트코인은 5~15% 범위의 조정을 경험했으며, BlackRock이 더 많은 BTC를 구매한다는 소식에도 불구하고 비트코인은 65,300~65,700달러 사이에서 대부분 안정적으로 유지되었습니다.
However, XRP has been an exception, rising by 6.5% today. It is currently trading just below $0.63. XRP has a history of defying market trends.
그러나 XRP는 예외적으로 오늘 6.5% 상승했습니다. 현재 0.63달러 바로 아래에서 거래되고 있습니다. XRP는 시장 동향을 무시한 역사를 가지고 있습니다.
Analyst "Mikybull" published an XRP price prediction on Twitter, which has gained significant attention. XRP boasts a large community, and Mikybull has over 73k followers, so the prediction's popularity is unsurprising.
분석가 "Mikybull"은 트위터에 XRP 가격 예측을 게시하여 상당한 주목을 받았습니다. XRP는 대규모 커뮤니티를 자랑하며 Mikybull은 73,000명이 넘는 팔로어를 보유하고 있으므로 예측의 인기는 놀랍지 않습니다.
XRP Chart Analysis
XRP 차트 분석
The XRP chart indicates that the price is approaching the end of a symmetrical triangle, a consolidation pattern that often precedes a significant price movement. The price is currently trading within a range defined by converging trend lines, suggesting a breakout may be imminent as XRP nears the triangle's apex.
XRP 차트는 가격이 대칭 삼각형의 끝 부분에 접근하고 있음을 나타냅니다. 이는 종종 상당한 가격 변동에 앞서 통합 패턴입니다. 가격은 현재 수렴 추세선으로 정의된 범위 내에서 거래되고 있으며, 이는 XRP가 삼각형 정점에 가까워짐에 따라 돌파가 임박할 수 있음을 시사합니다.
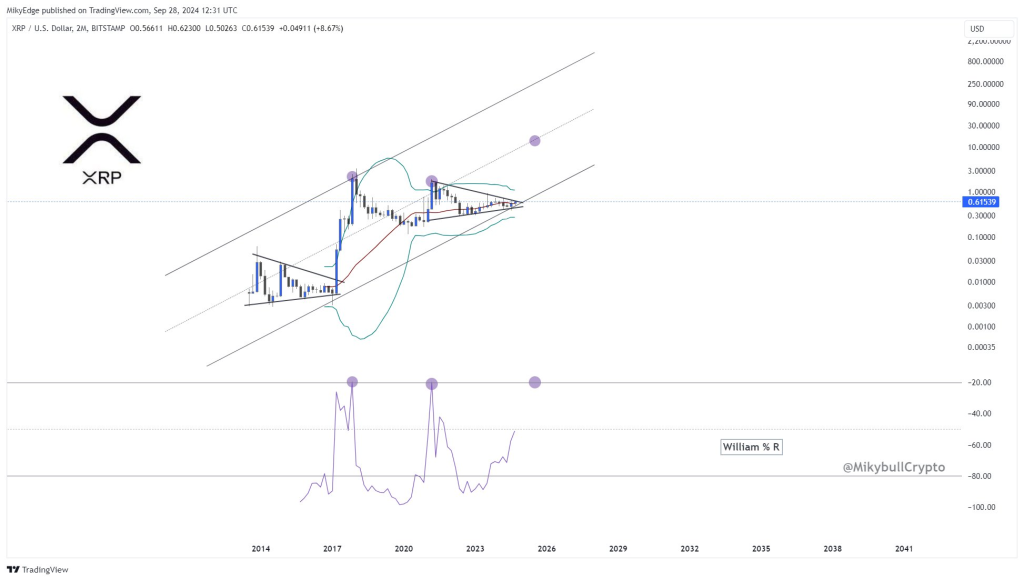
Source: Twitter/@MikybullCrypto
출처: Twitter/@MikybullCrypto
The chart also displays an ascending channel formed by two parallel lines. XRP has historically respected this channel, bouncing off its lower boundary multiple times. The lower trend line provides strong support, while the upper channel line represents key resistance.
차트에는 두 개의 평행선으로 구성된 상승 채널도 표시됩니다. XRP는 역사적으로 이 채널을 존중하여 하위 경계를 여러 번 벗어났습니다. 하단 추세선은 강력한 지지를 제공하고 상단 채널선은 주요 저항을 나타냅니다.
Currently, XRP is hovering near the midpoint of the channel, potentially poised to test the upper boundary if it breaks out of the symmetrical triangle.
현재 XRP는 채널의 중간 지점 근처에 맴돌고 있으며 대칭 삼각형을 벗어나면 상한 경계를 테스트할 준비가 되어 있습니다.
XRP Price Targets and Indicators
XRP 가격 목표 및 지표
The immediate resistance for XRP is in the $0.63-$0.64 range, with the current price at approximately $0.62. This level will likely be a critical decision point for XRP's next move. If the price breaks upward, Mikybull predicts a mid-term target of $10, with a more ambitious projection of $20 aligning with the upper boundary of the ascending channel.
XRP의 즉각적인 저항은 $0.63-$0.64 범위에 있으며 현재 가격은 약 $0.62입니다. 이 수준은 XRP의 다음 움직임에 대한 중요한 결정 포인트가 될 것입니다. 가격이 상승할 경우 Mikybull은 중기 목표를 10달러로 예측하고, 상승 채널의 상한선에 맞춰 더 야심찬 20달러를 예상합니다.
The chart also incorporates Bollinger Bands, which are currently constricting around the price. This volatility contraction often precedes a significant move, supporting the potential for a breakout from the symmetrical triangle.
차트에는 현재 가격을 제한하고 있는 볼린저 밴드도 포함되어 있습니다. 이러한 변동성 수축은 종종 중요한 움직임에 앞서 나타나 대칭 삼각형에서 이탈할 가능성을 뒷받침합니다.
An RSI indicator (specifically the Williams %R) is shown below the chart. It is approaching a bullish level, implying that XRP could be in the early stages of an upward movement. The indicator highlights historical peaks that correspond to substantial price increases, particularly during the significant bull runs XRP experienced in 2017 and 2021. A similar peak seems to be emerging now.
RSI 지표(특히 Williams %R)가 차트 아래에 표시됩니다. 이는 강세 수준에 접근하고 있으며, 이는 XRP가 상승 움직임의 초기 단계에 있을 수 있음을 의미합니다. 이 지표는 특히 2017년과 2021년에 XRP가 경험한 상당한 강세 기간 동안 상당한 가격 상승에 해당하는 역사적 최고점을 강조합니다. 현재 비슷한 최고점이 나타나고 있는 것으로 보입니다.
 DogeHome
 Optimisus
 Crypto News Land
 Optimisus
 Cryptopolitan_News
 Cryptopolitan
 crypto.ro English


