XRP Price Prediction: Symmetrical Triangle Breakout Signals Potential Surge
Prédiction des prix XRP : une rupture de triangle symétrique signale une augmentation potentielle
The crypto market has been relatively subdued this week. Most altcoins have experienced a correction in the range of 5-15%, while Bitcoin has remained mostly stable between $65,300 and $65,700, despite news of BlackRock purchasing more BTC.
Le marché de la cryptographie a été relativement calme cette semaine. La plupart des altcoins ont connu une correction de l'ordre de 5 à 15 %, tandis que Bitcoin est resté globalement stable entre 65 300 $ et 65 700 $, malgré l'annonce de BlackRock achetant davantage de BTC.
However, XRP has been an exception, rising by 6.5% today. It is currently trading just below $0.63. XRP has a history of defying market trends.
Cependant, le XRP fait exception, avec une hausse de 6,5 % aujourd'hui. Il se négocie actuellement juste en dessous de 0,63 $. XRP a toujours défié les tendances du marché.
Analyst "Mikybull" published an XRP price prediction on Twitter, which has gained significant attention. XRP boasts a large community, and Mikybull has over 73k followers, so the prediction's popularity is unsurprising.
L'analyste "Mikybull" a publié une prévision de prix XRP sur Twitter, qui a retenu beaucoup d'attention. XRP possède une grande communauté et Mikybull compte plus de 73 000 abonnés, la popularité de la prédiction n'est donc pas surprenante.
XRP Chart Analysis
Analyse des graphiques XRP
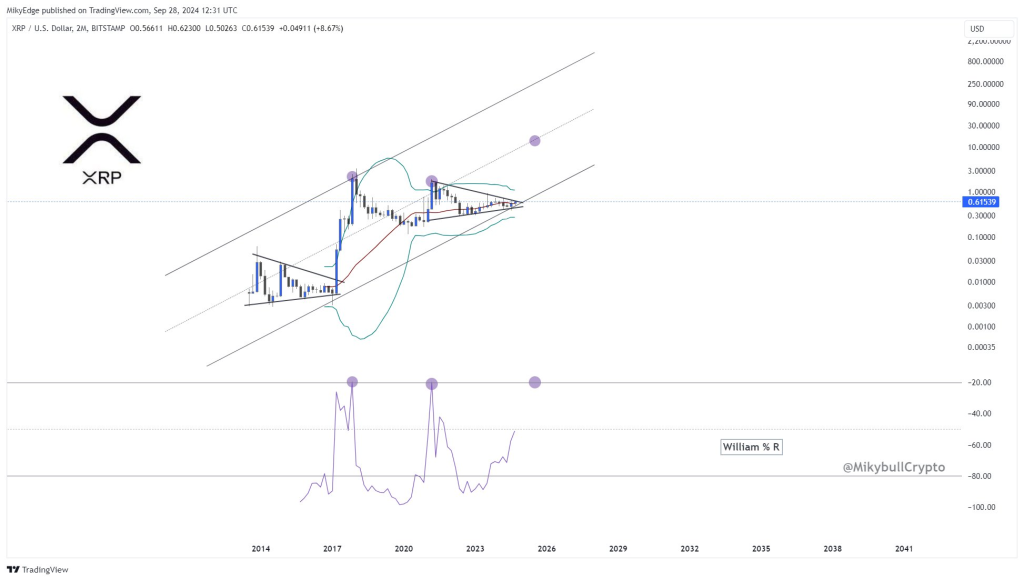
The XRP chart indicates that the price is approaching the end of a symmetrical triangle, a consolidation pattern that often precedes a significant price movement. The price is currently trading within a range defined by converging trend lines, suggesting a breakout may be imminent as XRP nears the triangle's apex.
Le graphique XRP indique que le prix approche de la fin d'un triangle symétrique, un modèle de consolidation qui précède souvent un mouvement de prix important. Le prix se négocie actuellement dans une fourchette définie par des lignes de tendance convergentes, ce qui suggère qu'une cassure pourrait être imminente à mesure que le XRP se rapproche du sommet du triangle.

Source: Twitter/@MikybullCrypto
Source : Twitter/@MikybullCrypto
The chart also displays an ascending channel formed by two parallel lines. XRP has historically respected this channel, bouncing off its lower boundary multiple times. The lower trend line provides strong support, while the upper channel line represents key resistance.
Le graphique affiche également un canal ascendant formé de deux lignes parallèles. XRP a toujours respecté ce canal, rebondissant plusieurs fois sur sa limite inférieure. La ligne de tendance inférieure fournit un support solide, tandis que la ligne du canal supérieur représente une résistance clé.
Currently, XRP is hovering near the midpoint of the channel, potentially poised to test the upper boundary if it breaks out of the symmetrical triangle.
Actuellement, XRP plane près du milieu du canal, potentiellement prêt à tester la limite supérieure s'il sort du triangle symétrique.
XRP Price Targets and Indicators
Objectifs et indicateurs de prix XRP
The immediate resistance for XRP is in the $0.63-$0.64 range, with the current price at approximately $0.62. This level will likely be a critical decision point for XRP's next move. If the price breaks upward, Mikybull predicts a mid-term target of $10, with a more ambitious projection of $20 aligning with the upper boundary of the ascending channel.
La résistance immédiate du XRP se situe entre 0,63 $ et 0,64 $, le prix actuel étant d'environ 0,62 $. Ce niveau sera probablement un point de décision critique pour la prochaine étape du XRP. Si le prix casse à la hausse, Mikybull prédit un objectif à moyen terme de 10 $, avec une projection plus ambitieuse de 20 $ s'alignant sur la limite supérieure du canal ascendant.
The chart also incorporates Bollinger Bands, which are currently constricting around the price. This volatility contraction often precedes a significant move, supporting the potential for a breakout from the symmetrical triangle.
Le graphique intègre également les bandes de Bollinger, qui resserrent actuellement le prix. Cette contraction de la volatilité précède souvent un mouvement significatif, favorisant le potentiel d'une cassure du triangle symétrique.
An RSI indicator (specifically the Williams %R) is shown below the chart. It is approaching a bullish level, implying that XRP could be in the early stages of an upward movement. The indicator highlights historical peaks that correspond to substantial price increases, particularly during the significant bull runs XRP experienced in 2017 and 2021. A similar peak seems to be emerging now.
Un indicateur RSI (en particulier le Williams %R) est affiché sous le graphique. Il se rapproche d’un niveau haussier, ce qui implique que le XRP pourrait en être aux premiers stades d’un mouvement haussier. L'indicateur met en évidence des pics historiques qui correspondent à des augmentations de prix substantielles, en particulier lors des importantes courses haussières que XRP a connues en 2017 et 2021. Un pic similaire semble émerger maintenant.


 Inside Bitcoins
 CoinPedia News
 CoinPedia News
 CFN
CFN DogeHome
 CoinPedia News
 Cointelegraph
 DT News


