

XRP Price Prediction: Symmetrical Triangle Breakout Signals Potential Surge
XRP価格予測:対称トライアングルブレイクアウトシグナル潜在的サージ
The crypto market has been relatively subdued this week. Most altcoins have experienced a correction in the range of 5-15%, while Bitcoin has remained mostly stable between $65,300 and $65,700, despite news of BlackRock purchasing more BTC.
今週の仮想通貨市場は比較的落ち着いた展開となった。ほとんどのアルトコインは5〜15%の範囲で調整を経験していますが、ビットコインは、ブラックロックがBTCを追加購入するというニュースにもかかわらず、65,300〜65,700ドルの間でほぼ安定しています。
However, XRP has been an exception, rising by 6.5% today. It is currently trading just below $0.63. XRP has a history of defying market trends.
ただし、XRPは例外で、今日は6.5%上昇しました。現在は0.63ドルをわずかに下回る水準で取引されている。 XRPには市場のトレンドに反抗してきた歴史があります。
Analyst "Mikybull" published an XRP price prediction on Twitter, which has gained significant attention. XRP boasts a large community, and Mikybull has over 73k followers, so the prediction's popularity is unsurprising.
アナリスト「Mikybull」氏がTwitterでXRP価格予測を公開し、大きな注目を集めました。 XRP は大規模なコミュニティを誇り、Mikybull には 73,000 人を超えるフォロワーがいることから、この予測の人気は驚くべきことではありません。
XRP Chart Analysis
XRPチャート分析
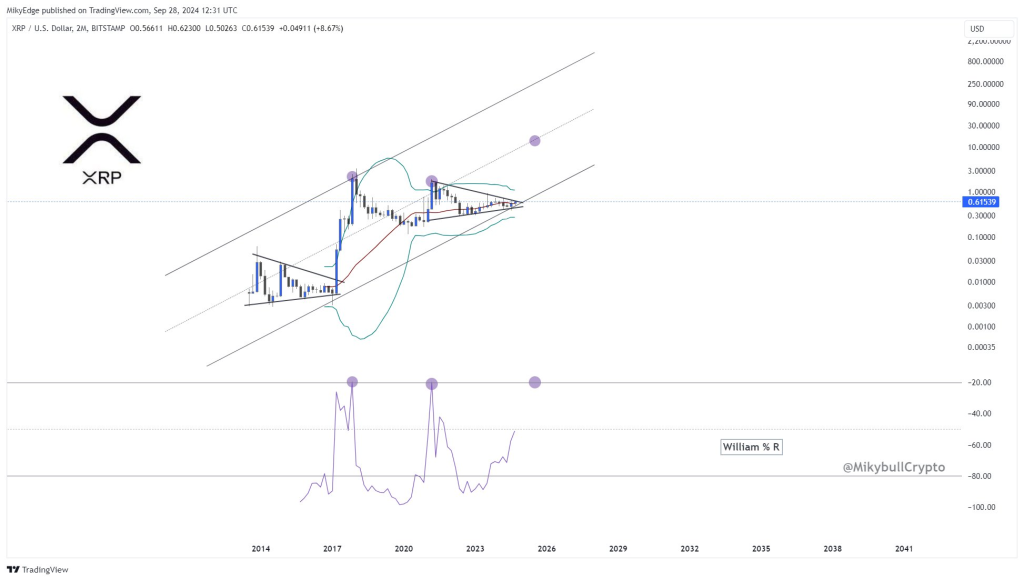
The XRP chart indicates that the price is approaching the end of a symmetrical triangle, a consolidation pattern that often precedes a significant price movement. The price is currently trading within a range defined by converging trend lines, suggesting a breakout may be imminent as XRP nears the triangle's apex.
XRPチャートは、価格が対称的な三角形の終わりに近づいていることを示しており、これは大きな価格変動に先立ってよく見られる統合パターンです。価格は現在、収束するトレンドラインによって定義される範囲内で取引されており、XRPがトライアングルの頂点に近づくにつれてブレイクアウトが差し迫っている可能性があることを示唆しています。
Source: Twitter/@MikybullCrypto
出典: Twitter/@MikybullCrypto
The chart also displays an ascending channel formed by two parallel lines. XRP has historically respected this channel, bouncing off its lower boundary multiple times. The lower trend line provides strong support, while the upper channel line represents key resistance.
チャートには、2 本の平行線で形成される上昇チャネルも表示されます。 XRPは歴史的にこのチャネルを尊重しており、その下限から何度も跳ね返りました。下部のトレンドラインは強力なサポートを提供し、上部のチャネルラインは重要な抵抗を示します。
Currently, XRP is hovering near the midpoint of the channel, potentially poised to test the upper boundary if it breaks out of the symmetrical triangle.
現在、XRPはチャネルの中点付近で推移しており、対称三角形を抜け出せば上限を試す可能性がある。
XRP Price Targets and Indicators
XRP価格の目標と指標
The immediate resistance for XRP is in the $0.63-$0.64 range, with the current price at approximately $0.62. This level will likely be a critical decision point for XRP's next move. If the price breaks upward, Mikybull predicts a mid-term target of $10, with a more ambitious projection of $20 aligning with the upper boundary of the ascending channel.
XRPの当面の抵抗線は0.63ドルから0.64ドルの範囲にあり、現在の価格は約0.62ドルです。このレベルはおそらくXRPの次の動きにとって重要な決定点となるでしょう。価格が上向きにブレイクした場合、Mikybull は中期目標を 10 ドルと予測し、上昇チャネルの上限に合わせて 20 ドルというより野心的な予測を立てます。
The chart also incorporates Bollinger Bands, which are currently constricting around the price. This volatility contraction often precedes a significant move, supporting the potential for a breakout from the symmetrical triangle.
チャートには、現在価格付近で収縮しているボリンジャーバンドも組み込まれています。このボラティリティの縮小は重要な動きに先立って起こることが多く、対称的なトライアングルからのブレイクアウトの可能性を裏付けています。
An RSI indicator (specifically the Williams %R) is shown below the chart. It is approaching a bullish level, implying that XRP could be in the early stages of an upward movement. The indicator highlights historical peaks that correspond to substantial price increases, particularly during the significant bull runs XRP experienced in 2017 and 2021. A similar peak seems to be emerging now.
RSI インジケーター (具体的にはウィリアムズ %R) がチャートの下に表示されます。これは強気の水準に近づいており、XRPが上昇の初期段階にある可能性があることを示唆しています。この指標は、特に2017年と2021年にXRPが経験した大幅な上昇期間中に、大幅な価格上昇に対応する歴史的なピークを強調しています。現在、同様のピークが出現しているようです。
 DogeHome
 Optimisus
 Crypto News Land
 Optimisus
 Cryptopolitan_News
 Cryptopolitan
 crypto.ro English


