XRP Price Prediction: Symmetrical Triangle Breakout Signals Potential Surge
XRP 价格预测:对称三角形突破信号潜在飙升
The crypto market has been relatively subdued this week. Most altcoins have experienced a correction in the range of 5-15%, while Bitcoin has remained mostly stable between $65,300 and $65,700, despite news of BlackRock purchasing more BTC.
本周加密市场相对低迷。大多数山寨币经历了 5-15% 的回调,而比特币则基本稳定在 65,300 美元至 65,700 美元之间,尽管有消息称贝莱德购买了更多 BTC。
However, XRP has been an exception, rising by 6.5% today. It is currently trading just below $0.63. XRP has a history of defying market trends.
然而,XRP 是一个例外,今天上涨了 6.5%。目前其交易价格略低于 0.63 美元。 XRP 有着违背市场趋势的历史。
Analyst "Mikybull" published an XRP price prediction on Twitter, which has gained significant attention. XRP boasts a large community, and Mikybull has over 73k followers, so the prediction's popularity is unsurprising.
分析师“Mikybull”在 Twitter 上发布了 XRP 价格预测,引起了广泛关注。 XRP 拥有庞大的社区,Mikybull 拥有超过 73,000 名追随者,因此该预测的受欢迎程度并不令人意外。
XRP Chart Analysis
XRP图表分析
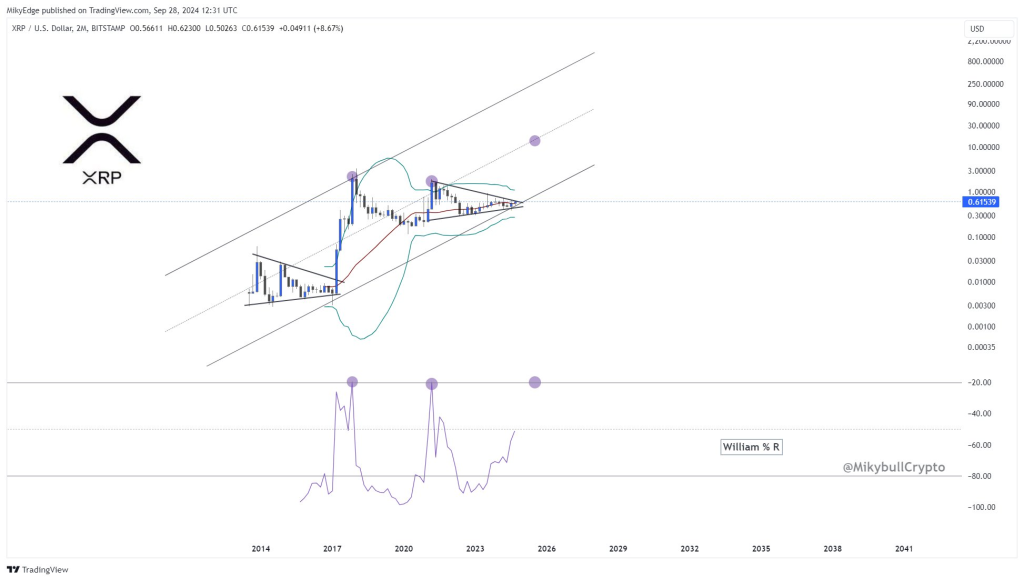
The XRP chart indicates that the price is approaching the end of a symmetrical triangle, a consolidation pattern that often precedes a significant price movement. The price is currently trading within a range defined by converging trend lines, suggesting a breakout may be imminent as XRP nears the triangle's apex.
XRP 图表表明价格正在接近对称三角形的末端,这是一种盘整模式,通常先于重大价格变动。价格目前交易在由聚合趋势线定义的范围内,表明随着 XRP 接近三角形顶点,突破可能即将到来。

Source: Twitter/@MikybullCrypto
来源:Twitter/@MikybullCrypto
The chart also displays an ascending channel formed by two parallel lines. XRP has historically respected this channel, bouncing off its lower boundary multiple times. The lower trend line provides strong support, while the upper channel line represents key resistance.
该图表还显示由两条平行线形成的上升通道。 XRP 历来尊重该通道,多次从其下限反弹。下方趋势线提供强劲支撑,上方通道线代表关键阻力。
Currently, XRP is hovering near the midpoint of the channel, potentially poised to test the upper boundary if it breaks out of the symmetrical triangle.
目前,XRP 徘徊在通道中点附近,如果突破对称三角形,可能会测试上限。
XRP Price Targets and Indicators
XRP 价格目标和指标
The immediate resistance for XRP is in the $0.63-$0.64 range, with the current price at approximately $0.62. This level will likely be a critical decision point for XRP's next move. If the price breaks upward, Mikybull predicts a mid-term target of $10, with a more ambitious projection of $20 aligning with the upper boundary of the ascending channel.
XRP 的直接阻力位于 0.63-0.64 美元范围内,当前价格约为 0.62 美元。这一水平可能是 XRP 下一步走势的关键决策点。如果价格向上突破,Mikybull 预测中期目标为 10 美元,更雄心勃勃的预测为 20 美元,与上升通道的上限保持一致。
The chart also incorporates Bollinger Bands, which are currently constricting around the price. This volatility contraction often precedes a significant move, supporting the potential for a breakout from the symmetrical triangle.
该图表还包含布林线,目前布林线围绕价格收缩。这种波动性收缩通常先于重大走势,支持对称三角形突破的可能性。
An RSI indicator (specifically the Williams %R) is shown below the chart. It is approaching a bullish level, implying that XRP could be in the early stages of an upward movement. The indicator highlights historical peaks that correspond to substantial price increases, particularly during the significant bull runs XRP experienced in 2017 and 2021. A similar peak seems to be emerging now.
RSI 指标(特别是 Williams %R)显示在图表下方。它正在接近看涨水平,这意味着 XRP 可能处于上涨的早期阶段。该指标突出了与价格大幅上涨相对应的历史峰值,特别是在 XRP 在 2017 年和 2021 年经历的大幅牛市期间。现在似乎正在出现类似的峰值。


 DogeHome
 Optimisus
 Crypto News Land
 Optimisus
 Cryptopolitan_News
 Cryptopolitan
 crypto.ro English


