Technical analysis is an essential indicator that investors, especially those trading in the futures market, need to constantly monitor in the cryptocurrency market. So what does technical analysis tell us about Dogecoin, which is currently trading at $0.07749? Let’s examine the detailed charts and important support and resistance levels.
El análisis técnico es un indicador esencial que los inversores, especialmente aquellos que operan en el mercado de futuros, deben monitorear constantemente en el mercado de criptomonedas. Entonces, ¿qué nos dice el análisis técnico sobre Dogecoin, que actualmente cotiza a 0,07749 dólares? Examinemos los gráficos detallados y los importantes niveles de soporte y resistencia.
Dogecoin Daily Chart Analysis
Análisis del gráfico diario de Dogecoin
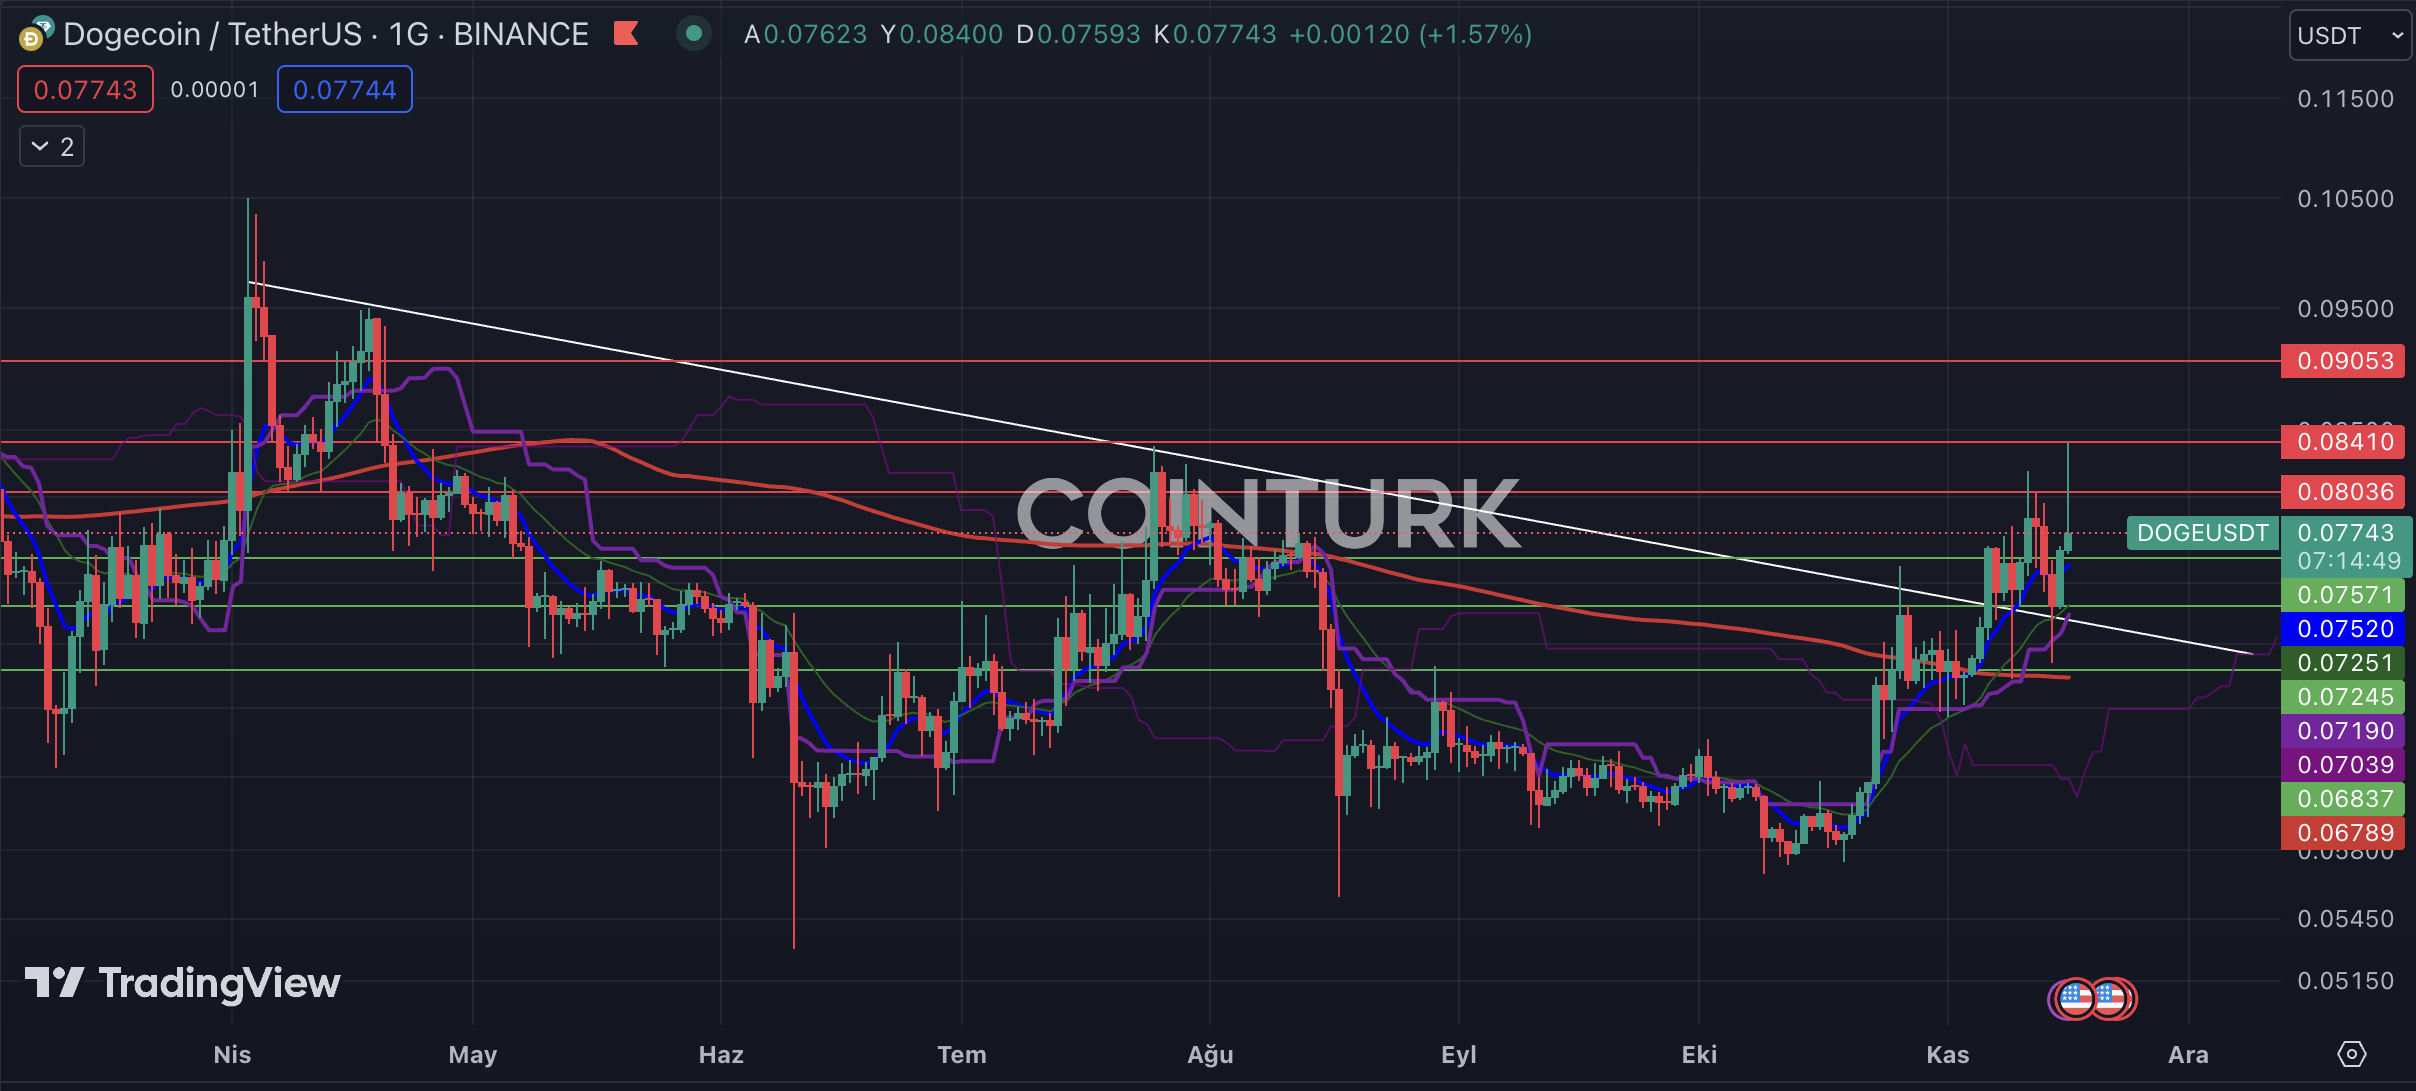
The first significant breakout on the Dogecoin daily chart is the recent break of the downtrend that has been ongoing since April. Although the price has made attempts, it has not been able to surpass the resistance levels and overcome the trendline. However, the role of this resistance line as support is an important factor for the DOGE price. Additionally, the EMA 200 (red line) acting as support is another notable aspect for DOGE.
La primera ruptura significativa en el gráfico diario de Dogecoin es la reciente ruptura de la tendencia bajista que ha estado en curso desde abril. Aunque el precio ha hecho intentos, no ha podido superar los niveles de resistencia y superar la línea de tendencia. Sin embargo, el papel de esta línea de resistencia como soporte es un factor importante para el precio de DOGE. Además, la EMA 200 (línea roja) que actúa como soporte es otro aspecto notable para DOGE.
The important support levels to watch for DOGE are as follows: $0.07571, $0.07245, and $0.06837. Especially if the daily bar closes below $0.07245, the breakdown of the downtrend will become invalid and result in a loss of momentum for the DOGE price.
Los niveles de soporte importantes a tener en cuenta para DOGE son los siguientes: USD 0,07571, USD 0,07245 y USD 0,06837. Especialmente si la barra diaria cierra por debajo de USD 0,07245, la ruptura de la tendencia bajista dejará de ser válida y resultará en una pérdida de impulso para el precio de DOGE.
The significant resistance levels to watch for DOGE are as follows: $0.08036, $0.08410, and $0.09053. In particular, if the daily bar closes above the $0.08410 level, it will help DOGE gain noticeable momentum.
Los niveles de resistencia importantes a tener en cuenta para DOGE son los siguientes: USD 0,08036, USD 0,08410 y USD 0,09053. En particular, si la barra diaria cierra por encima del nivel de USD 0,08410, ayudará a DOGE a ganar un impulso notable.

Dogecoin Two-Hour Chart Analysis
Análisis del gráfico de dos horas de Dogecoin
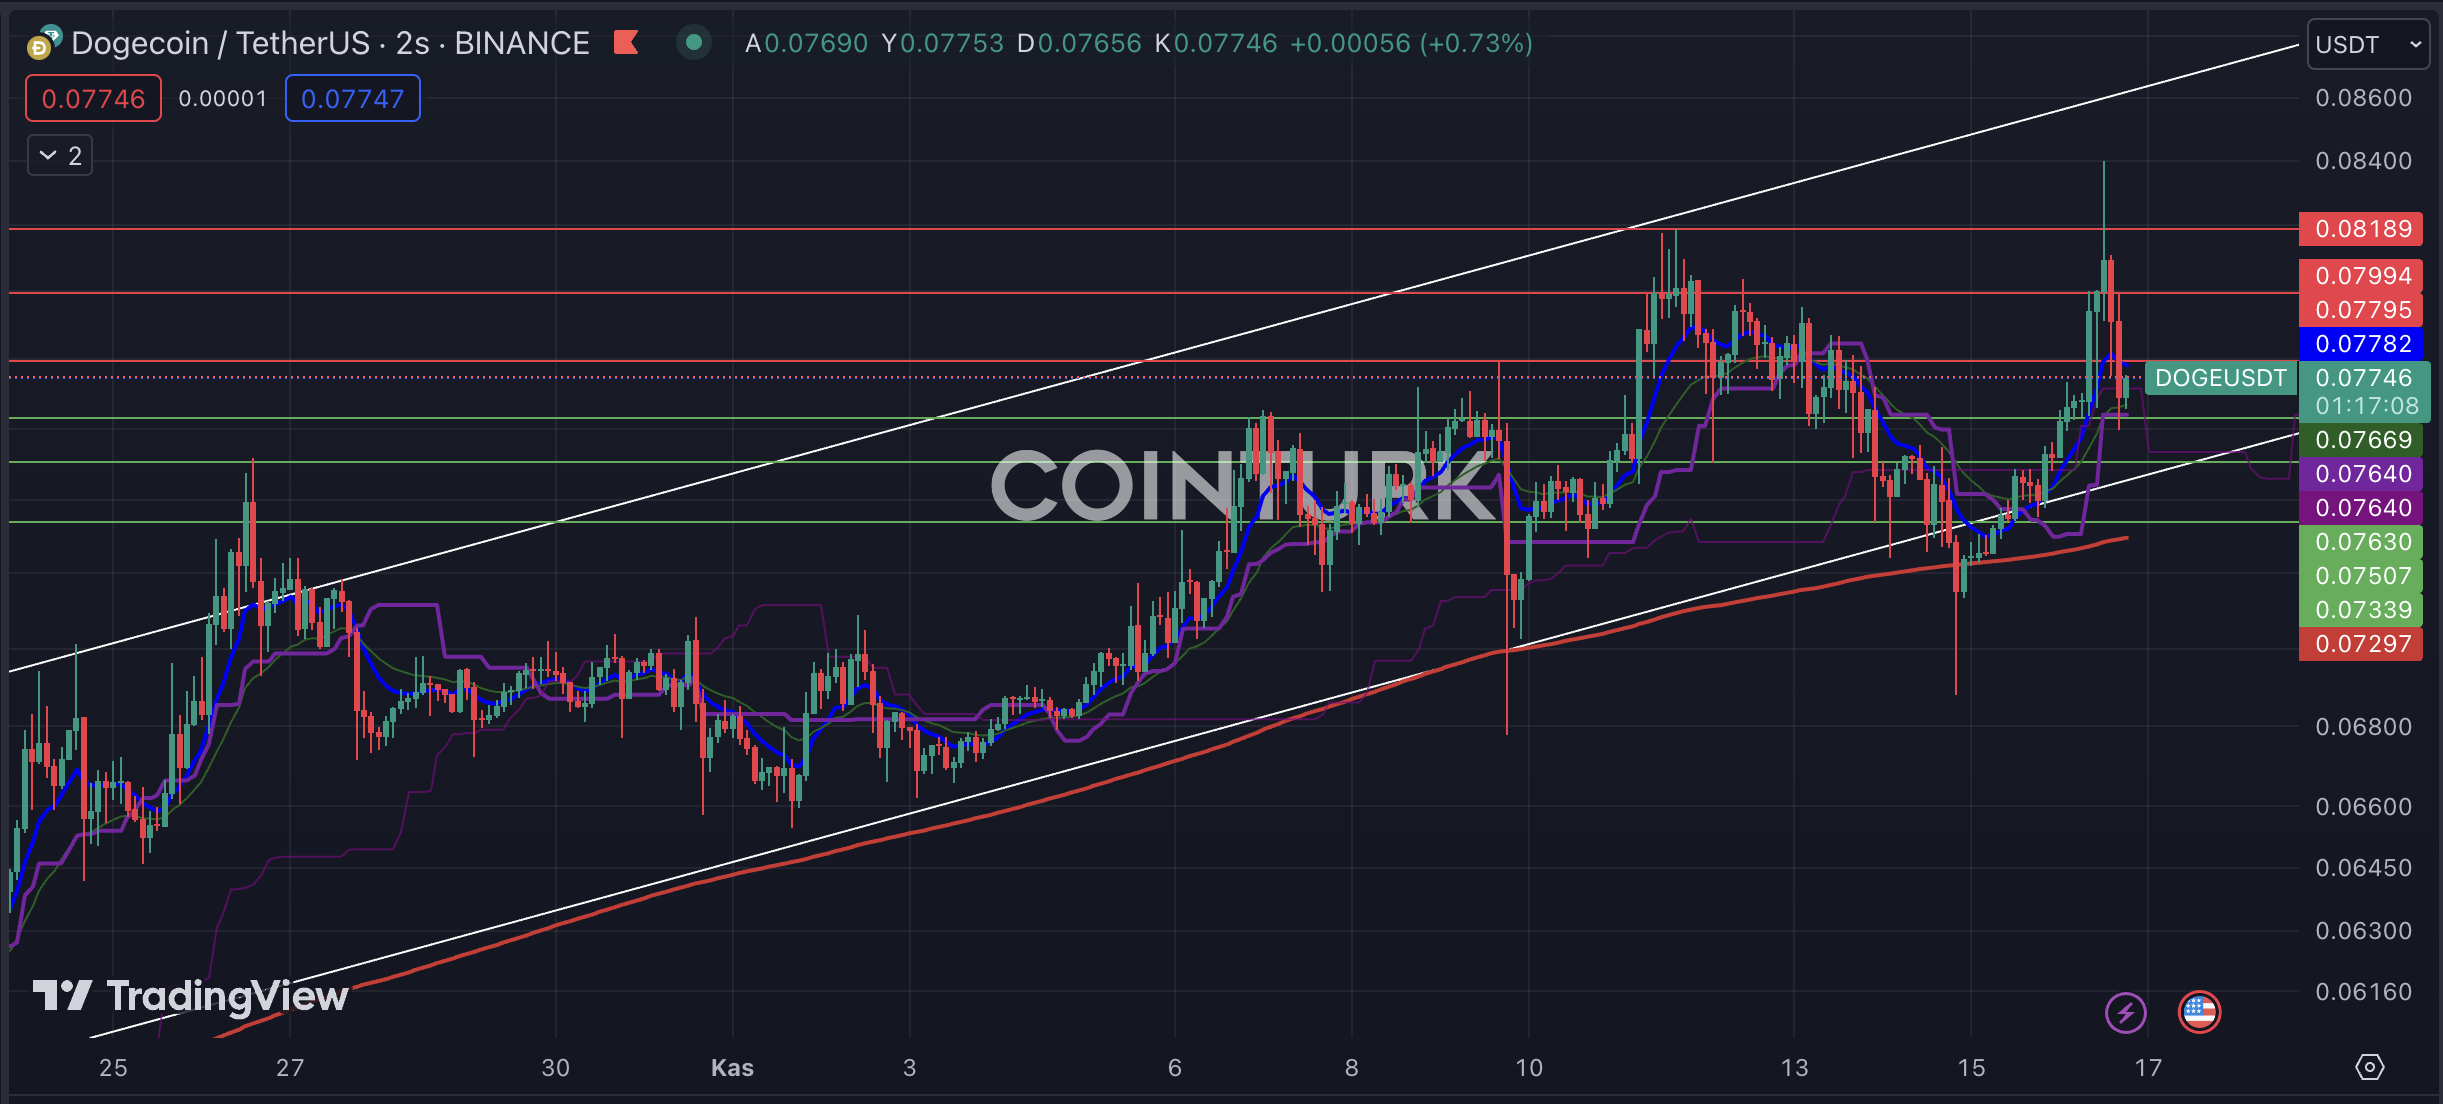
The first notable formation on the two-hour DOGE chart is the ascending channel formation. According to this formation, the price drops that occurred on November 10th and November 15th, dipping below the support line, remained as bear traps for DOGE. The support seen especially in the EMA 200 (red line) region has helped DOGE gain momentum.
La primera formación notable en el gráfico DOGE de dos horas es la formación del canal ascendente. Según esta formación, las caídas de precios que se produjeron el 10 y el 15 de noviembre, cayendo por debajo de la línea de soporte, siguieron siendo trampas bajistas para DOGE. El soporte observado especialmente en la región EMA 200 (línea roja) ha ayudado a DOGE a ganar impulso.
The important support levels to watch for DOGE are as follows: $0.07630, $0.07507, and $0.07339. Especially if the bar closes below $0.07339, it will invalidate the ascending channel formation and lead to a significant loss in DOGE price.
Los niveles de soporte importantes a tener en cuenta para DOGE son los siguientes: USD 0,07630, USD 0,07507 y USD 0,07339. Especialmente si la barra cierra por debajo de USD 0,07339, invalidará la formación del canal ascendente y provocará una pérdida significativa en el precio de DOGE.
The significant resistance levels to watch for DOGE are as follows: $0.07795, $0.07994, and $0.08189. In particular, if the bar closes above the $0.08189 level, it will help DOGE gain momentum.
Los niveles de resistencia importantes a tener en cuenta para DOGE son los siguientes: 0,07795 dólares, 0,07994 dólares y 0,08189 dólares. En particular, si la barra cierra por encima del nivel de $ 0,08189, ayudará a DOGE a ganar impulso.

Continuar leyendo: https://en.coin-turk.com/dogecoin-technical-analysis-important-levels-to-watch/


 DogeHome
 Crypto Intelligence
 DogeHome
 CFN
CFN The Bit Journal
 Crypto Intelligence
 DeFi Planet
 Crypto News Land
 BH NEWS


