


The Bitcoin price remains within a defined trading range, whereas specific alternative cryptocurrencies recently experienced significant increases and are now witnessing investors booking profits.
El precio de Bitcoin se mantiene dentro de un rango de negociación definido, mientras que criptomonedas alternativas específicas experimentaron recientemente aumentos significativos y ahora son testigos de cómo los inversores obtienen ganancias.
Bitcoin has managed to maintain its gains for the year so far; however, it is facing a formidable challenge in surpassing its peak from 17 months ago, which stood at $44,700 and was reached earlier this month. This situation suggests that market participants are exercising caution and refraining from aggressive buying ahead of the decision regarding spot Bitcoin exchange-traded fund (ETF) applications expected in January.
Bitcoin ha logrado mantener sus ganancias en lo que va del año; sin embargo, se enfrenta al formidable desafío de superar su máximo de hace 17 meses, que se situó en 44.700 dólares y se alcanzó a principios de este mes. Esta situación sugiere que los participantes del mercado están actuando con cautela y absteniéndose de realizar compras agresivas antes de la decisión sobre las solicitudes de fondos cotizados en bolsa (ETF) de Bitcoin que se espera para enero.
The outcome of these ETF approvals remains uncertain, and predicting how traders will react is complex. If one or more spot Bitcoin ETFs receive approval, the market’s response is uncertain; it could lead to a “sell the news” scenario if there isn’t strong demand for the ETFs after approval. Conversely, a substantial influx of funds into the ETFs during the initial days could significantly increase Bitcoin’s price.
El resultado de estas aprobaciones de ETF sigue siendo incierto y predecir cómo reaccionarán los operadores es complejo. Si uno o más ETF spot de Bitcoin reciben la aprobación, la respuesta del mercado es incierta; podría conducir a un escenario de “vender las noticias” si no hay una fuerte demanda de los ETF después de su aprobación. Por el contrario, una afluencia sustancial de fondos a los ETF durante los primeros días podría aumentar significativamente el precio de Bitcoin.
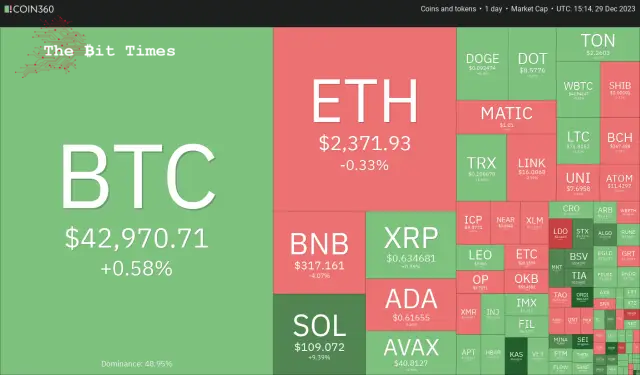
The uncertainty about Bitcoin’s short-term price action has boosted buying interest in altcoins. That is one of the reasons for the drop in Bitcoin’s dominance from about 55% to 51% in the past few days.
La incertidumbre sobre la acción del precio a corto plazo de Bitcoin ha aumentado el interés de compra en altcoins. Esa es una de las razones de la caída del dominio de Bitcoin de alrededor del 55% al 51% en los últimos días.
Will Bitcoin resume its uptrend or succumb to profit booking? Could altcoins continue their outperformance? Let’s analyse the charts of the top 10 cryptocurrencies to find out.
¿Bitcoin reanudará su tendencia alcista o sucumbirá a la reserva de ganancias? ¿Podrían las altcoins continuar con su desempeño superior? Analicemos los gráficos de las 10 principales criptomonedas para descubrirlo.
Bitcoin (BTC) price analysis
Análisis de precios de Bitcoin (BTC)
Bitcoin fell below the 20-day exponential moving average ($42,597) on Dec. 29 but continues to trade inside the ascending triangle pattern.
Bitcoin cayó por debajo del promedio móvil exponencial de 20 días ($42,597) el 29 de diciembre, pero continúa cotizando dentro del patrón de triángulo ascendente.
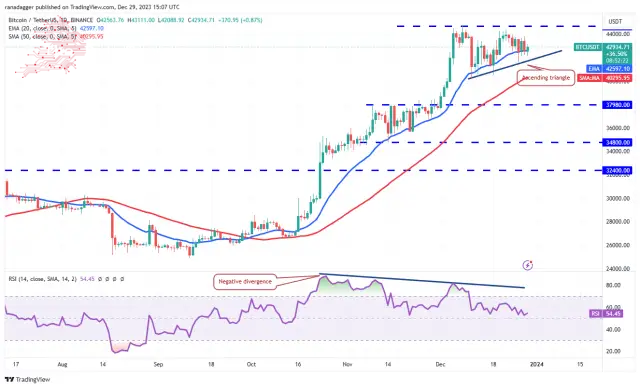
The relative strength index (RSI) has dropped near the midpoint, indicating that the bullish momentum is weakening. Buyers must push the price above $44,700 to complete the triangle and regain control. The BTC/USDT pair could rise to the pattern target of $49,178.
El índice de fuerza relativa (RSI) ha caído cerca del punto medio, lo que indica que el impulso alcista se está debilitando. Los compradores deben elevar el precio por encima de los 44.700 dólares para completar el triángulo y recuperar el control. El par BTC/USDT podría subir al objetivo del patrón de $49,178.
Contrary to this assumption, a break below the triangle will invalidate the bullish setup. That could accelerate selling and sink the pair to the 50-day simple moving average ($40,295). The bulls will try to stop the decline at this level, but if they fail, the next support level will likely be $37,980.
Contrariamente a esta suposición, una ruptura por debajo del triángulo invalidará la configuración alcista. Eso podría acelerar las ventas y hundir el par hasta el promedio móvil simple de 50 días ($40,295). Los alcistas intentarán detener la caída en este nivel, pero si fallan, el próximo nivel de soporte probablemente será 37,980 dólares.
Ether (ETH) price analysis
Análisis de precios de éter (ETH)
Ether closed above the descending triangle pattern on Dec. 27 and tried to start the next leg of the uptrend on Dec. 28.
Ether cerró por encima del patrón de triángulo descendente el 27 de diciembre e intentó iniciar el siguiente tramo de la tendencia alcista el 28 de diciembre.
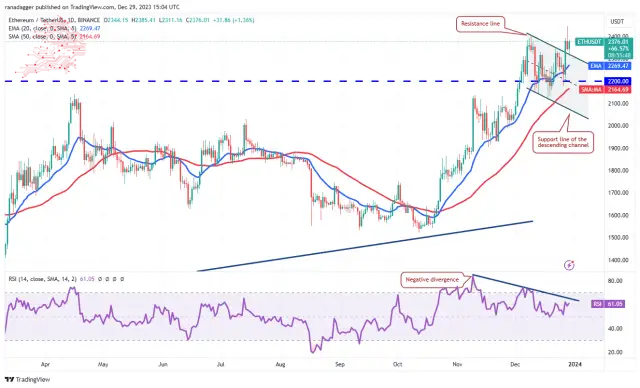
However, the bears were in no mood to give up. They sold at $2,445 and pulled the price back below $2,403. The price dropped to the breakout level from the channel where buyers stepped in. This indicates that the bulls are trying to flip the level into support.
Sin embargo, los bajistas no estaban de humor para darse por vencidos. Se vendieron a 2.445 dólares y bajaron el precio por debajo de 2.403 dólares. El precio cayó al nivel de ruptura desde el canal donde intervinieron los compradores. Esto indica que los alcistas están tratando de convertir el nivel en soporte.
If they do that, the ETH/USDT pair will try to resume the uptrend. The target objective on the upside is $3,000.
Si lo hacen, el par ETH/USDT intentará reanudar la tendencia alcista. El objetivo al alza es de 3.000 dólares.
Meanwhile, the bears are likely to have other plans. They will try to yank the price below the 20-day EMA ($2,269) and start a decline to the channel’s support line near $2,000.
Mientras tanto, es probable que los bajistas tengan otros planes. Intentarán tirar el precio por debajo de la EMA de 20 días ($2269) e iniciar una caída hasta la línea de soporte del canal cerca de $2000.
BNB price analysis
Análisis de precios de BNB
BNB nudged above its pattern target of $333 on Dec. 28 but could not sustain the higher levels. This suggests profit-taking by traders.
BNB superó su objetivo de patrón de 333 dólares el 28 de diciembre, pero no pudo mantener los niveles más altos. Esto sugiere una toma de ganancias por parte de los comerciantes.
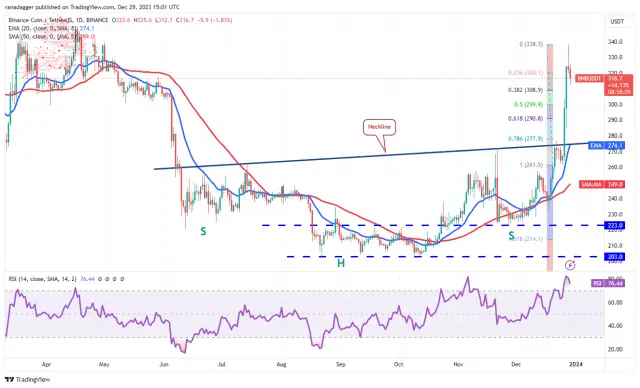
Now, the BNB/USDT pair could pull back to the 50% Fibonacci retracement level of $300, which will likely be a strong support. If the price rebounds off $300, the bulls will again try to push the price toward the formidable hurdle of $350.
Ahora, el par BNB/USDT podría retroceder hasta el nivel de retroceso de Fibonacci del 50% de $300, lo que probablemente será un fuerte soporte. Si el precio rebota en los 300 dólares, los alcistas volverán a intentar empujar el precio hacia el formidable obstáculo de los 350 dólares.
On the other hand, if the $300 support cracks, the correction may extend to the 61.8% Fibonacci retracement level of $291 and then to the neckline. The bulls are expected to protect the neckline with vigour.
Por otro lado, si el soporte de $300 se rompe, la corrección puede extenderse hasta el nivel de retroceso de Fibonacci del 61,8% de $291 y luego hasta la línea de escote. Se espera que los alcistas protejan el escote con vigor.
Solana (SOL) price analysis
Análisis de precios de Solana (SOL)
Solana subió desde el nivel de retroceso de Fibonacci del 50 % de 96 dólares el 29 de diciembre, lo que indica que el sentimiento sigue siendo positivo y los operadores están comprando en las caídas.
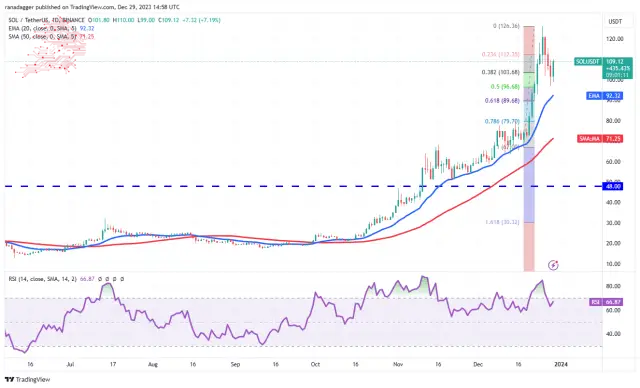
Both moving averages are sloping up, and the RSI is positive, indicating that bulls have the edge. The SOL/USDT pair could rise to the recent high of $126, where the bulls will likely face strong selling by the bears. If bulls overcome this barrier, the pair may jump to $156.
Ambos promedios móviles están subiendo y el RSI es positivo, lo que indica que los alcistas tienen ventaja. El par SOL/USDT podría subir al máximo reciente de $126, donde los alcistas probablemente enfrentarán fuertes ventas por parte de los bajistas. Si los alcistas superan esta barrera, el par puede saltar a 156 dólares.
The bears will have to sink the price below the 20-day EMA ($92) to signal a potential trend change in the near term. The pair could then tumble to the 50-day SMA ($71).
Los bajistas tendrán que hundir el precio por debajo de la EMA de 20 días ($92) para señalar un posible cambio de tendencia en el corto plazo. Luego, el par podría caer hasta la SMA de 50 días ($71).
XRP price analysis
XRP attempted a rally on Dec. 28, but the bulls could not clear the hurdle at the downtrend line.
Análisis de precios de XRP XRP intentó un repunte el 28 de diciembre, pero los alcistas no pudieron superar el obstáculo en la línea de tendencia bajista.
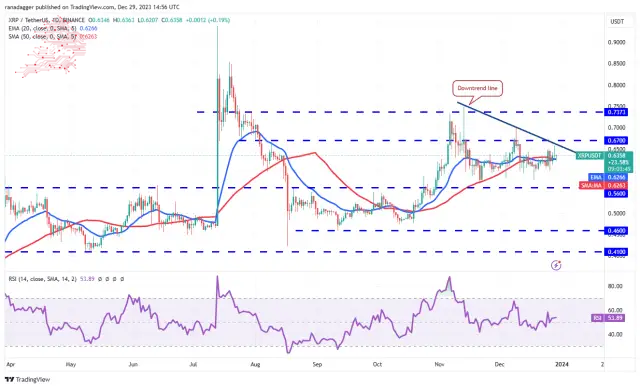
The price has been trading near the moving averages for the past few days, indicating indecision between the bulls and the bears. The flattish moving averages and the RSI near the midpoint suggest that the XRP/USDT pair may extend its stay inside the $0.56 to $0.67 range for some more time.
El precio ha estado cotizando cerca de los promedios móviles durante los últimos días, lo que indica indecisión entre alcistas y bajistas. Los promedios móviles planos y el RSI cerca del punto medio sugieren que el par XRP/USDT puede extender su permanencia dentro del rango de $0,56 a $0,67 por algún tiempo más.
Buyers will have to drive the price above $0.67 to seize control. The pair could then rise to $0.74, which is likely to act as a strong resistance. The short-term trend will turn bearish if the price plummets below $0.56.
Los compradores tendrán que elevar el precio por encima de 0,67 dólares para tomar el control. El par podría entonces subir a 0,74 dólares, lo que probablemente actuará como una fuerte resistencia. La tendencia a corto plazo se volverá bajista si el precio cae por debajo de 0,56 dólares.
Cardano (ADA) price analysis
Análisis de precios de Cardano (ADA)
The bulls pushed Cardano above the symmetrical triangle pattern on Dec. 28 but could not sustain the higher levels seen from the long wick on the day’s candlestick.
Los alcistas empujaron a Cardano por encima del patrón de triángulo simétrico el 28 de diciembre, pero no pudieron mantener los niveles más altos observados en la mecha larga de la vela del día.
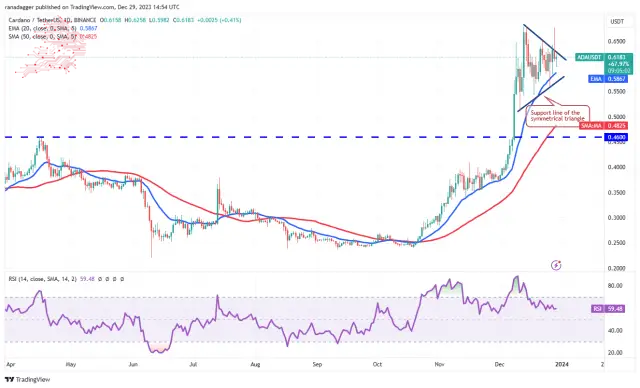
A minor advantage in favour of the bulls is that they have not allowed the price to break below the 20-day EMA. This suggests buying at lower levels. If the price rises above the triangle, the bulls will try to overcome the barrier again at $0.68. If they succeed, it will signal the resumption of the uptrend. The ADA/USDT pair may then climb to $0.80.
Una pequeña ventaja a favor de los alcistas es que no han permitido que el precio caiga por debajo de la EMA de 20 días. Esto sugiere comprar a niveles más bajos. Si el precio sube por encima del triángulo, los alcistas intentarán superar la barrera nuevamente en 0,68 dólares. Si lo logran, será una señal de la reanudación de la tendencia alcista. El par ADA/USDT podría subir a 0,80 dólares.
The triangle’s support line remains the crucial level for the bulls to defend because if this support gives way, the pair may move downward to $0.50 and, after that, to $0.46.
La línea de soporte del triángulo sigue siendo el nivel crucial que deben defender los alcistas porque si este soporte cede, el par puede bajar a 0,50 dólares y, después de eso, a 0,46 dólares.
Avalanche (AVAX) price analysis
Análisis de precios de Avalancha (AVAX)
Avalanche’s correction has reached strong support at $38, a significant level to watch.
La corrección de Avalanche ha alcanzado un fuerte soporte en 38 dólares, un nivel importante a tener en cuenta.
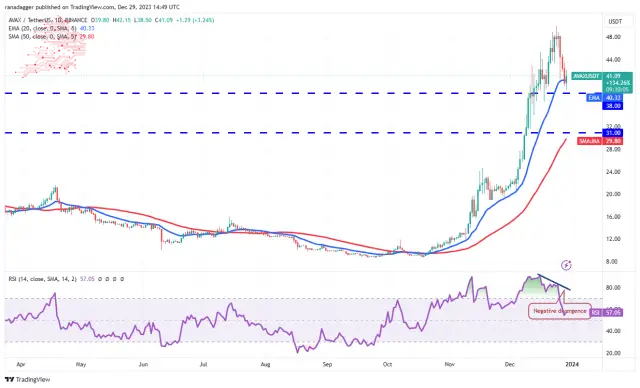
The bulls will try to defend the $38 support and start a relief rally. If that happens, the AVAX/USDT pair may stay rangebound between $38 and $50 for a while. The flattish 20-day EMA ($40) and the RSI above 57 also point to a possible consolidation in the near term with an upward bias.
Los alcistas intentarán defender el soporte de 38 dólares e iniciar un repunte de alivio. Si eso sucede, el par AVAX/USDT puede permanecer dentro del rango entre $38 y $50 por un tiempo. La EMA plana de 20 días ($40) y el RSI por encima de 57 también apuntan a una posible consolidación en el corto plazo con un sesgo alcista.
This view will be invalidated if prices drop and skids below $38. That may attract further selling, sinking the pair to $34 and eventually to $31.
Esta visión quedará invalidada si los precios caen y se deslizan por debajo de $38. Eso puede atraer más ventas, hundiendo el par a $34 y eventualmente a $31.
Dogecoin (DOGE) price analysis
Dogecoin has been trading near the 20-day EMA ($0.09) for the past few days, indicating a balance between supply and demand.
Análisis de precios de Dogecoin (DOGE) Dogecoin ha estado cotizando cerca de la EMA de 20 días ($0,09) durante los últimos días, lo que indica un equilibrio entre la oferta y la demanda.
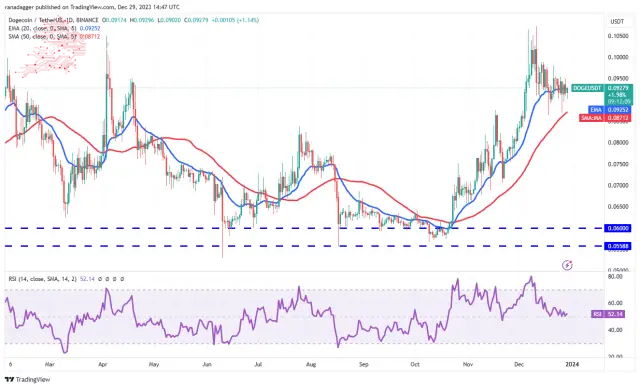
The flattish 20-day EMA and the RSI near the midpoint do not give a clear advantage either to the buyers or the sellers. In the near term, the price may remain stuck between the 50-day SMA ($0.09) and the $0.10 resistance.
La EMA plana de 20 días y el RSI cerca del punto medio no dan una ventaja clara ni a los compradores ni a los vendedores. En el corto plazo, el precio puede permanecer estancado entre la SMA de 50 días ($0,09) y la resistencia de $0,10.
The first sign of strength will be a break above $0.10, and the bullish momentum will likely pick up above $0.11. That opens up the possibility of a rally to $0.16. Contrarily, the bears will gain the upper hand if they sink the DOGE/USDT pair below the 50-day SMA. The pair may then slump to $0.07.
La primera señal de fortaleza será una ruptura por encima de 0,10 dólares, y el impulso alcista probablemente aumentará por encima de 0,11 dólares. Eso abre la posibilidad de un repunte a 0,16 dólares. Por el contrario, los bajistas tomarán ventaja si hunden el par DOGE/USDT por debajo de la SMA de 50 días. Luego, el par podría caer a 0,07 dólares.
Polkadot (DOT) price analysis
Polkadot’s pullback is nearing the breakout of $7.90, a crucial level to watch out for in the near term.
Análisis de precios de Polkadot (DOT) El retroceso de Polkadot se acerca a la ruptura de 7,90 dólares, un nivel crucial al que hay que prestar atención en el corto plazo.
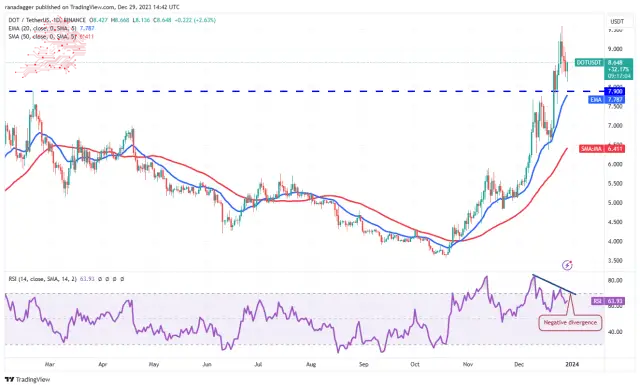
Although the upsloping moving averages indicate an advantage to buyers, the negative divergence on the RSI suggests that the bullish momentum could be slowing down. The breakout level of $7.90 will likely witness a tough battle between the bulls and the bears.
Aunque los promedios móviles ascendentes indican una ventaja para los compradores, la divergencia negativa en el RSI sugiere que el impulso alcista podría estar desacelerándose. El nivel de ruptura de 7,90 dólares probablemente será testigo de una dura batalla entre los alcistas y los bajistas.
If the price rebounds off $7.90, the DOT/USDT pair will attempt a rally to $10, where the bears are expected to offer a stiff resistance. Alternatively, if the price slides below the 20-day EMA ($7.78), the correction could deepen to the 50-day SMA ($6.41).
Si el precio rebota en USD 7,90, el par DOT/USDT intentará subir a USD 10, donde se espera que los bajistas ofrezcan una fuerte resistencia. Alternativamente, si el precio cae por debajo de la EMA de 20 días ($7,78), la corrección podría profundizarse hasta la SMA de 50 días ($6,41).
Polygon (MATIC) price analysis
Polygon turned down from $1.09 on Dec. 27 and dipped below the breakout level of $1 on Dec. 29, indicating profit booking by the bulls.
Análisis de precios de Polygon (MATIC) Polygon bajó desde 1,09 dólares el 27 de diciembre y cayó por debajo del nivel de ruptura de 1 dólar el 29 de diciembre, lo que indica que los alcistas están reservando ganancias.
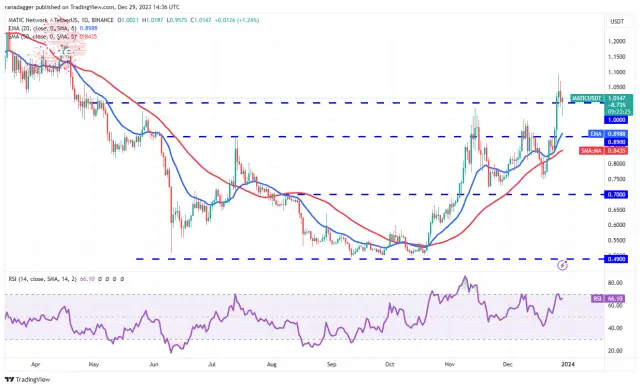
However, lower levels attracted strong buying by the bulls. Suppose the price is maintained above $1; the likelihood of a retest of $1.09 increases. The rising 20-day EMA ($0.89) and the RSI in the positive zone suggest that bulls are in command. If the $1.09 resistance is removed, the MATIC/USDT pair may rally to $1.20 and later to $1.50.
Sin embargo, los niveles más bajos atrajeron fuertes compras por parte de los alcistas. Supongamos que el precio se mantiene por encima de 1 dólar; aumenta la probabilidad de una nueva prueba de $ 1,09. La EMA de 20 días en ascenso ($0,89) y el RSI en la zona positiva sugieren que los alcistas tienen el mando. Si se elimina la resistencia de $1,09, el par MATIC/USDT puede subir a $1,20 y luego a $1,50.
Instead, if the price slips and maintains below $1, the pair could drop to the 20-day EMA. The bears must sink the price below this support to signal a rangebound action between $0.70 and $1.
En cambio, si el precio cae y se mantiene por debajo de 1 dólar, el par podría caer hasta la EMA de 20 días. Los bajistas deben hundir el precio por debajo de este soporte para señalar una acción dentro del rango entre USD 0,70 y USD 1.
Source – Rakesh Upadhyay
Fuente - Rakesh Upadhyay
Source: https://thebittimes.com/latest-market-overview-29th-dec-btc-eth-bnb-sol-xrp-ada-avax-doge-dot-matic-tbt75127.html
Fuente: https://thebittimes.com/latest-market-overview-29th-dec-btc-eth-bnb-sol-xrp-ada-avax-doge-dot-matic-tbt75127.html
 DogeHome
 Crypto News Land
 Crypto Daily™
 Crypto Intelligence
 Crypto Daily™
 CaptainAltcoin
 Thecryptoupdates
 Crypto Intelligence
 CoinsProbe


