
Bitcoin is currently displaying a bullish pattern, although it’s important to note that the RSI exhibits a negative divergence. This situation is creating mixed signals regarding Bitcoin’s short-term directional movement.
Actualmente, Bitcoin muestra un patrón alcista, aunque es importante tener en cuenta que el RSI muestra una divergencia negativa. Esta situación está creando señales contradictorias con respecto al movimiento direccional a corto plazo de Bitcoin.
Bitcoin has retained its gains in early December, indicating a trend where buyers are stepping in during minor dips. According to CoinShares data, there was an influx of $87.6 million into Bitcoin funds for the week ending on December 22nd.
Bitcoin ha mantenido sus ganancias a principios de diciembre, lo que indica una tendencia en la que los compradores intervienen durante caídas menores. Según datos de CoinShares, hubo una entrada de 87,6 millones de dólares en fondos de Bitcoin durante la semana que finalizó el 22 de diciembre.
Additionally, data from ETFGI, a research firm specialising in exchange-traded funds (ETFs), reveals that in November, there were inflows of $1.31 billion into cryptocurrency ETFs and exchange-traded products (ETPs). This brings the total inflows for the year to $1.60 billion.
Además, datos de ETFGI, una empresa de investigación especializada en fondos cotizados en bolsa (ETF), revelan que en noviembre hubo entradas de 1.310 millones de dólares en ETF y productos cotizados en bolsa (ETP) de criptomonedas. Esto eleva las entradas totales del año a 1.600 millones de dólares.
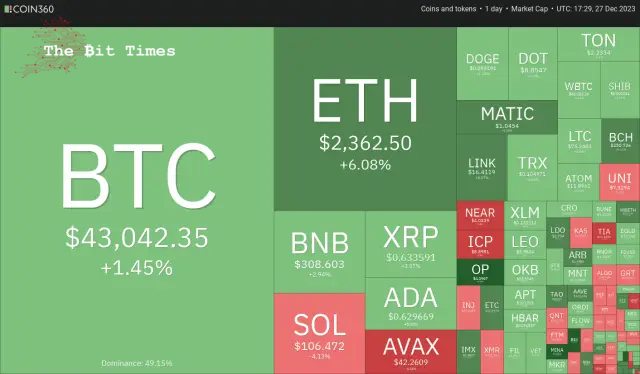
Investors seem to be accumulating Bitcoin before the anticipated approval of a spot Bitcoin ETF in January. Business Intelligence firm MicroStrategy added 14,620 Bitcoin to increase its total stockpile to 189,150. The latest acquisition was made at $42,110 per Bitcoin, taking its total average purchase price to about $31,168.
Los inversores parecen estar acumulando Bitcoin antes de la aprobación prevista de un ETF de Bitcoin al contado en enero. La empresa de inteligencia empresarial MicroStrategy añadió 14.620 Bitcoin para aumentar su reserva total a 189.150. La última adquisición se realizó a 42.110 dólares por Bitcoin, lo que eleva su precio de compra medio total a unos 31.168 dólares.
Will Bitcoin and altcoins continue their northward journey in the last few days of the year? Let’s analyse the charts of the top 10 cryptocurrencies to find out.
¿Continuarán Bitcoin y altcoins su viaje hacia el norte en los últimos días del año? Analicemos los gráficos de las 10 principales criptomonedas para descubrirlo.
Bitcoin (BTC) price analysis
Análisis de precios de Bitcoin (BTC)
Bitcoin has been stuck between the 20-day exponential moving average ($42,513) and the overhead resistance at $44,700.
Bitcoin se ha quedado atrapado entre el promedio móvil exponencial de 20 días ($42,513) y la resistencia superior de $44,700.
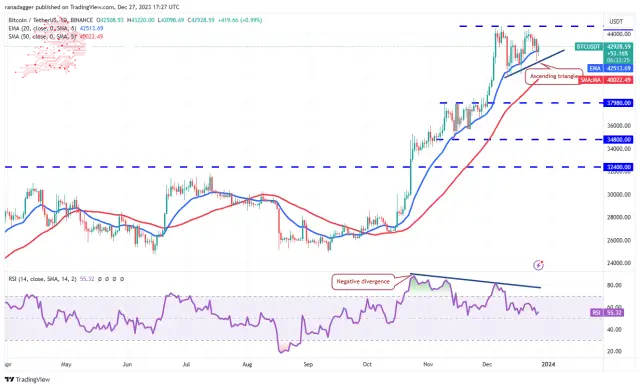
The price action of the past few days has formed an ascending triangle pattern that will complete on a break and close above $44,700. The BTC/USDT pair could then start the next leg of the uptrend toward the pattern target of $49,178.
La acción del precio de los últimos días ha formado un patrón de triángulo ascendente que se completará con una ruptura y cerrará por encima de $44,700. El par BTC/USDT podría entonces comenzar el siguiente tramo de la tendencia alcista hacia el objetivo del patrón de $49,178.
Contrarily, if the price turns down and breaks below the triangle, it will invalidate the positive setup. That may trigger the stops of several traders, pulling the cost to the 50-day simple moving average ($40,022) and later to $37,980.
Por el contrario, si el precio baja y cae por debajo del triángulo, invalidará la configuración positiva. Eso puede desencadenar las paradas de varios operadores, llevando el costo al promedio móvil simple de 50 días ($40,022) y luego a $37,980.
Ether (ETH) price analysis
Análisis de precios de éter (ETH)
Ether ha estado operando dentro de un patrón de canal descendente durante los últimos días, pero una señal positiva es que los alcistas no permitieron que el precio se mantuviera por debajo de los 2200 dólares.
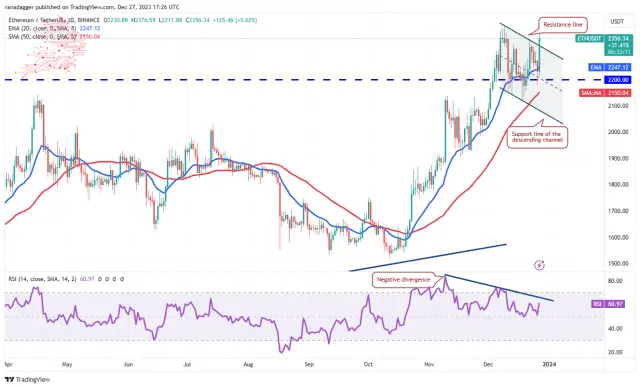
Solid buying on Dec. 27 propelled the price above the descending channel. If bulls maintain the price above the channel, the possibility of a break above $2,403 increases. The ETH/USDT pair could then ascend to $3,000.
Las sólidas compras del 27 de diciembre impulsaron el precio por encima del canal descendente. Si los alcistas mantienen el precio por encima del canal, aumenta la posibilidad de una ruptura por encima de los 2.403 dólares. El par ETH/USDT podría entonces ascender a $3,000.
Conversely, if the price re-enters the channel, it will signal that higher levels continue to attract sellers. The break below $2,200 could sink the pair to the channel’s support line. This remains critical for the bulls to protect because a drop below the channel may start a deeper correction to $1,900 and then $1,750.
Por el contrario, si el precio vuelve a entrar en el canal, indicará que los niveles más altos continúan atrayendo vendedores. La ruptura por debajo de USD 2200 podría hundir al par hasta la línea de soporte del canal. Esto sigue siendo fundamental para que los alcistas lo protejan porque una caída por debajo del canal puede iniciar una corrección más profunda a $1,900 y luego a $1,750.
Solana (SOL) price analysis
Análisis de precios de Solana (SOL)
Solana has been in a strong uptrend for the past several days. The bulls quickly cleared the psychological resistance of $100 on Dec. 23 and pushed the price to $126 on Dec. 25.
Solana ha estado en una fuerte tendencia alcista durante los últimos días. Los alcistas superaron rápidamente la resistencia psicológica de 100 dólares el 23 de diciembre y llevaron el precio a 126 dólares el 25 de diciembre.
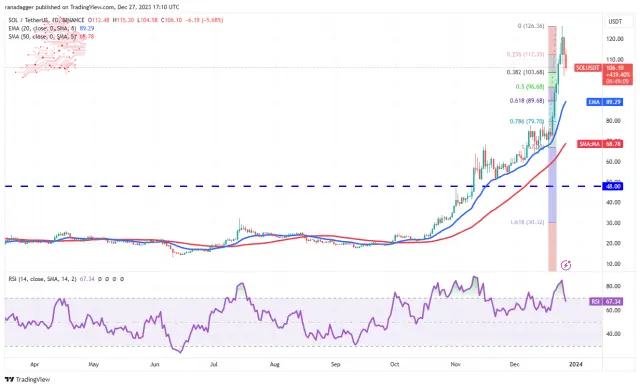
Profit booking started a pullback on Dec. 26, but the long tail on the day’s candlestick shows strong buying at the 38.2% Fibonacci retracement level of $103. The price was turned down on Dec. 27, indicating that the bears are in no mood to give up.
La reserva de ganancias inició un retroceso el 26 de diciembre, pero la larga cola de la vela del día muestra fuertes compras en el nivel de retroceso de Fibonacci del 38,2% de 103 dólares. El precio fue rechazado el 27 de diciembre, lo que indica que los bajistas no están de humor para darse por vencidos.
If the price drops below $103, the SOL/USDT pair could decline to the 20-day EMA ($89), near the 61.8% Fibonacci retracement level. A break below the 20-day EMA will suggest a change in the short-term trend. The bulls will regain control if they catapult the price above $126.
Si el precio cae por debajo de $103, el par SOL/USDT podría caer a la EMA de 20 días ($89), cerca del nivel de retroceso de Fibonacci del 61,8%. Una ruptura por debajo de la EMA de 20 días sugerirá un cambio en la tendencia a corto plazo. Los alcistas recuperarán el control si catapultan el precio por encima de los 126 dólares.
BNB price analysis
BNB turned up from the 20-day EMA ($262) on Dec. 25 and soared above the neckline on Dec. 26, completing a bullish inverse head-and-shoulders pattern.
Análisis de precios de BNB BNB subió desde la EMA de 20 días ($262) el 25 de diciembre y se disparó por encima del escote el 26 de diciembre, completando un patrón alcista inverso de cabeza y hombros.
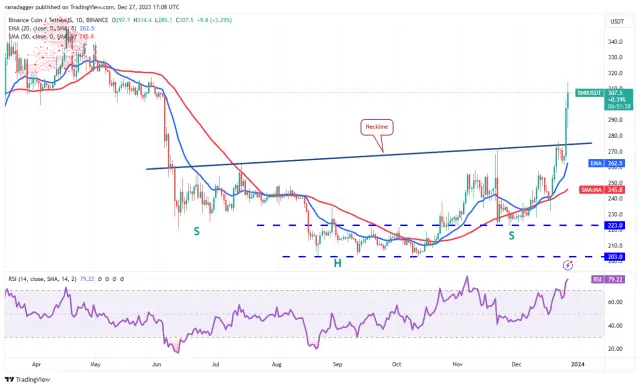
The bears tried to pull the price down toward the neckline on Dec. 27, but the long tail on the candlestick shows aggressive buying on dips. Buyers will try to maintain the momentum and shove the price to the pattern target of $333 and eventually to $350.
Los bajistas intentaron bajar el precio hacia la línea de escote el 27 de diciembre, pero la cola larga de la vela muestra compras agresivas en las caídas. Los compradores intentarán mantener el impulso y empujar el precio al objetivo del patrón de 333 dólares y, finalmente, a 350 dólares.
Meanwhile, the bears are likely to have other plans. They will try to stall the upmove near $317 and start a correction. Sellers must tug the BNB/USDT pair below the neckline to make a comeback.
Mientras tanto, es probable que los bajistas tengan otros planes. Intentarán detener el movimiento ascendente cerca de $317 e iniciar una corrección. Los vendedores deben tirar del par BNB/USDT por debajo del escote para regresar.
XRP price analysis
Análisis de precios XRP
XRP has been range-bound between $0.56 and $0.67 for the past few days, signalling a balance between buyers and sellers.
XRP ha estado dentro del rango entre $0,56 y $0,67 durante los últimos días, lo que indica un equilibrio entre compradores y vendedores.
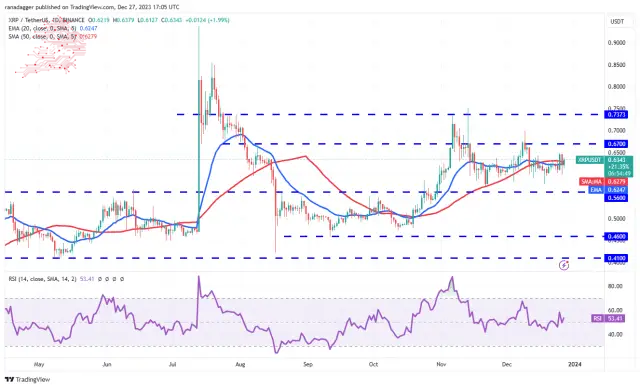
Both moving averages have flattened out, and the RSI is near the midpoint, suggesting that the range-bound action may continue longer. The first sign of strength will be a break and close above $0.67. The XRP/USDT pair may rise to $0.74, where the bears are expected to mount a strong defence.
Ambos promedios móviles se han estabilizado y el RSI está cerca del punto medio, lo que sugiere que la acción dentro del rango puede continuar por más tiempo. La primera señal de fortaleza será una ruptura y un cierre por encima de 0,67 dólares. El par XRP/USDT puede subir a $0,74, donde se espera que los bajistas monten una fuerte defensa.
On the downside, the bears must sink and keep the price below $0.56 to seize control. The pair could then slide to the solid support at $0.46.
En el lado negativo, los bajistas deben hundirse y mantener el precio por debajo de 0,56 dólares para tomar el control. Luego, el par podría deslizarse hasta el soporte sólido de 0,46 dólares.
Cardano (ADA) price analysis
Cardano has been consolidating in an uptrend. The price action of the past few days has formed a symmetrical triangle pattern, indicating indecision between the bulls and the bears.
Análisis de precios de Cardano (ADA) Cardano se ha ido consolidando en una tendencia alcista. La acción del precio de los últimos días ha formado un patrón de triángulo simétrico, lo que indica indecisión entre alcistas y bajistas.
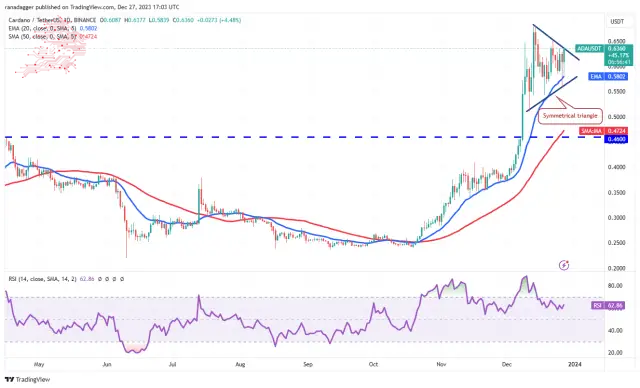
The upsloping moving averages and the positive territory’s RSI signal buyers an advantage. A break and close above the triangle will suggest that the bulls have absorbed the supply. That could propel the price to $0.69 and later to the pattern target of $0.80.
Los promedios móviles ascendentes y el RSI del territorio positivo indican a los compradores una ventaja. Una ruptura y un cierre por encima del triángulo sugerirán que los alcistas han absorbido la oferta. Eso podría impulsar el precio a 0,69 dólares y más tarde al objetivo del patrón de 0,80 dólares.
On the contrary, if the price turns down and breaks below the triangle, it will suggest that the bears remain active at higher levels. The ADA/USDT pair could collapse to the strong support at $0.46.
Por el contrario, si el precio baja y cae por debajo del triángulo, sugerirá que los bajistas permanecen activos en niveles más altos. El par ADA/USDT podría colapsar hasta alcanzar el fuerte soporte de 0,46 dólares.
Avalanche (AVAX) price analysis
Análisis de precios de Avalancha (AVAX)
Avalanche turned down from $49.96 on Dec. 24, indicating that the traders booked profits near the psychological level of $50.
Avalanche bajó desde 49,96 dólares el 24 de diciembre, lo que indica que los operadores registraron ganancias cercanas al nivel psicológico de 50 dólares.
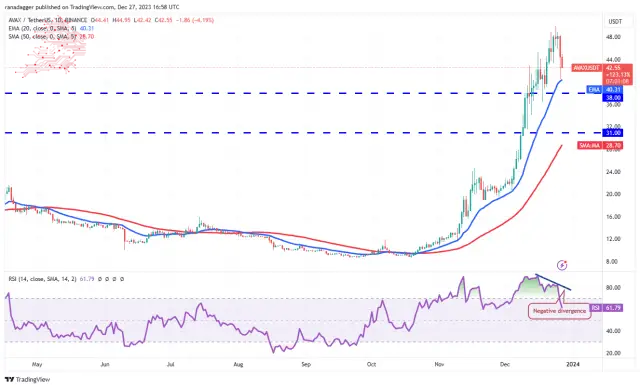
The selling picked up on Dec. 26, pulling the price to the 20-day EMA ($40.31). The long tail on the day’s candlestick shows that the bulls view the dips as a buying opportunity. Buyers must push the price above $50 to resume the uptrend.
La venta repuntó el 26 de diciembre, llevando el precio a la EMA de 20 días (40,31 dólares). La cola larga de la vela del día muestra que los alcistas ven las caídas como una oportunidad de compra. Los compradores deben elevar el precio por encima de los 50 dólares para reanudar la tendencia alcista.
The risk to the bullish view is that the RSI is showing signs of forming a bearish divergence. This suggests that the positive momentum may be weakening. That signals a minor correction or consolidation in the near term. The selling could pick up if the AVAX/USDT pair skids below the 20-day EMA. The pair may then slump to $34
El riesgo para la visión alcista es que el RSI esté mostrando signos de formar una divergencia bajista. Esto sugiere que el impulso positivo puede estar debilitándose. Eso indica una corrección o consolidación menor en el corto plazo. Las ventas podrían aumentar si el par AVAX/USDT cae por debajo de la EMA de 20 días. El par podría caer entonces hasta los 34 dólares.
Dogecoin (DOGE) price analysis
The bears pulled Dogecoin below the 20-day EMA ($0.09) on Dec. 26, but the long tail on the candlestick shows strong buying at the 50-day SMA ($0.09).
Análisis de precios de Dogecoin (DOGE) Los bajistas llevaron a Dogecoin por debajo de la EMA de 20 días ($0,09) el 26 de diciembre, pero la cola larga de la vela muestra fuertes compras en la SMA de 50 días ($0,09).
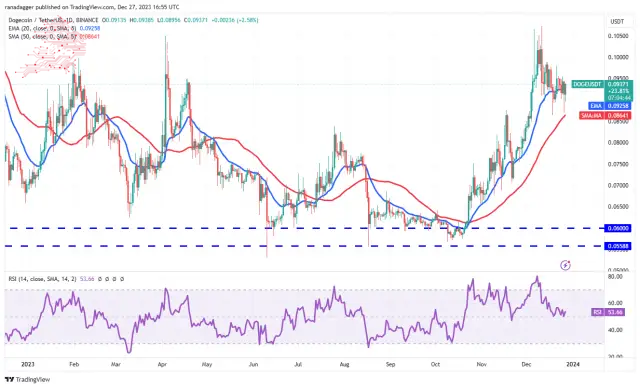
The flattish 20-day EMA and the RSI near the midpoint suggest a balance between supply and demand. This equilibrium could shift in favour of the bears if they sink and sustain the price below the 50-day SMA. The pair may then tumble to $0.07.
La EMA plana de 20 días y el RSI cerca del punto medio sugieren un equilibrio entre la oferta y la demanda. Este equilibrio podría inclinarse a favor de los bajistas si hunden y mantienen el precio por debajo de la SMA de 50 días. Luego, el par podría caer a 0,07 dólares.
If buyers want the upper hand, they must drive the price above the $0.10 to $0.11 resistance zone. If they manage to do that, the DOGE/USDT pair could start the next leg of the uptrend to $0.16.
Si los compradores quieren tomar ventaja, deben impulsar el precio por encima de la zona de resistencia de 0,10 a 0,11 dólares. Si logran hacer eso, el par DOGE/USDT podría iniciar el siguiente tramo de la tendencia alcista a USD 0,16.
Polkadot (DOT) price analysis
Polkadot is correcting in an uptrend. The price turned down from $9.59 on Dec. 26, indicating that the bears are defending the overhead resistance at $10.
Análisis de precios de Polkadot (DOT) Polkadot se está corrigiendo en una tendencia alcista. El precio bajó desde 9,59 dólares el 26 de diciembre, lo que indica que los bajistas están defendiendo la resistencia superior de 10 dólares.
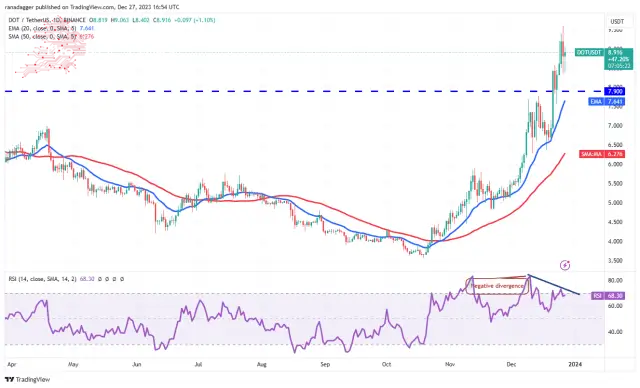
The DOT/USDT pair will likely correct to the breakout level of $7.90. If the price rebounds off this support, it will imply that the sentiment remains positive and traders are buying on dips. The bulls will then make one more attempt to clear the obstacle at $10 and start the journey to $12.
El par DOT/USDT probablemente se corregirá hasta el nivel de ruptura de USD 7,90. Si el precio rebota en este soporte, implicará que el sentimiento sigue siendo positivo y los operadores están comprando en las caídas. Luego, los alcistas harán un intento más para superar el obstáculo en 10$ y comenzar el viaje hasta 12$.
The risk to the upside is that the RSI is forming a negative divergence. This suggests that the bullish momentum could be slowing. The pair may spend some time inside the range between $7.90 and $9.59 in the short term.
El riesgo al alza es que el RSI esté formando una divergencia negativa. Esto sugiere que el impulso alcista podría estar desacelerándose. El par puede pasar algún tiempo dentro del rango entre $7,90 y $9,59 a corto plazo.
Polygon (MATIC) price analysis
Polygon bounced off the 20-day EMA ($0.87) on Dec. 25 and rose above the stiff overhead resistance of $1 on Dec. 26.
Análisis de precios de Polygon (MATIC) Polygon rebotó en la EMA de 20 días (0,87 dólares) el 25 de diciembre y superó la rígida resistencia general de 1 dólar el 26 de diciembre.
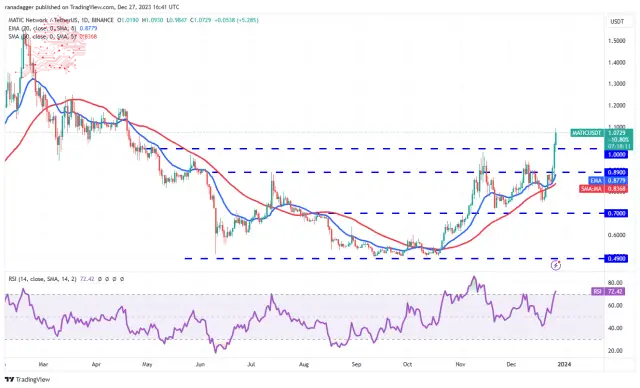
Buyers are trying to extend the upmove on Dec. 27 but may face selling near $1.20. The MATIC/USDT pair could drop to $1 if the price turns down the overhead resistance. If bulls flip this level into support, it will signal strength. The bulls will then try to overcome the barrier at $1.20 and push the price to $1.50.
Los compradores están tratando de extender el movimiento alcista el 27 de diciembre, pero pueden enfrentar ventas cercanas a 1,20 dólares. El par MATIC/USDT podría caer a 1 dólar si el precio baja la resistencia superior. Si los alcistas convierten este nivel en soporte, será una señal de fortaleza. Los alcistas intentarán entonces superar la barrera de 1,20 dólares y empujar el precio a 1,50 dólares.
Instead, if bears pull the price below $1, it may trap the aggressive bulls. That could accelerate selling and pull the pair to the $0.89 support.
En cambio, si los bajistas bajan el precio por debajo de 1 dólar, puede atrapar a los alcistas agresivos. Eso podría acelerar las ventas y llevar al par al soporte de $0,89.
Source – Rakesh Upadhyay
Fuente - Rakesh Upadhyay
Source: https://thebittimes.com/latest-market-overview-27th-dec-btc-eth-sol-bnb-xrp-ada-avax-doge-dot-matic-tbt74987.html
Fuente: https://thebittimes.com/latest-market-overview-27th-dec-btc-eth-sol-bnb-xrp-ada-avax-doge-dot-matic-tbt74987.html


 DogeHome
 Crypto News Land
 Crypto Daily™
 Crypto Intelligence
 Crypto Daily™
 CaptainAltcoin
 Thecryptoupdates
 Crypto Intelligence
 CoinsProbe


