


Bitcoin is currently displaying a bullish pattern, although it’s important to note that the RSI exhibits a negative divergence. This situation is creating mixed signals regarding Bitcoin’s short-term directional movement.
比特幣目前呈現看漲格局,但值得注意的是 RSI 呈現負背離。這種情況正在產生有關比特幣短期方向走勢的混合訊號。
Bitcoin has retained its gains in early December, indicating a trend where buyers are stepping in during minor dips. According to CoinShares data, there was an influx of $87.6 million into Bitcoin funds for the week ending on December 22nd.
比特幣在 12 月初保持了漲幅,顯示買家在小幅下跌期間介入的趨勢。根據 CoinShares 的數據,截至 12 月 22 日的一周,比特幣基金流入了 8,760 萬美元。
Additionally, data from ETFGI, a research firm specialising in exchange-traded funds (ETFs), reveals that in November, there were inflows of $1.31 billion into cryptocurrency ETFs and exchange-traded products (ETPs). This brings the total inflows for the year to $1.60 billion.
此外,專門研究交易所交易基金(ETF)的研究公司ETFGI的數據顯示,11月份,加密貨幣ETF和交易所交易產品(ETP)的資金流入為13.1億美元。這使得今年的總流入達到 16 億美元。
Investors seem to be accumulating Bitcoin before the anticipated approval of a spot Bitcoin ETF in January. Business Intelligence firm MicroStrategy added 14,620 Bitcoin to increase its total stockpile to 189,150. The latest acquisition was made at $42,110 per Bitcoin, taking its total average purchase price to about $31,168.
在預計 1 月比特幣 ETF 現貨獲得批准之前,投資者似乎正在累積比特幣。商業智慧公司 MicroStrategy 增加了 14,620 個比特幣,使其總庫存量增加至 189,150 個。最新收購價格為每比特幣 42,110 美元,使其平均購買總價達到約 31,168 美元。
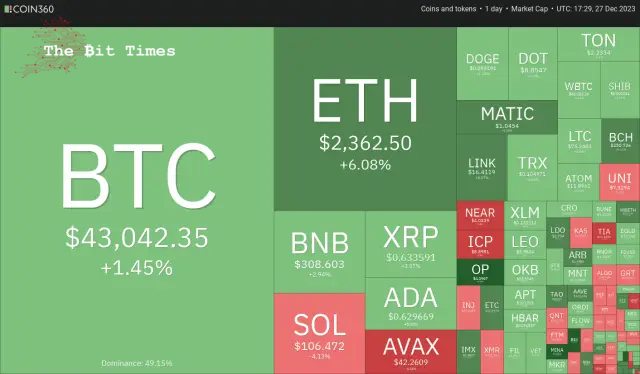
Will Bitcoin and altcoins continue their northward journey in the last few days of the year? Let’s analyse the charts of the top 10 cryptocurrencies to find out.
比特幣和山寨幣會在今年最後幾天繼續北上之旅嗎?讓我們分析一下前 10 名加密貨幣的圖表來找出答案。
Bitcoin (BTC) price analysis
比特幣(BTC)價格分析
Bitcoin has been stuck between the 20-day exponential moving average ($42,513) and the overhead resistance at $44,700.
比特幣一直徘徊在 20 天指數移動平均線(42,513 美元)和上方阻力位 44,700 美元之間。
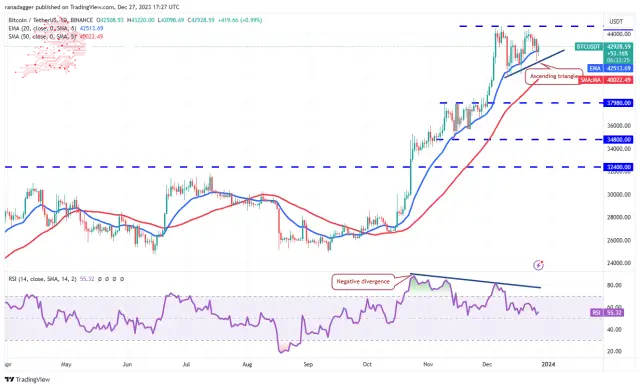
The price action of the past few days has formed an ascending triangle pattern that will complete on a break and close above $44,700. The BTC/USDT pair could then start the next leg of the uptrend toward the pattern target of $49,178.
過去幾天的價格走勢已經形成了一個上升三角形形態,該形態將在突破時完成並收於 44,700 美元上方。然後,BTC/USDT 貨幣對可能會開始下一階段的上升趨勢,目標為 49,178 美元。
Contrarily, if the price turns down and breaks below the triangle, it will invalidate the positive setup. That may trigger the stops of several traders, pulling the cost to the 50-day simple moving average ($40,022) and later to $37,980.
相反,如果價格下跌並跌破三角形,則積極的設定將失效。這可能會觸發一些交易者的止損,將成本拉至 50 日簡單移動平均線(40,022 美元),然後拉至 37,980 美元。
Ether (ETH) price analysis
以太幣(ETH)價格分析
過去幾天,以太幣一直在下降通道模式內交易,但一個積極的跡像是,多頭不允許價格維持在 2,200 美元以下。
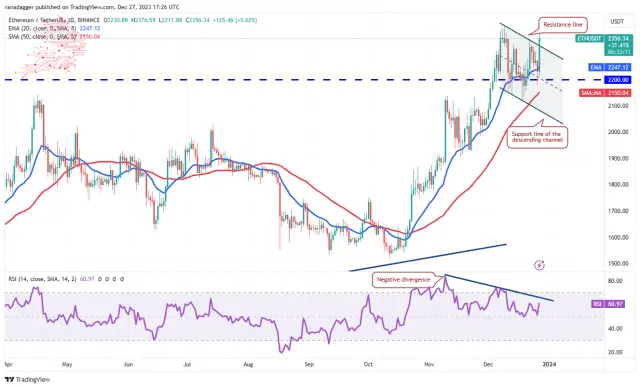
Solid buying on Dec. 27 propelled the price above the descending channel. If bulls maintain the price above the channel, the possibility of a break above $2,403 increases. The ETH/USDT pair could then ascend to $3,000.
12 月 27 日的強勁買盤推動價格突破下降通道。如果多頭將價格維持在通道之上,則突破 2,403 美元的可能性就會增加。 ETH/USDT 貨幣對可能會上漲至 3,000 美元。
Conversely, if the price re-enters the channel, it will signal that higher levels continue to attract sellers. The break below $2,200 could sink the pair to the channel’s support line. This remains critical for the bulls to protect because a drop below the channel may start a deeper correction to $1,900 and then $1,750.
相反,如果價格重新進入該頻道,則將表明更高的水平繼續吸引賣家。跌破 2,200 美元可能會使該貨幣對跌至該通道的支撐線。這對於多頭的保護仍然至關重要,因為跌破該通道可能會開始更深的回調至 1,900 美元,然後是 1,750 美元。
Solana (SOL) price analysis
Solana (SOL) 價格分析
Solana has been in a strong uptrend for the past several days. The bulls quickly cleared the psychological resistance of $100 on Dec. 23 and pushed the price to $126 on Dec. 25.
Solana 在過去幾天一直處於強勁的上升趨勢。多頭在 12 月 23 日迅速清除了 100 美元的心理阻力位,並於 12 月 25 日將價格推至 126 美元。
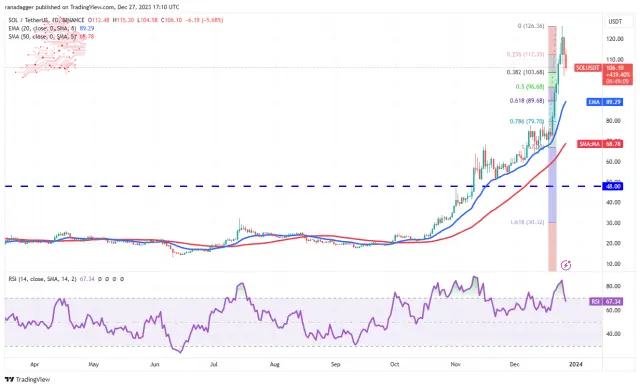
Profit booking started a pullback on Dec. 26, but the long tail on the day’s candlestick shows strong buying at the 38.2% Fibonacci retracement level of $103. The price was turned down on Dec. 27, indicating that the bears are in no mood to give up.
利潤預訂於 12 月 26 日開始回調,但當天燭台上的長尾顯示在 38.2% 斐波那契回檔位 103 美元處有強勁買盤。 12月27日價格回落,顯示空頭沒有放棄的心情。
If the price drops below $103, the SOL/USDT pair could decline to the 20-day EMA ($89), near the 61.8% Fibonacci retracement level. A break below the 20-day EMA will suggest a change in the short-term trend. The bulls will regain control if they catapult the price above $126.
如果價格跌破 103 美元,SOL/USDT 貨幣對可能會跌至 20 日均線(89 美元),接近 61.8% 斐波那契回檔位。跌破20日均線將顯示短期趨勢改變。如果多頭將價格推升至 126 美元以上,他們將重新獲得控制權。
BNB price analysis
BNB turned up from the 20-day EMA ($262) on Dec. 25 and soared above the neckline on Dec. 26, completing a bullish inverse head-and-shoulders pattern.
BNB 價格分析 BNB 於 12 月 25 日從 20 日均線(262 美元)上漲,並於 12 月 26 日飆升至頸線之上,完成看漲的反向頭肩形態。
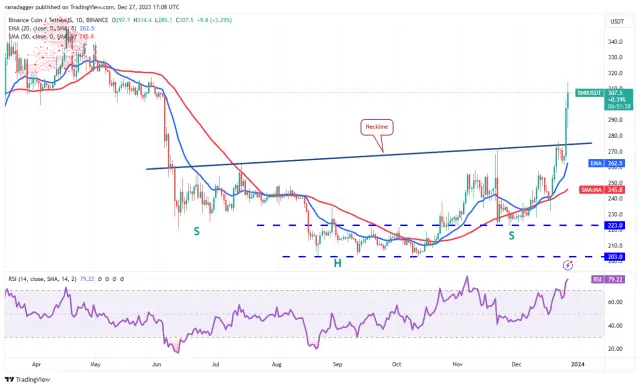
The bears tried to pull the price down toward the neckline on Dec. 27, but the long tail on the candlestick shows aggressive buying on dips. Buyers will try to maintain the momentum and shove the price to the pattern target of $333 and eventually to $350.
12 月 27 日,空頭試圖將價格拉向頸線,但燭台上的長尾顯示逢低買入的激進行為。買家將努力保持勢頭,將價格推至 333 美元的模式目標,並最終推至 350 美元。
Meanwhile, the bears are likely to have other plans. They will try to stall the upmove near $317 and start a correction. Sellers must tug the BNB/USDT pair below the neckline to make a comeback.
同時,空頭可能還有其他計劃。他們將試圖阻止漲勢接近 317 美元並開始修正。賣家必須將 BNB/USDT 貨幣對拉至頸線下方才能捲土重來。
XRP price analysis
瑞波幣價格分析
XRP has been range-bound between $0.56 and $0.67 for the past few days, signalling a balance between buyers and sellers.
過去幾天,XRP 一直在 0.56 美元至 0.67 美元之間波動,表明買家和賣家之間存在平衡。
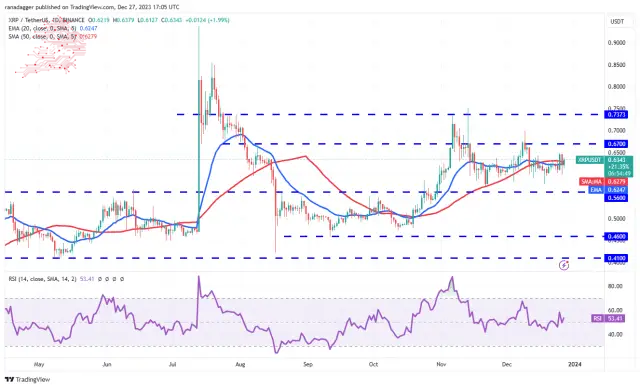
Both moving averages have flattened out, and the RSI is near the midpoint, suggesting that the range-bound action may continue longer. The first sign of strength will be a break and close above $0.67. The XRP/USDT pair may rise to $0.74, where the bears are expected to mount a strong defence.
兩條移動平均線均已趨於平緩,RSI 接近中點,顯示區間波動可能會持續更長時間。強勢的第一個跡象將是突破並收於 0.67 美元上方。 XRP/USDT 貨幣對可能會上漲至 0.74 美元,預計空頭將在此進行強有力的防禦。
On the downside, the bears must sink and keep the price below $0.56 to seize control. The pair could then slide to the solid support at $0.46.
不利的一面是,空頭必須下沉並將價格保持在 0.56 美元以下才能奪取控制權。隨後該貨幣對可能會下滑至 0.46 美元的堅實支撐位。
Cardano (ADA) price analysis
Cardano has been consolidating in an uptrend. The price action of the past few days has formed a symmetrical triangle pattern, indicating indecision between the bulls and the bears.
卡爾達諾(ADA)價格分析卡爾達諾一直在上升趨勢中鞏固。過去幾天的價格走勢形成了對稱三角形模式,顯示多頭和空頭之間猶豫不決。
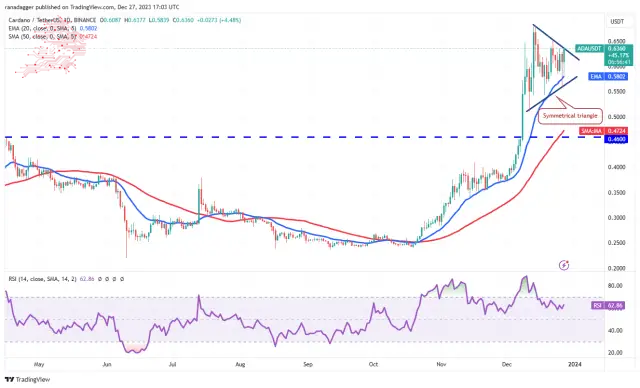
The upsloping moving averages and the positive territory’s RSI signal buyers an advantage. A break and close above the triangle will suggest that the bulls have absorbed the supply. That could propel the price to $0.69 and later to the pattern target of $0.80.
上升的移動平均線和積極的 RSI 區域表明買家有優勢。突破並收於三角形之上將表示多頭已經吸收了供應。這可能會將價格推高至 0.69 美元,隨後達到 0.80 美元的模式目標。
On the contrary, if the price turns down and breaks below the triangle, it will suggest that the bears remain active at higher levels. The ADA/USDT pair could collapse to the strong support at $0.46.
相反,如果價格下跌並跌破三角形,則表示空頭在較高水準仍保持活躍。 ADA/USDT 貨幣對可能會跌至 0.46 美元的強支撐位。
Avalanche (AVAX) price analysis
雪崩 (AVAX) 價格分析
Avalanche turned down from $49.96 on Dec. 24, indicating that the traders booked profits near the psychological level of $50.
Avalanche 從 12 月 24 日的 49.96 美元回落,表明交易者在 50 美元的心理價位附近獲利了結。
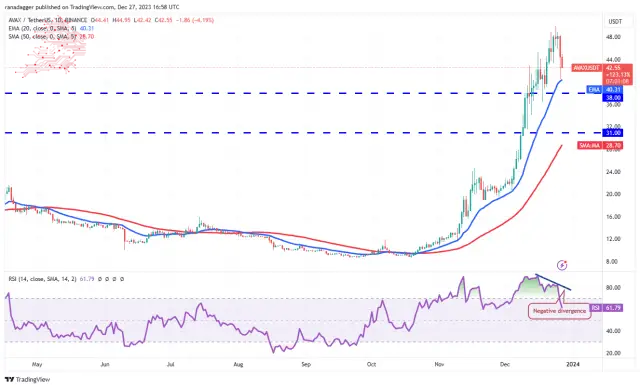
The selling picked up on Dec. 26, pulling the price to the 20-day EMA ($40.31). The long tail on the day’s candlestick shows that the bulls view the dips as a buying opportunity. Buyers must push the price above $50 to resume the uptrend.
12 月 26 日拋售加劇,將價格拉至 20 日均線(40.31 美元)。當日燭台上的長尾顯示多頭將下跌視為買入機會。買家必須將價格推高至 50 美元以上才能恢復上升趨勢。
The risk to the bullish view is that the RSI is showing signs of forming a bearish divergence. This suggests that the positive momentum may be weakening. That signals a minor correction or consolidation in the near term. The selling could pick up if the AVAX/USDT pair skids below the 20-day EMA. The pair may then slump to $34
看漲觀點面臨的風險是 RSI 正顯示出形成看跌背離的跡象。這表明積極勢頭可能正在減弱。這標誌著近期的小幅調整或盤整。如果 AVAX/USDT 貨幣對跌破 20 日均線,拋售可能會加劇。隨後該貨幣對可能會跌至 34 美元
Dogecoin (DOGE) price analysis
The bears pulled Dogecoin below the 20-day EMA ($0.09) on Dec. 26, but the long tail on the candlestick shows strong buying at the 50-day SMA ($0.09).
狗狗幣 (DOGE) 價格分析 12 月 26 日,空頭將狗狗幣拉至 20 日均線(0.09 美元)下方,但燭台上的長尾顯示在 50 日均線(0.09 美元)處有強勁買盤。
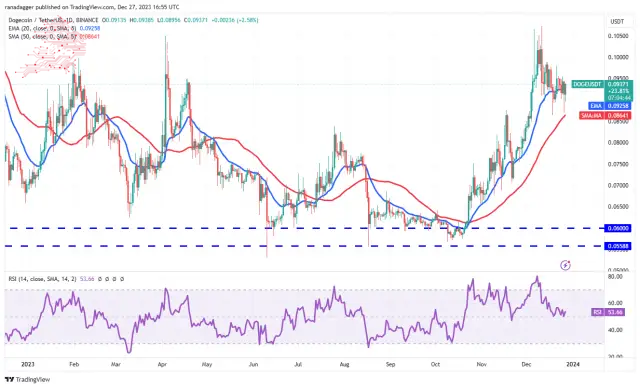
The flattish 20-day EMA and the RSI near the midpoint suggest a balance between supply and demand. This equilibrium could shift in favour of the bears if they sink and sustain the price below the 50-day SMA. The pair may then tumble to $0.07.
持平的 20 日均線和 RSI 接近中點表示供需平衡。如果空頭下跌並維持價格低於 50 日移動平均線,這種平衡可能會對空頭有利。隨後該貨幣對可能會跌至 0.07 美元。
If buyers want the upper hand, they must drive the price above the $0.10 to $0.11 resistance zone. If they manage to do that, the DOGE/USDT pair could start the next leg of the uptrend to $0.16.
如果買家想要佔上風,他們必須將價格推至 0.10 美元至 0.11 美元的阻力區之上。如果他們成功做到這一點,DOGE/USDT 貨幣對可能會開始下一階段的上升趨勢,達到 0.16 美元。
Polkadot (DOT) price analysis
Polkadot is correcting in an uptrend. The price turned down from $9.59 on Dec. 26, indicating that the bears are defending the overhead resistance at $10.
Polkadot (DOT) 價格分析 Polkadot 正在上升趨勢中進行修正。價格從 12 月 26 日的 9.59 美元下跌,表明空頭正在捍衛 10 美元的上方阻力位。
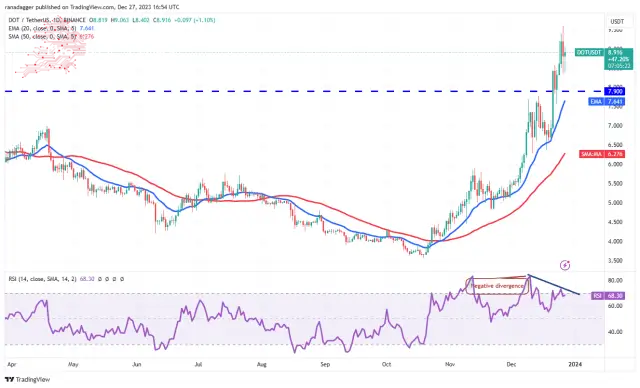
The DOT/USDT pair will likely correct to the breakout level of $7.90. If the price rebounds off this support, it will imply that the sentiment remains positive and traders are buying on dips. The bulls will then make one more attempt to clear the obstacle at $10 and start the journey to $12.
DOT/USDT 貨幣對可能會修正至 7.90 美元的突破水準。如果價格從該支撐位反彈,則表示市場情緒依然樂觀,交易者逢低買進。然後,多頭將再次嘗試清除 10 美元的障礙,並開始邁向 12 美元的旅程。
The risk to the upside is that the RSI is forming a negative divergence. This suggests that the bullish momentum could be slowing. The pair may spend some time inside the range between $7.90 and $9.59 in the short term.
上行風險是 RSI 正在形成負背離。這表明看漲勢頭可能正在放緩。短期內該貨幣對可能會在 7.90 美元至 9.59 美元的區間內徘徊一段時間。
Polygon (MATIC) price analysis
Polygon bounced off the 20-day EMA ($0.87) on Dec. 25 and rose above the stiff overhead resistance of $1 on Dec. 26.
Polygon (MATIC) 價格分析 Polygon 於 12 月 25 日從 20 日均線(0.87 美元)反彈,並於 12 月 26 日昇至 1 美元的上方阻力位。
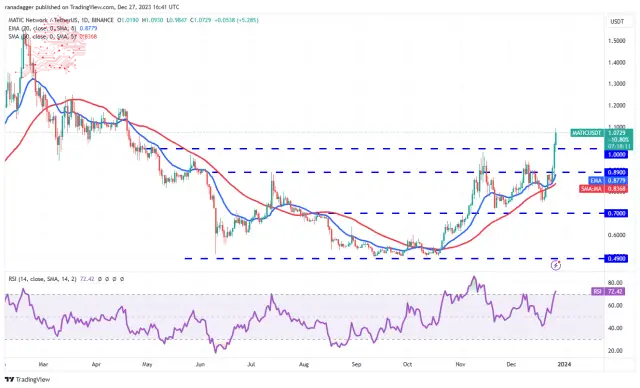
Buyers are trying to extend the upmove on Dec. 27 but may face selling near $1.20. The MATIC/USDT pair could drop to $1 if the price turns down the overhead resistance. If bulls flip this level into support, it will signal strength. The bulls will then try to overcome the barrier at $1.20 and push the price to $1.50.
買家試圖延續 12 月 27 日的漲勢,但可能面臨 1.20 美元附近的拋售。如果價格降低上方阻力,MATIC/USDT 貨幣對可能會跌至 1 美元。如果多頭將該水平轉變為支撐位,則將發出強勢訊號。然後,多頭將嘗試克服 1.20 美元的障礙,並將價格推至 1.50 美元。
Instead, if bears pull the price below $1, it may trap the aggressive bulls. That could accelerate selling and pull the pair to the $0.89 support.
相反,如果空頭將價格拉低至 1 美元以下,則可能會困住激進的多頭。這可能會加速拋售並將該貨幣對拉至 0.89 美元的支撐位。
Source – Rakesh Upadhyay
來源——Rakesh Upadhyay
Source: https://thebittimes.com/latest-market-overview-27th-dec-btc-eth-sol-bnb-xrp-ada-avax-doge-dot-matic-tbt74987.html
資料來源:https://thebittimes.com/latest-market-overview-27th-dec-btc-eth-sol-bnb-xrp-ada-avax-doge-dot-matic-tbt74987.html
 BlockchainReporter
 CoinPedia News
 TheNewsCrypto
 CFN
CFN DogeHome
 Optimisus
 Crypto News Land
 Optimisus


