


Bitcoin is currently displaying a bullish pattern, although it’s important to note that the RSI exhibits a negative divergence. This situation is creating mixed signals regarding Bitcoin’s short-term directional movement.
비트코인은 현재 강세 패턴을 보이고 있지만 RSI가 부정적인 다이버전스를 보인다는 점에 유의하는 것이 중요합니다. 이러한 상황은 비트코인의 단기 방향 움직임과 관련하여 혼합된 신호를 생성하고 있습니다.
Bitcoin has retained its gains in early December, indicating a trend where buyers are stepping in during minor dips. According to CoinShares data, there was an influx of $87.6 million into Bitcoin funds for the week ending on December 22nd.
비트코인은 12월 초에도 상승세를 유지했는데, 이는 소폭 하락세에도 구매자가 참여하는 추세를 나타냅니다. CoinShares 데이터에 따르면 12월 22일로 끝나는 주 동안 비트코인 자금으로 8,760만 달러가 유입되었습니다.
Additionally, data from ETFGI, a research firm specialising in exchange-traded funds (ETFs), reveals that in November, there were inflows of $1.31 billion into cryptocurrency ETFs and exchange-traded products (ETPs). This brings the total inflows for the year to $1.60 billion.
또한 상장지수펀드(ETF) 전문 리서치 회사인 ETFGI의 데이터에 따르면 11월 암호화폐 ETF와 상장지수상품(ETP)으로 13억 1천만 달러가 유입된 것으로 나타났습니다. 이로써 올해 총 유입액은 16억 달러에 달한다.
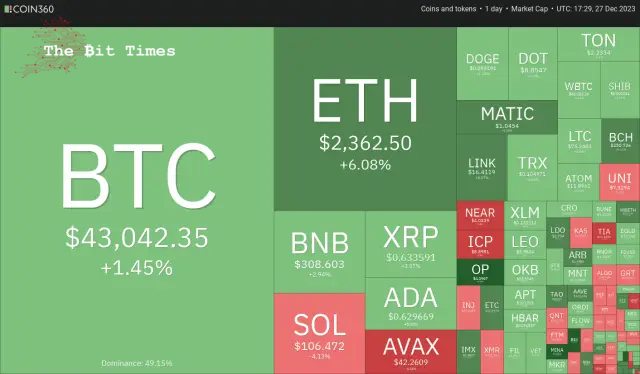
Investors seem to be accumulating Bitcoin before the anticipated approval of a spot Bitcoin ETF in January. Business Intelligence firm MicroStrategy added 14,620 Bitcoin to increase its total stockpile to 189,150. The latest acquisition was made at $42,110 per Bitcoin, taking its total average purchase price to about $31,168.
투자자들은 1월 현물 비트코인 ETF 승인이 예상되기 전에 비트코인을 축적하고 있는 것으로 보입니다. 비즈니스 인텔리전스 회사인 MicroStrategy는 비트코인 14,620개를 추가하여 총 재고량을 189,150개로 늘렸습니다. 최근 인수는 비트코인당 $42,110에 이루어졌으며 총 평균 구매 가격은 약 $31,168입니다.
Will Bitcoin and altcoins continue their northward journey in the last few days of the year? Let’s analyse the charts of the top 10 cryptocurrencies to find out.
비트코인과 알트코인은 올해 마지막 며칠 동안 계속해서 북쪽으로 나아갈 것인가? 알아보기 위해 상위 10개 암호화폐의 차트를 분석해 보겠습니다.
Bitcoin (BTC) price analysis
비트코인(BTC) 가격 분석
Bitcoin has been stuck between the 20-day exponential moving average ($42,513) and the overhead resistance at $44,700.
비트코인은 20일 지수 이동 평균(42,513달러)과 44,700달러의 오버헤드 저항 사이에 갇혀 있습니다.
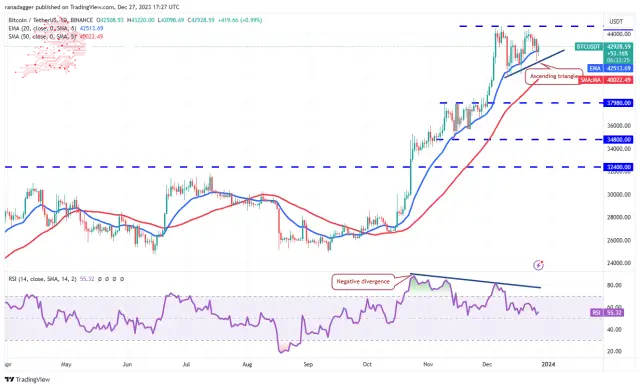
The price action of the past few days has formed an ascending triangle pattern that will complete on a break and close above $44,700. The BTC/USDT pair could then start the next leg of the uptrend toward the pattern target of $49,178.
지난 며칠 동안의 가격 움직임은 상승세 삼각형 패턴을 형성하여 휴식 시간에 완료되고 $44,700 이상으로 마감됩니다. 그러면 BTC/USDT 쌍은 $49,178의 패턴 목표를 향해 상승 추세의 다음 구간을 시작할 수 있습니다.
Contrarily, if the price turns down and breaks below the triangle, it will invalidate the positive setup. That may trigger the stops of several traders, pulling the cost to the 50-day simple moving average ($40,022) and later to $37,980.
반대로 가격이 하락하여 삼각형 아래로 떨어지면 포지티브 설정이 무효화됩니다. 이는 여러 트레이더의 중단을 촉발하여 비용을 50일 단순 이동 평균($40,022)으로 끌어올리고 나중에는 $37,980로 끌어올릴 수 있습니다.
Ether (ETH) price analysis
이더(ETH) 가격 분석
이더리움은 지난 며칠 동안 하락 채널 패턴 내에서 거래되었지만 긍정적인 신호는 상승세가 가격이 2,200달러 이하로 유지되는 것을 허용하지 않았다는 것입니다.
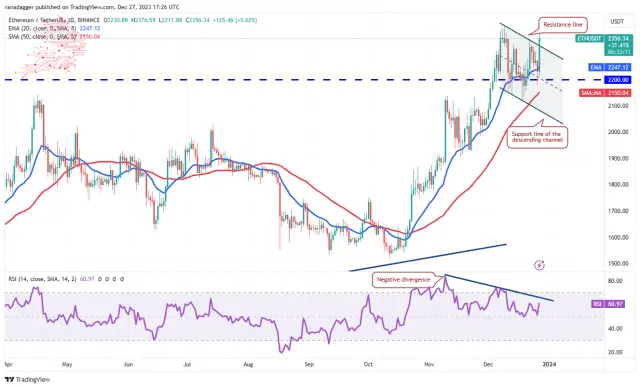
Solid buying on Dec. 27 propelled the price above the descending channel. If bulls maintain the price above the channel, the possibility of a break above $2,403 increases. The ETH/USDT pair could then ascend to $3,000.
12월 27일의 견고한 매수로 인해 가격이 하락 채널 위로 상승했습니다. 상승세가 채널 위의 가격을 유지한다면 $2,403를 넘어 돌파할 가능성이 높아집니다. 그러면 ETH/USDT 쌍은 $3,000까지 오를 수 있습니다.
Conversely, if the price re-enters the channel, it will signal that higher levels continue to attract sellers. The break below $2,200 could sink the pair to the channel’s support line. This remains critical for the bulls to protect because a drop below the channel may start a deeper correction to $1,900 and then $1,750.
반대로 가격이 채널에 다시 진입하면 더 높은 수준이 계속해서 판매자를 끌어들이는 신호가 됩니다. $2,200 아래로 떨어지면 해당 쌍이 채널 지지선으로 떨어질 수 있습니다. 채널 아래로 떨어지면 1,900달러에서 1,750달러까지 더 깊은 조정이 시작될 수 있기 때문에 이는 황소가 보호하는 데 여전히 중요합니다.
Solana (SOL) price analysis
솔라나(SOL) 가격 분석
Solana has been in a strong uptrend for the past several days. The bulls quickly cleared the psychological resistance of $100 on Dec. 23 and pushed the price to $126 on Dec. 25.
솔라나는 지난 며칠 동안 강한 상승세를 보였습니다. 상승세는 12월 23일 100달러의 심리적 저항선을 빠르게 청산하고 12월 25일 가격을 126달러로 끌어올렸습니다.
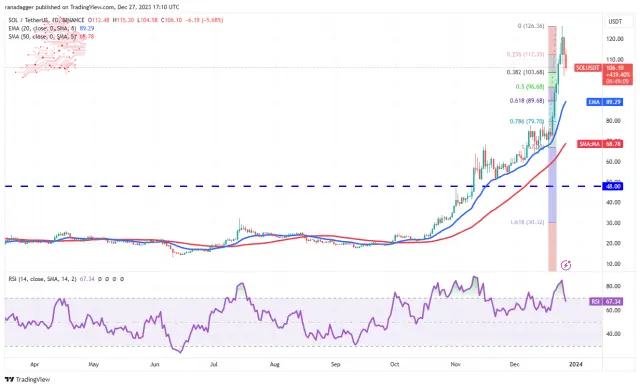
Profit booking started a pullback on Dec. 26, but the long tail on the day’s candlestick shows strong buying at the 38.2% Fibonacci retracement level of $103. The price was turned down on Dec. 27, indicating that the bears are in no mood to give up.
이익 예약은 12월 26일부터 하락을 시작했지만 당일 캔들스틱의 롱테일은 38.2% 피보나치 되돌림 수준인 $103에서 강력한 매수를 보여줍니다. 가격은 12월 27일에 하락했는데, 이는 하락세가 포기할 마음이 없음을 나타냅니다.
If the price drops below $103, the SOL/USDT pair could decline to the 20-day EMA ($89), near the 61.8% Fibonacci retracement level. A break below the 20-day EMA will suggest a change in the short-term trend. The bulls will regain control if they catapult the price above $126.
가격이 $103 아래로 떨어지면 SOL/USDT 쌍은 61.8% 피보나치 되돌림 수준 근처인 20일 EMA($89)로 하락할 수 있습니다. 20일 EMA 아래로 떨어지면 단기 추세의 변화를 암시합니다. 상승세는 가격이 126달러 이상으로 치솟으면 통제권을 다시 얻을 것입니다.
BNB price analysis
BNB turned up from the 20-day EMA ($262) on Dec. 25 and soared above the neckline on Dec. 26, completing a bullish inverse head-and-shoulders pattern.
BNB 가격 분석 BNB는 12월 25일 20일 EMA($262)에서 상승하여 12월 26일 네크라인 위로 치솟으며 강세 역헤드앤숄더 패턴을 완성했습니다.
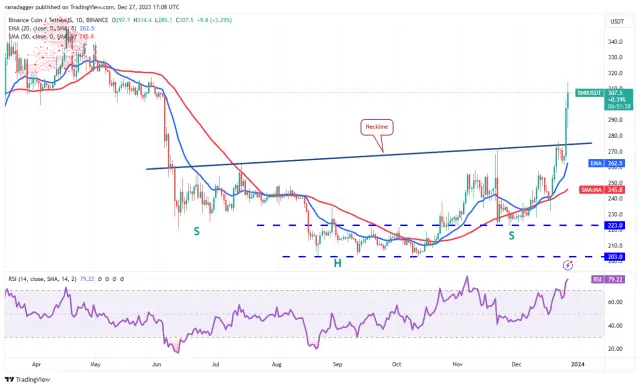
The bears tried to pull the price down toward the neckline on Dec. 27, but the long tail on the candlestick shows aggressive buying on dips. Buyers will try to maintain the momentum and shove the price to the pattern target of $333 and eventually to $350.
하락세는 12월 27일 가격을 네크라인까지 끌어내리려 했지만 캔들의 긴 꼬리는 하락 시 공격적인 매수를 보여줍니다. 구매자는 모멘텀을 유지하고 가격을 패턴 목표인 333달러, 결국 350달러까지 끌어올리려고 노력할 것입니다.
Meanwhile, the bears are likely to have other plans. They will try to stall the upmove near $317 and start a correction. Sellers must tug the BNB/USDT pair below the neckline to make a comeback.
한편, 곰들은 다른 계획을 가지고 있을 가능성이 높습니다. 그들은 $317 근처에서 상승세를 멈추고 조정을 시작하려고 할 것입니다. 판매자는 복귀를 위해 BNB/USDT 쌍을 네크라인 아래로 끌어내야 합니다.
XRP price analysis
XRP 가격 분석
XRP has been range-bound between $0.56 and $0.67 for the past few days, signalling a balance between buyers and sellers.
XRP는 지난 며칠 동안 0.56달러에서 0.67달러 사이의 범위를 유지해 구매자와 판매자 간의 균형을 나타냈습니다.
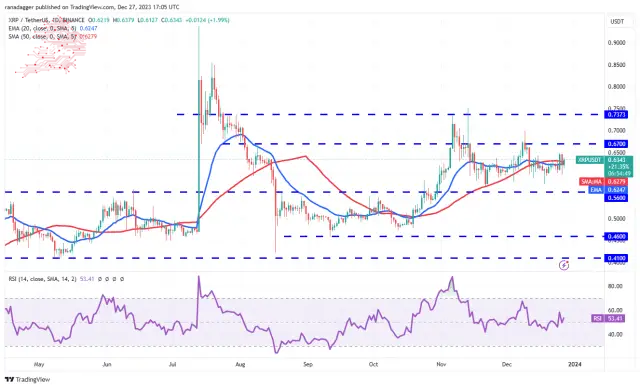
Both moving averages have flattened out, and the RSI is near the midpoint, suggesting that the range-bound action may continue longer. The first sign of strength will be a break and close above $0.67. The XRP/USDT pair may rise to $0.74, where the bears are expected to mount a strong defence.
두 이동 평균 모두 평탄해졌고 RSI는 중간 지점 근처에 있어 범위 제한 조치가 더 오래 지속될 수 있음을 나타냅니다. 강세의 첫 번째 신호는 $0.67 이상으로 마감되는 것입니다. XRP/USDT 쌍은 0.74달러까지 상승할 수 있으며, 여기서 하락세는 강력한 방어력을 발휘할 것으로 예상됩니다.
On the downside, the bears must sink and keep the price below $0.56 to seize control. The pair could then slide to the solid support at $0.46.
단점은 하락세를 보이고 가격을 $0.56 이하로 유지하여 통제권을 장악해야 한다는 것입니다. 그런 다음 쌍은 $0.46의 견고한 지지대로 미끄러질 수 있습니다.
Cardano (ADA) price analysis
Cardano has been consolidating in an uptrend. The price action of the past few days has formed a symmetrical triangle pattern, indicating indecision between the bulls and the bears.
Cardano(ADA) 가격 분석 Cardano는 상승세를 이어가고 있습니다. 지난 며칠 동안의 가격 움직임은 대칭적인 삼각형 패턴을 형성하여 황소와 곰 사이의 우유부단함을 나타냅니다.
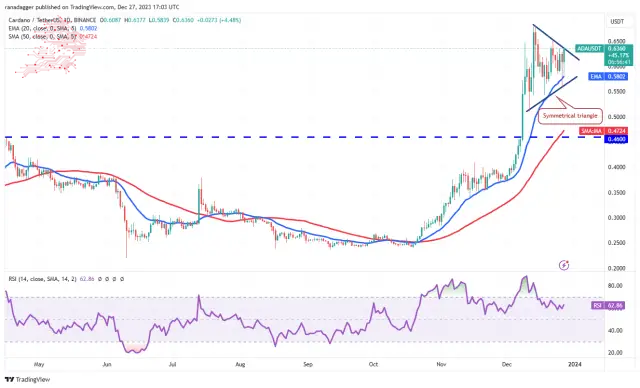
The upsloping moving averages and the positive territory’s RSI signal buyers an advantage. A break and close above the triangle will suggest that the bulls have absorbed the supply. That could propel the price to $0.69 and later to the pattern target of $0.80.
상승하는 이동 평균과 양수 영역의 RSI는 구매자에게 이점을 나타냅니다. 삼각형 위의 돌파 및 종가는 황소가 공급을 흡수했음을 나타냅니다. 이는 가격을 0.69달러로 끌어올리고 나중에는 패턴 목표인 0.80달러로 끌어올릴 수 있습니다.
On the contrary, if the price turns down and breaks below the triangle, it will suggest that the bears remain active at higher levels. The ADA/USDT pair could collapse to the strong support at $0.46.
반대로, 가격이 하락하여 삼각형 아래로 떨어지면 하락세는 더 높은 수준에서 계속 활발하게 활동한다는 의미입니다. ADA/USDT 쌍은 $0.46의 강력한 지지선으로 무너질 수 있습니다.
Avalanche (AVAX) price analysis
Avalanche(AVAX) 가격 분석
Avalanche turned down from $49.96 on Dec. 24, indicating that the traders booked profits near the psychological level of $50.
Avalanche는 12월 24일 $49.96에서 하락했는데, 이는 거래자들이 심리적 수준인 $50에 가까운 이익을 기록했음을 나타냅니다.
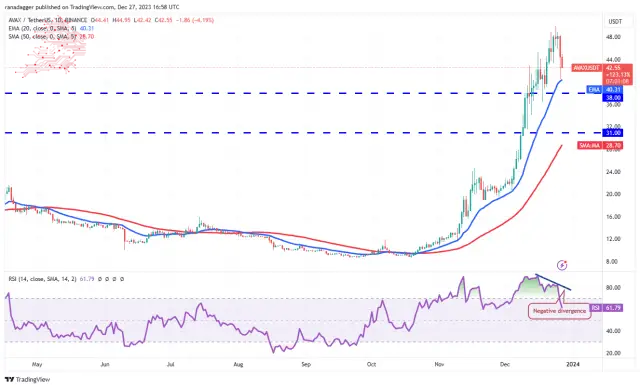
The selling picked up on Dec. 26, pulling the price to the 20-day EMA ($40.31). The long tail on the day’s candlestick shows that the bulls view the dips as a buying opportunity. Buyers must push the price above $50 to resume the uptrend.
12월 26일에 매도세가 회복되면서 가격이 20일 EMA($40.31)까지 떨어졌습니다. 당일 캔들스틱의 긴 꼬리는 상승세가 하락세를 매수 기회로 보고 있음을 나타냅니다. 상승 추세를 재개하려면 구매자는 가격을 $50 이상으로 올려야 합니다.
The risk to the bullish view is that the RSI is showing signs of forming a bearish divergence. This suggests that the positive momentum may be weakening. That signals a minor correction or consolidation in the near term. The selling could pick up if the AVAX/USDT pair skids below the 20-day EMA. The pair may then slump to $34
강세 전망에 대한 위험은 RSI가 약세 다이버전스 형성 징후를 보이고 있다는 것입니다. 이는 긍정적인 모멘텀이 약화될 수 있음을 의미합니다. 이는 단기적으로 약간의 조정이나 통합을 의미합니다. AVAX/USDT 쌍이 20일 EMA 아래로 미끄러지면 매도가 증가할 수 있습니다. 그러면 통화쌍은 34달러까지 하락할 수 있습니다.
Dogecoin (DOGE) price analysis
The bears pulled Dogecoin below the 20-day EMA ($0.09) on Dec. 26, but the long tail on the candlestick shows strong buying at the 50-day SMA ($0.09).
Dogecoin(DOGE) 가격 분석 하락세는 12월 26일 Dogecoin을 20일 EMA($0.09) 아래로 끌어내렸지만, 캔들스틱의 긴 꼬리는 50일 SMA($0.09)에서 강력한 매수를 보여줍니다.
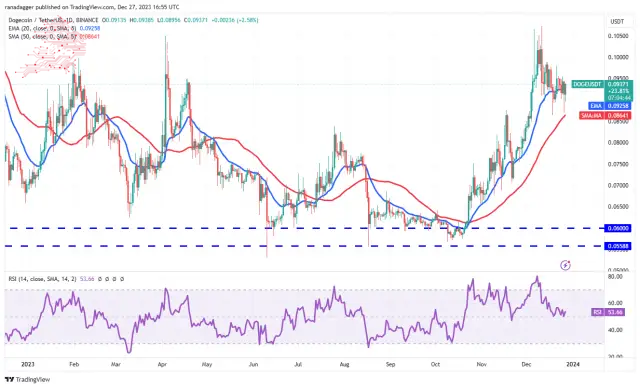
The flattish 20-day EMA and the RSI near the midpoint suggest a balance between supply and demand. This equilibrium could shift in favour of the bears if they sink and sustain the price below the 50-day SMA. The pair may then tumble to $0.07.
평탄한 20일 EMA와 중간 지점 부근의 RSI는 수요와 공급의 균형을 시사합니다. 하락세가 하락하여 50일 SMA 아래로 가격이 유지된다면 이 균형은 하락세에게 유리하게 바뀔 수 있습니다. 그러면 통화쌍은 $0.07까지 하락할 수 있습니다.
If buyers want the upper hand, they must drive the price above the $0.10 to $0.11 resistance zone. If they manage to do that, the DOGE/USDT pair could start the next leg of the uptrend to $0.16.
구매자가 우위를 점하려면 가격을 $0.10~$0.11 저항대 위로 끌어 올려야 합니다. 그렇게 한다면 DOGE/USDT 쌍은 $0.16까지 상승 추세의 다음 구간을 시작할 수 있습니다.
Polkadot (DOT) price analysis
Polkadot is correcting in an uptrend. The price turned down from $9.59 on Dec. 26, indicating that the bears are defending the overhead resistance at $10.
Polkadot(DOT) 가격 분석 Polkadot은 상승 추세에서 조정을 받고 있습니다. 가격은 12월 26일 $9.59에서 하락했는데, 이는 하락세가 $10에서 머리 위 저항을 방어하고 있음을 나타냅니다.
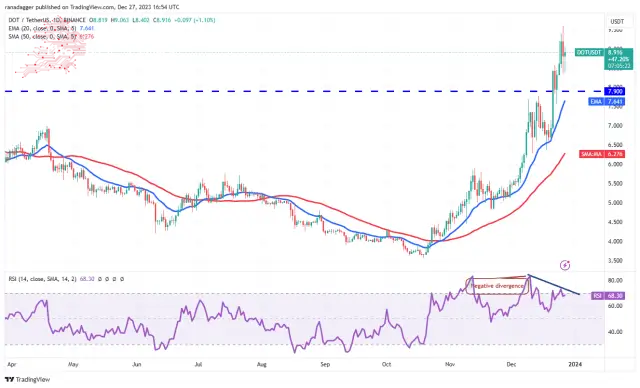
The DOT/USDT pair will likely correct to the breakout level of $7.90. If the price rebounds off this support, it will imply that the sentiment remains positive and traders are buying on dips. The bulls will then make one more attempt to clear the obstacle at $10 and start the journey to $12.
DOT/USDT 쌍은 $7.90의 돌파 수준으로 조정될 가능성이 높습니다. 가격이 이 지지선에서 반등한다면 이는 정서가 여전히 긍정적이고 거래자들이 하락세에 매수하고 있음을 의미합니다. 그런 다음 황소는 $10에서 장애물을 제거하고 $12까지 여행을 시작하기 위해 한 번 더 시도합니다.
The risk to the upside is that the RSI is forming a negative divergence. This suggests that the bullish momentum could be slowing. The pair may spend some time inside the range between $7.90 and $9.59 in the short term.
상승 위험은 RSI가 음의 다이버전스를 형성하고 있다는 것입니다. 이는 강세 모멘텀이 둔화될 수 있음을 시사합니다. 단기적으로는 $7.90~$9.59 범위 내에서 시간을 보낼 수 있습니다.
Polygon (MATIC) price analysis
Polygon bounced off the 20-day EMA ($0.87) on Dec. 25 and rose above the stiff overhead resistance of $1 on Dec. 26.
폴리곤(MATIC) 가격 분석 폴리곤은 12월 25일 20일 EMA($0.87)에서 반등했고 12월 26일에는 견고한 오버헤드 저항인 $1를 넘어섰습니다.
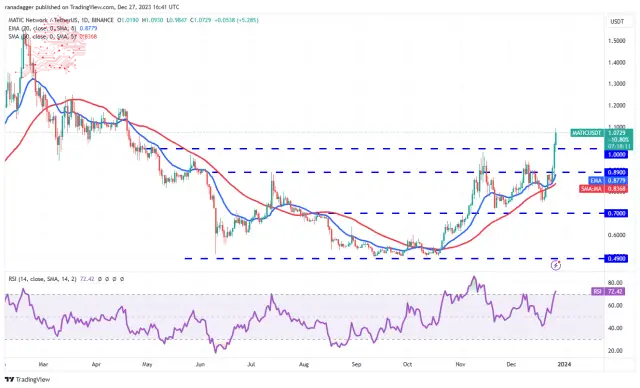
Buyers are trying to extend the upmove on Dec. 27 but may face selling near $1.20. The MATIC/USDT pair could drop to $1 if the price turns down the overhead resistance. If bulls flip this level into support, it will signal strength. The bulls will then try to overcome the barrier at $1.20 and push the price to $1.50.
구매자들은 12월 27일 상승세를 연장하려고 노력하고 있지만 1.20달러 근처에서 매도될 수도 있습니다. 가격이 오버헤드 저항을 낮추면 MATIC/USDT 쌍이 1달러로 떨어질 수 있습니다. 황소가 이 수준을 지지로 바꾸면 강세를 나타낼 것입니다. 그런 다음 황소는 $1.20의 장벽을 극복하고 가격을 $1.50으로 끌어올리려고 노력할 것입니다.
Instead, if bears pull the price below $1, it may trap the aggressive bulls. That could accelerate selling and pull the pair to the $0.89 support.
대신, 하락세가 가격을 1달러 아래로 끌어내리면 공격적인 상승세를 가두게 될 수 있습니다. 이는 매도를 가속화하고 해당 쌍을 $0.89 지지선으로 끌어올 수 있습니다.
Source – Rakesh Upadhyay
출처 - Rakesh Upadhyay
Source: https://thebittimes.com/latest-market-overview-27th-dec-btc-eth-sol-bnb-xrp-ada-avax-doge-dot-matic-tbt74987.html
출처: https://thebittimes.com/latest-market-overview-27th-dec-btc-eth-sol-bnb-xrp-ada-avax-doge-dot-matic-tbt74987.html
 BlockchainReporter
 CoinPedia News
 TheNewsCrypto
 CFN
CFN DogeHome
 Optimisus
 Crypto News Land
 Optimisus


