


Bitcoin is currently displaying a bullish pattern, although it’s important to note that the RSI exhibits a negative divergence. This situation is creating mixed signals regarding Bitcoin’s short-term directional movement.
ビットコインは現在強気のパターンを示していますが、RSIがマイナスの乖離を示していることに注意することが重要です。この状況は、ビットコインの短期的な方向性の動きに関してさまざまなシグナルを生み出しています。
Bitcoin has retained its gains in early December, indicating a trend where buyers are stepping in during minor dips. According to CoinShares data, there was an influx of $87.6 million into Bitcoin funds for the week ending on December 22nd.
ビットコインは12月初旬の上昇を維持しており、小規模な下落時に買い手が介入する傾向を示している。 CoinSharesのデータによると、12月22日までの週にビットコインファンドに8,760万ドルの流入があった。
Additionally, data from ETFGI, a research firm specialising in exchange-traded funds (ETFs), reveals that in November, there were inflows of $1.31 billion into cryptocurrency ETFs and exchange-traded products (ETPs). This brings the total inflows for the year to $1.60 billion.
さらに、上場投資信託(ETF)を専門とする調査会社ETFGIのデータによると、11月には仮想通貨ETFと上場投資商品(ETP)に13億1000万ドルの資金が流入したことが明らかになった。これにより、年間の総流入額は16億ドルとなる。
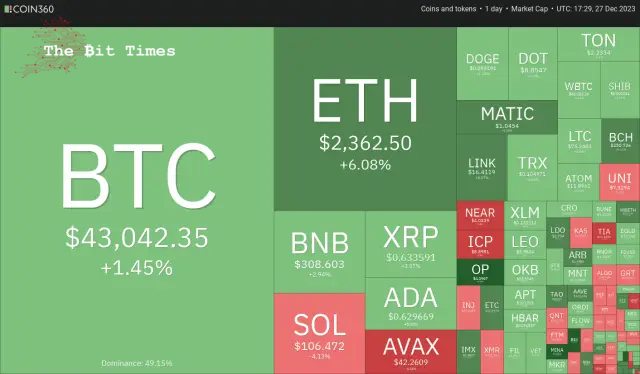
Investors seem to be accumulating Bitcoin before the anticipated approval of a spot Bitcoin ETF in January. Business Intelligence firm MicroStrategy added 14,620 Bitcoin to increase its total stockpile to 189,150. The latest acquisition was made at $42,110 per Bitcoin, taking its total average purchase price to about $31,168.
投資家は、1月に予想されるスポットビットコインETFの承認を前にビットコインを貯めているようだ。ビジネス インテリジェンス企業の MicroStrategy は、14,620 ビットコインを追加して、総在庫量を 189,150 に増やしました。最新の買収はビットコインあたり42,110ドルで行われ、平均購入価格の総額は約31,168ドルとなった。
Will Bitcoin and altcoins continue their northward journey in the last few days of the year? Let’s analyse the charts of the top 10 cryptocurrencies to find out.
今年最後の数日間、ビットコインとアルトコインは北への旅を続けるだろうか?それを知るために、トップ 10 の仮想通貨のチャートを分析してみましょう。
Bitcoin (BTC) price analysis
ビットコイン(BTC)価格分析
Bitcoin has been stuck between the 20-day exponential moving average ($42,513) and the overhead resistance at $44,700.
ビットコインは、20日間の指数移動平均(42,513ドル)と直上の抵抗線である44,700ドルの間で立ち往生している。
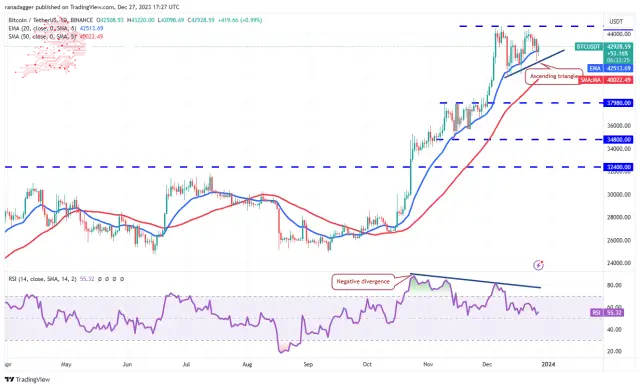
The price action of the past few days has formed an ascending triangle pattern that will complete on a break and close above $44,700. The BTC/USDT pair could then start the next leg of the uptrend toward the pattern target of $49,178.
過去数日間の価格動向は上昇三角パターンを形成しており、ブレイクして完了し、44,700ドルを超えて終了します。その後、BTC/USDT ペアはパターン目標の 49,178 ドルに向けて上昇トレンドの次のレグを開始する可能性があります。
Contrarily, if the price turns down and breaks below the triangle, it will invalidate the positive setup. That may trigger the stops of several traders, pulling the cost to the 50-day simple moving average ($40,022) and later to $37,980.
逆に、価格が下落してトライアングルを下抜けた場合、ポジティブなセットアップは無効になります。これにより複数のトレーダーのストップがかかり、コストは50日単純移動平均(4万022ドル)、その後は3万7980ドルにまで引き下げられる可能性がある。
Ether (ETH) price analysis
イーサ(ETH)価格分析
イーサはここ数日間、下降チャネルパターン内で取引されていたが、強気派が価格を2,200ドル以下に維持することを許さなかったことは明るい兆候だ。
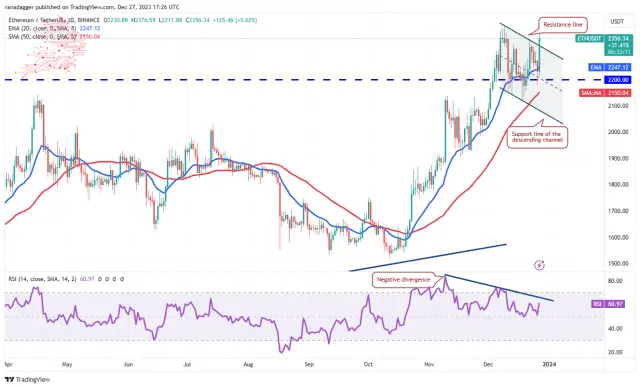
Solid buying on Dec. 27 propelled the price above the descending channel. If bulls maintain the price above the channel, the possibility of a break above $2,403 increases. The ETH/USDT pair could then ascend to $3,000.
12月27日の堅調な買いにより、価格は下降チャネルを上回りました。強気派がチャネルを上回る価格を維持すれば、2,403ドルを突破する可能性が高まる。その後、ETH/USDTペアは3,000ドルに上昇する可能性があります。
Conversely, if the price re-enters the channel, it will signal that higher levels continue to attract sellers. The break below $2,200 could sink the pair to the channel’s support line. This remains critical for the bulls to protect because a drop below the channel may start a deeper correction to $1,900 and then $1,750.
逆に、価格が再びチャネルに入った場合は、より高いレベルが売り手を引き付け続けていることを示します。 2,200ドルを下回ると、ペアはチャネルのサポートラインに沈む可能性があります。チャネルを下回ると1,900ドル、そして1,750ドルへとさらに深い調整が始まる可能性があるため、これは強気派が守るべき重要な点であることに変わりはない。
Solana (SOL) price analysis
ソラナ (SOL) 価格分析
Solana has been in a strong uptrend for the past several days. The bulls quickly cleared the psychological resistance of $100 on Dec. 23 and pushed the price to $126 on Dec. 25.
ソラナはここ数日間、強い上昇傾向にあります。強気派は12月23日に100ドルの心理的抵抗をすぐに乗り越え、12月25日には価格を126ドルまで押し上げた。
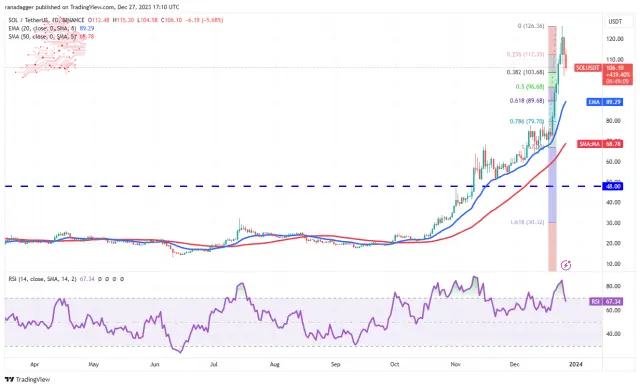
Profit booking started a pullback on Dec. 26, but the long tail on the day’s candlestick shows strong buying at the 38.2% Fibonacci retracement level of $103. The price was turned down on Dec. 27, indicating that the bears are in no mood to give up.
利益確定は12月26日に反落を始めたが、その日のローソク足のロングテールは38.2%フィボナッチ・リトレースメントの103ドル水準で強い買いが入っていることを示している。 12月27日に価格は引き下げられ、弱気派が諦める気はないことを示している。
If the price drops below $103, the SOL/USDT pair could decline to the 20-day EMA ($89), near the 61.8% Fibonacci retracement level. A break below the 20-day EMA will suggest a change in the short-term trend. The bulls will regain control if they catapult the price above $126.
価格が103ドルを下回った場合、SOL/USDTペアは61.8%フィボナッチ・リトレースメント・レベル付近の20日間EMA(89ドル)まで下落する可能性がある。 20日間EMAを下回ると、短期トレンドの変化が示唆されます。価格が126ドルを超えれば強気派が主導権を取り戻すだろう。
BNB price analysis
BNB turned up from the 20-day EMA ($262) on Dec. 25 and soared above the neckline on Dec. 26, completing a bullish inverse head-and-shoulders pattern.
BNB価格分析 BNBは12月25日に20日間EMA(262ドル)から上昇し、12月26日にはネックラインを超えて急上昇し、強気の逆ヘッドアンドショルダーパターンを完成させた。
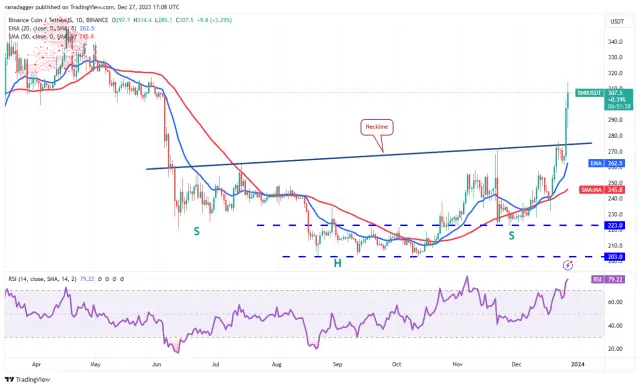
The bears tried to pull the price down toward the neckline on Dec. 27, but the long tail on the candlestick shows aggressive buying on dips. Buyers will try to maintain the momentum and shove the price to the pattern target of $333 and eventually to $350.
弱気派は12月27日のネックラインに向けて価格を引き下げようとしたが、ローソク足の長い尾は押し目での積極的な買いを示している。買い手はこの勢いを維持し、価格をパターン目標の333ドル、最終的には350ドルまで押し上げようとするだろう。
Meanwhile, the bears are likely to have other plans. They will try to stall the upmove near $317 and start a correction. Sellers must tug the BNB/USDT pair below the neckline to make a comeback.
一方、クマたちは別の計画を立てている可能性が高い。彼らは317ドル付近での上昇を止め、調整を開始しようとするだろう。売り手は逆転するためにBNB/USDTペアをネックライン以下に引っ張る必要がある。
XRP price analysis
XRP価格分析
XRP has been range-bound between $0.56 and $0.67 for the past few days, signalling a balance between buyers and sellers.
XRPはここ数日間、0.56ドルから0.67ドルの間でレンジ内に収まっており、買い手と売り手のバランスが取れていることを示しています。
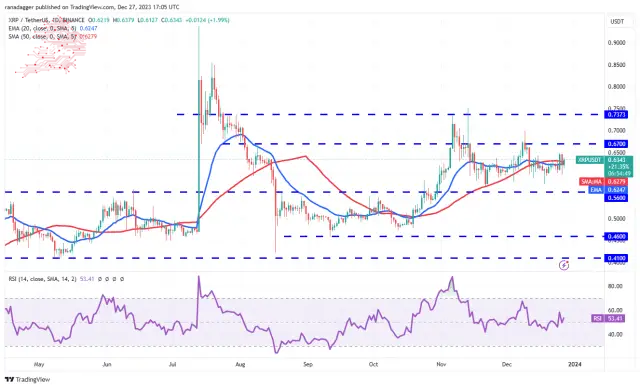
Both moving averages have flattened out, and the RSI is near the midpoint, suggesting that the range-bound action may continue longer. The first sign of strength will be a break and close above $0.67. The XRP/USDT pair may rise to $0.74, where the bears are expected to mount a strong defence.
両方の移動平均は横ばいとなっており、RSIは中間点付近にあり、レンジ内での動きがさらに長く続く可能性があることを示唆している。強さの最初の兆候はブレイクして0.67ドルを超えて終了することだろう。 XRP/USDTペアは0.74ドルまで上昇する可能性があり、弱気派は強力な防衛を展開すると予想される。
On the downside, the bears must sink and keep the price below $0.56 to seize control. The pair could then slide to the solid support at $0.46.
マイナス面としては、弱気派が主導権を握るには価格を0.56ドル以下に抑えなければならない。その後、ペアは0.46ドルの堅調なサポートまで下落する可能性がある。
Cardano (ADA) price analysis
Cardano has been consolidating in an uptrend. The price action of the past few days has formed a symmetrical triangle pattern, indicating indecision between the bulls and the bears.
Cardano (ADA) 価格分析 Cardano は上昇傾向にあります。過去数日間の価格動向は対称的な三角形のパターンを形成しており、強気派と弱気派の間で優柔不断な姿勢が示されています。
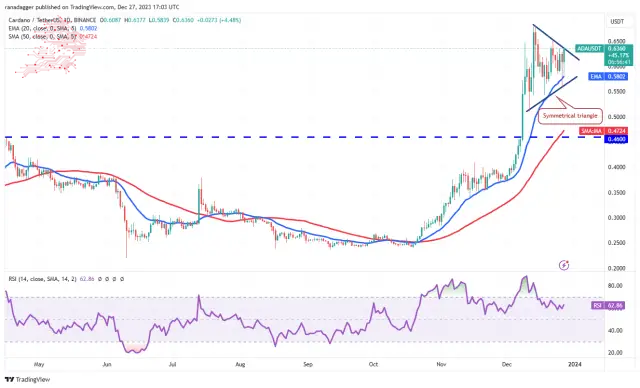
The upsloping moving averages and the positive territory’s RSI signal buyers an advantage. A break and close above the triangle will suggest that the bulls have absorbed the supply. That could propel the price to $0.69 and later to the pattern target of $0.80.
移動平均線の右肩上がりとプラス圏のRSIは、買い手に有利であることを示しています。三角形を上抜けて閉じると、強気派が供給を吸収したことを示唆します。これにより価格は0.69ドルに上昇し、その後はパターン目標の0.80ドルに達する可能性がある。
On the contrary, if the price turns down and breaks below the triangle, it will suggest that the bears remain active at higher levels. The ADA/USDT pair could collapse to the strong support at $0.46.
逆に、価格が下落してトライアングルを下抜けた場合は、弱気筋が高水準で引き続き活発であることを示唆します。 ADA/USDTペアは0.46ドルの強力なサポートまで崩れる可能性がある。
Avalanche (AVAX) price analysis
アバランチ (AVAX) 価格分析
Avalanche turned down from $49.96 on Dec. 24, indicating that the traders booked profits near the psychological level of $50.
アバランチは12月24日の49.96ドルから下落し、トレーダーが心理的水準の50ドル近くで利益を計上したことを示している。
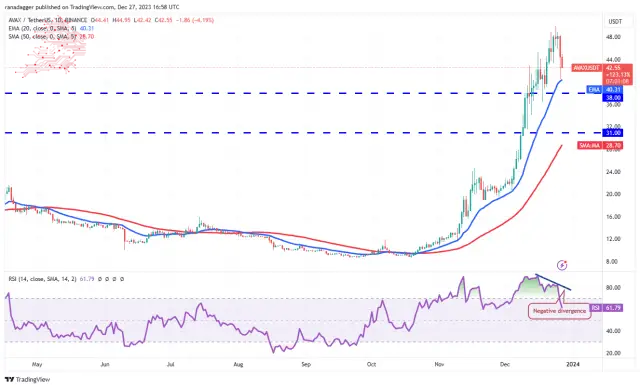
The selling picked up on Dec. 26, pulling the price to the 20-day EMA ($40.31). The long tail on the day’s candlestick shows that the bulls view the dips as a buying opportunity. Buyers must push the price above $50 to resume the uptrend.
12月26日に売りが加速し、価格は20日間EMA(40.31ドル)まで上昇した。その日のローソク足の長い尾は、強気派が下落を買いの機会と見ていることを示しています。上昇傾向を再開するには、買い手は価格を50ドル以上に押し上げる必要がある。
The risk to the bullish view is that the RSI is showing signs of forming a bearish divergence. This suggests that the positive momentum may be weakening. That signals a minor correction or consolidation in the near term. The selling could pick up if the AVAX/USDT pair skids below the 20-day EMA. The pair may then slump to $34
強気の見方に対するリスクは、RSIが弱気のダイバージェンスを形成する兆候を示していることだ。これは、ポジティブな勢いが弱まりつつある可能性を示唆しています。これは、短期的には小規模な調整または統合が起こることを示唆している。 AVAX/USDTペアが20日間EMAを下回れば、売りが加速する可能性がある。その後、ペアは34ドルまで下落する可能性がある
Dogecoin (DOGE) price analysis
The bears pulled Dogecoin below the 20-day EMA ($0.09) on Dec. 26, but the long tail on the candlestick shows strong buying at the 50-day SMA ($0.09).
ドージコイン(DOGE)価格分析 弱気派は12月26日にドージコインを20日間EMA(0.09ドル)以下に引き下げたが、ローソク足のロングテールは50日間SMA(0.09ドル)での強い買いを示している。
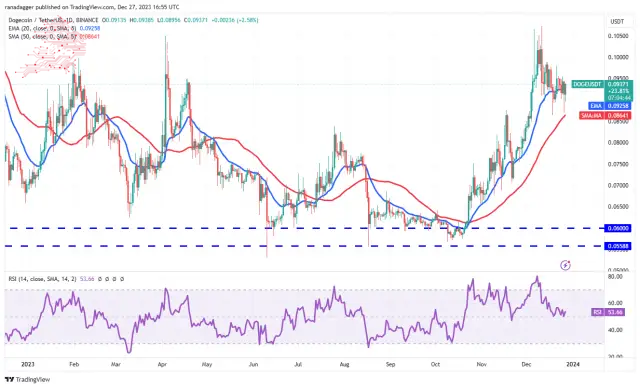
The flattish 20-day EMA and the RSI near the midpoint suggest a balance between supply and demand. This equilibrium could shift in favour of the bears if they sink and sustain the price below the 50-day SMA. The pair may then tumble to $0.07.
平坦な 20 日間 EMA と中間点付近の RSI は、需要と供給のバランスを示唆しています。弱気派が価格を50日SMAを下回って下落し維持した場合、この均衡は弱気派に有利に移る可能性がある。その後、ペアは0.07ドルまで下落する可能性がある。
If buyers want the upper hand, they must drive the price above the $0.10 to $0.11 resistance zone. If they manage to do that, the DOGE/USDT pair could start the next leg of the uptrend to $0.16.
買い手が優位性を望む場合、価格を0.10ドルから0.11ドルのレジスタンスゾーンを超えて押し上げる必要があります。それができれば、DOGE/USDTペアは0.16ドルまで上昇トレンドの次のレグを開始する可能性がある。
Polkadot (DOT) price analysis
Polkadot is correcting in an uptrend. The price turned down from $9.59 on Dec. 26, indicating that the bears are defending the overhead resistance at $10.
ポルカドット(DOT)価格分析 ポルカドットは上昇傾向にあります。価格は12月26日の9.59ドルから下落し、弱気派が10ドルの頭上の抵抗線を守っていることを示している。
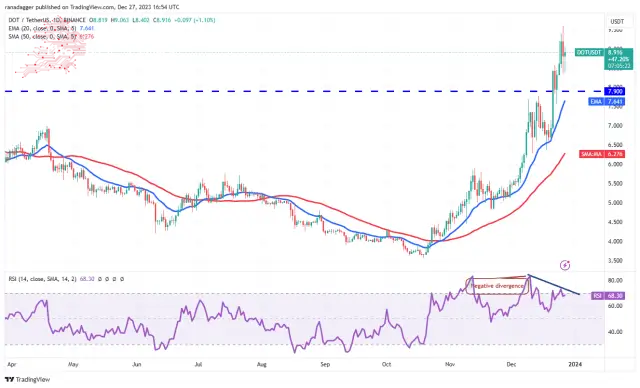
The DOT/USDT pair will likely correct to the breakout level of $7.90. If the price rebounds off this support, it will imply that the sentiment remains positive and traders are buying on dips. The bulls will then make one more attempt to clear the obstacle at $10 and start the journey to $12.
DOT/USDTペアはおそらく7.90ドルのブレイクアウトレベルに修正されるだろう。価格がこのサポートから反発した場合、センチメントは引き続きポジティブであり、トレーダーが押し目買いをしていることを意味します。その後、強気派は 10 ドルの障害をクリアして 12 ドルへの旅を開始するためにもう一度試みます。
The risk to the upside is that the RSI is forming a negative divergence. This suggests that the bullish momentum could be slowing. The pair may spend some time inside the range between $7.90 and $9.59 in the short term.
上値へのリスクは、RSI がマイナスのダイバージェンスを形成していることです。これは強気の勢いが鈍化しつつある可能性を示唆している。短期的には7.90ドルから9.59ドルの範囲内でしばらく過ごす可能性がある。
Polygon (MATIC) price analysis
Polygon bounced off the 20-day EMA ($0.87) on Dec. 25 and rose above the stiff overhead resistance of $1 on Dec. 26.
Polygon (MATIC) 価格分析 Polygon は 12 月 25 日に 20 日間 EMA (0.87 ドル) から反発し、12 月 26 日には 1 ドルの厳しい直上抵抗線を上回りました。
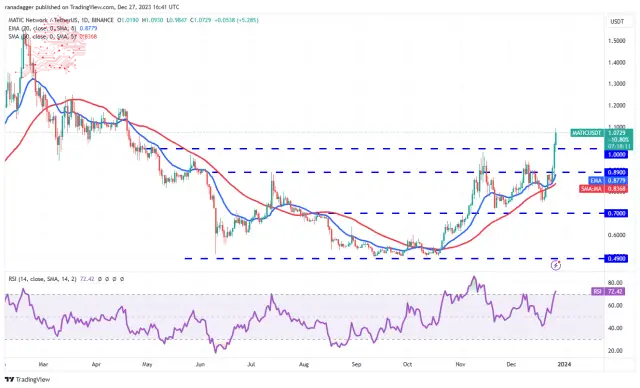
Buyers are trying to extend the upmove on Dec. 27 but may face selling near $1.20. The MATIC/USDT pair could drop to $1 if the price turns down the overhead resistance. If bulls flip this level into support, it will signal strength. The bulls will then try to overcome the barrier at $1.20 and push the price to $1.50.
買い手は12月27日の上昇幅を延長しようとしているが、1.20ドル付近で売りに直面する可能性がある。価格が頭上の抵抗線を下回れば、MATIC/USDTペアは1ドルまで下落する可能性がある。強気派がこのレベルをサポートに転換した場合、それは強さを示すことになります。その後、強気派は1.20ドルの壁を乗り越え、価格を1.50ドルまで押し上げようとするだろう。
Instead, if bears pull the price below $1, it may trap the aggressive bulls. That could accelerate selling and pull the pair to the $0.89 support.
むしろ、弱気派が価格を1ドル以下に引き下げれば、積極的な強気派を罠にはめる可能性がある。そうなれば売りが加速し、ペアは0.89ドルのサポートまで引き上げられる可能性がある。
Source – Rakesh Upadhyay
出典 – ラケシュ・ウパディヤイ
Source: https://thebittimes.com/latest-market-overview-27th-dec-btc-eth-sol-bnb-xrp-ada-avax-doge-dot-matic-tbt74987.html
出典: https://thebittimes.com/latest-market-overview-27th-dec-btc-eth-sol-bnb-xrp-ada-avax-doge-dot-matic-tbt74987.html
 TheNewsCrypto
 CFN
CFN DogeHome
 Optimisus
 Crypto News Land
 Optimisus
 Cryptopolitan_News


