In the cryptocurrency market, technical analysis stands out as an indicator that investors, especially those trading in the futures market, must continuously monitor. What clues does technical analysis provide for Dogecoin, which was trading at the level of $0.1005 at the time the article was written? We examine this question with a detailed chart analysis and important support and resistance levels.
En el mercado de las criptomonedas, el análisis técnico destaca como un indicador que los inversores, especialmente aquellos que operan en el mercado de futuros, deben monitorear continuamente. ¿Qué pistas proporciona el análisis técnico para Dogecoin, que cotizaba al nivel de 0,1005 dólares en el momento en que se escribió el artículo? Examinamos esta pregunta con un análisis gráfico detallado y niveles importantes de soporte y resistencia.
Dogecoin Chart Analysis
Análisis de gráficos de Dogecoin
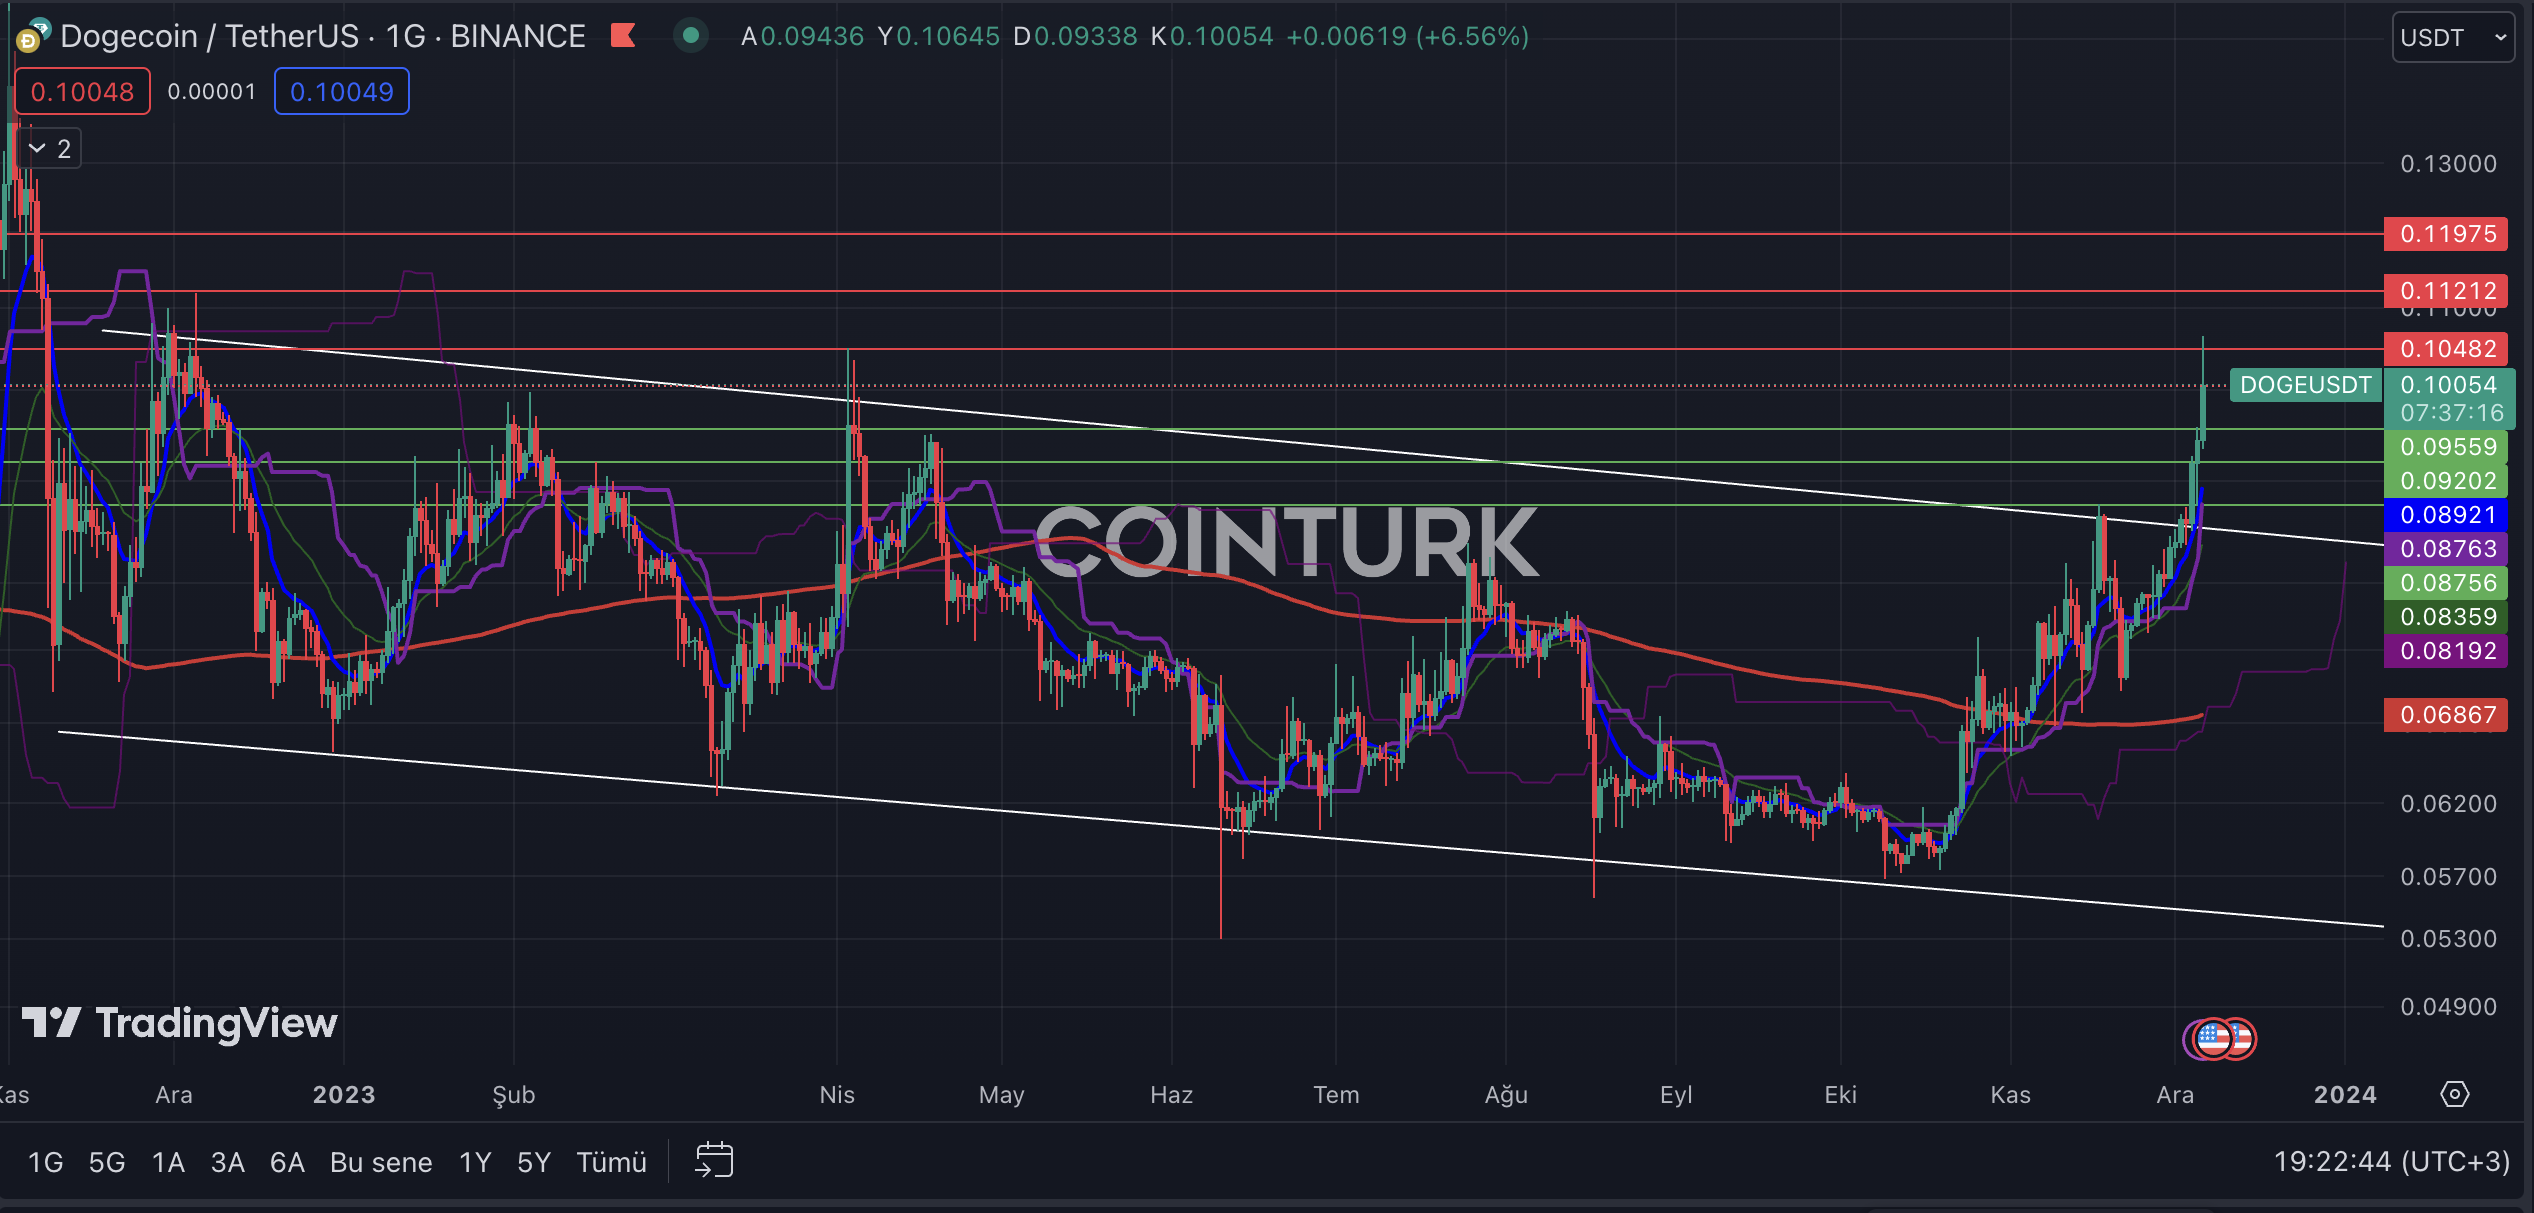
The daily DOGE chart shows that the descending channel formation structure, which has been ongoing since November 2022, was recently surpassed with the latest upward movements due to a resistance breakout. The fact that the resistance line was not retested after this momentum has created a big question mark on the DOGE front. In such breakouts, the first issue of interest to analysts is whether the price will perform a retest or not.
El gráfico diario de DOGE muestra que la estructura de formación del canal descendente, que ha estado en curso desde noviembre de 2022, fue superada recientemente con los últimos movimientos alcistas debido a una ruptura de resistencia. El hecho de que la línea de resistencia no se haya vuelto a probar después de este impulso ha creado un gran signo de interrogación en el frente de DOGE. En tales rupturas, la primera cuestión de interés para los analistas es si el precio realizará una nueva prueba o no.
The most important support levels to be followed on the DOGE daily chart are, respectively; $0.0955, $0.0920, and $0.0875. In particular, a daily bar closing below the $0.0875 level will cause the price to re-enter the formation zone and create selling pressure on the DOGE front.
Los niveles de soporte más importantes a seguir en el gráfico diario de DOGE son, respectivamente; $0,0955, $0,0920 y $0,0875. En particular, una barra diaria que cierra por debajo del nivel de $ 0,0875 hará que el precio vuelva a entrar en la zona de formación y creará presión de venta en el frente de DOGE.
The most important resistance levels to be observed on the DOGE daily chart are, respectively; $0.1048, $0.1121, and $0.1197. Especially, a daily bar closing above the $0.1048 level, which posed a significant barrier during the last rise on December 6, will accelerate DOGE’s momentum.
Los niveles de resistencia más importantes que se observarán en el gráfico diario de DOGE son, respectivamente; $0,1048, $0,1121 y $0,1197. Especialmente, una barra diaria que cierre por encima del nivel de $ 0,1048, que representó una barrera significativa durante el último aumento del 6 de diciembre, acelerará el impulso de DOGE.

DOGE/ETH Chart Analysis
Análisis del gráfico DOGE/ETH
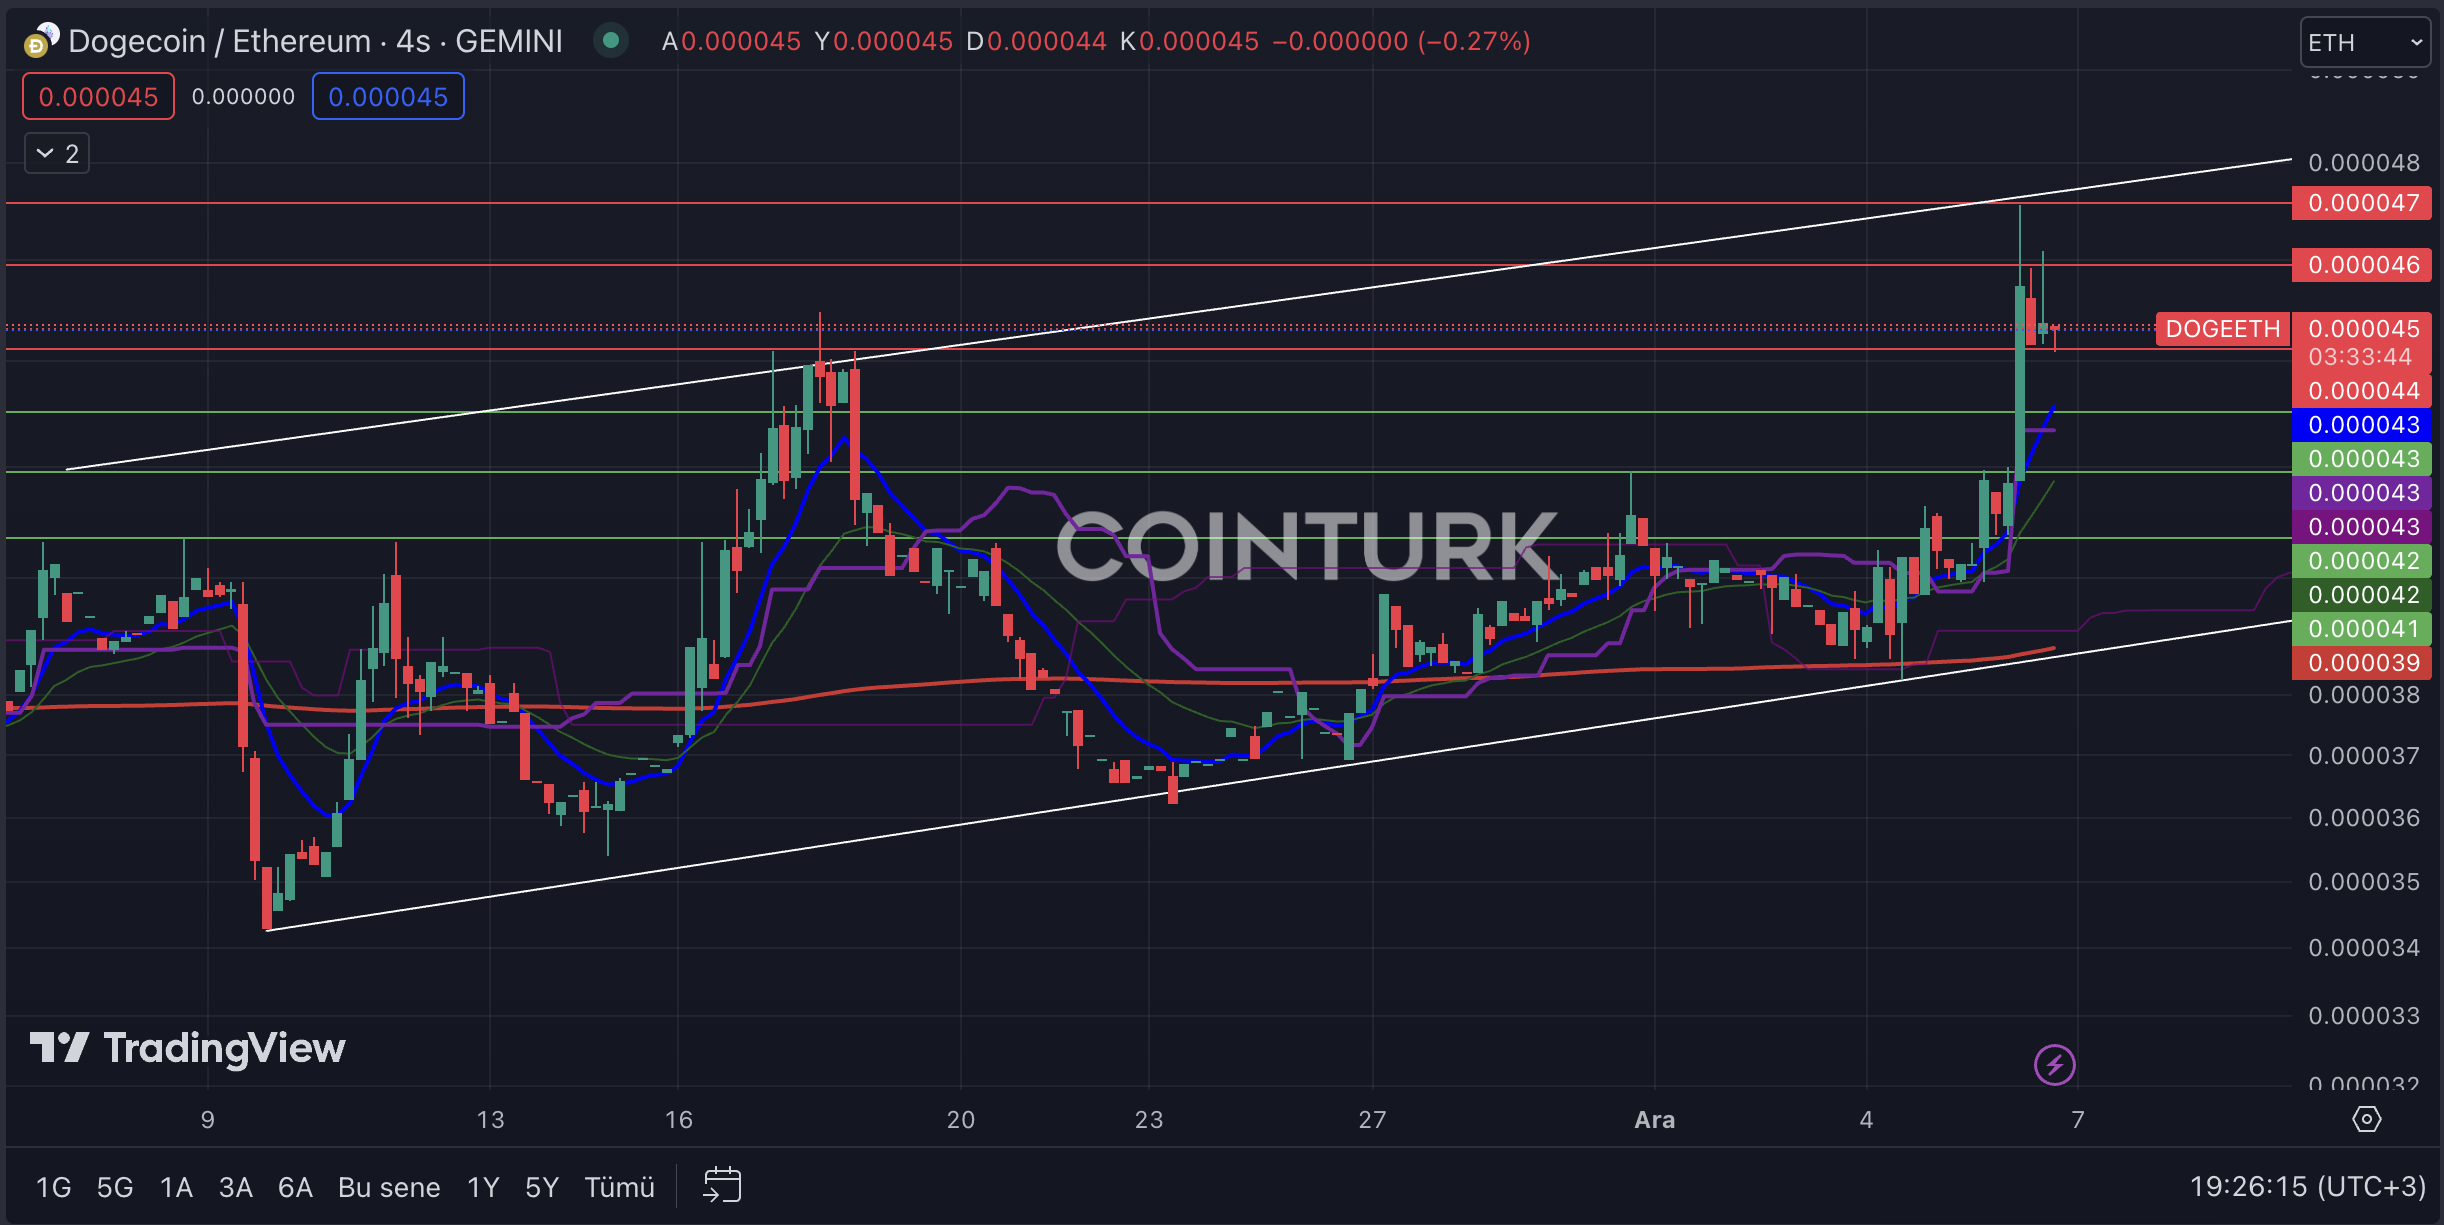
The first noticeable formation structure in the daily DOGE/ETH chart is the ascending channel formation. The lack of resistance breakout in the most recent bar formations, like the process that occurred on November 17, could lead to significant selling pressure.
La primera estructura de formación notable en el gráfico diario DOGE/ETH es la formación del canal ascendente. La falta de ruptura de resistencia en las formaciones de barras más recientes, como el proceso que ocurrió el 17 de noviembre, podría generar una presión de venta significativa.
The most important support levels to be monitored on the daily DOGE/ETH chart are, respectively; 0.000041, 0.000042, and 0.000043. In particular, a daily bar closing below the 0.000043 level, which intersects with the EMA 7 (blue line), will cause Dogecoin to lose value against Ethereum.
Los niveles de soporte más importantes a monitorear en el gráfico diario DOGE/ETH son, respectivamente; 0,000041, 0,000042 y 0,000043. En particular, una barra diaria que cierra por debajo del nivel 0.000043, que se cruza con la EMA 7 (línea azul), hará que Dogecoin pierda valor frente a Ethereum.
The most important resistance levels to be considered on the DOGE/ETH chart are, respectively; 0.0000455, 0.0000460, and 0.0000470. Especially, surpassing the 0.000047 level, which posed as a significant barrier during the last rise and intersects with the formation resistance, will accelerate DOGE’s momentum against Ethereum.
Los niveles de resistencia más importantes a considerar en el gráfico DOGE/ETH son, respectivamente; 0,0000455, 0,0000460 y 0,0000470. Especialmente, superar el nivel 0.000047, que representó una barrera importante durante el último aumento y se cruza con la resistencia de la formación, acelerará el impulso de DOGE contra Ethereum.

Continuar leyendo: https://en.coin-turk.com/technical-analysis-of-the-dogecoin-market/


 Crypto Intelligence
 BlockchainReporter
 CFN
CFN Crypto News Land
 Crypto News Land
 Crypto Intelligence
 DeFi Planet
 TheCoinrise Media
 TheCoinrise Media


