

Following recent weekly lows, Bitcoin and prominent alternative cryptocurrencies are observing a slight retraction, suggesting that investors might be capitalizing on the decline.
Tras los mínimos semanales recientes, Bitcoin y las principales criptomonedas alternativas están observando una ligera retracción, lo que sugiere que los inversores podrían estar capitalizando la caída.
In a recent assembly on September 20, the Federal Reserve chose against elevating interest rates. However, a prolonged period of elevated rates might be on the horizon. Jerome Powell, the Fed’s Chair, underscored in the subsequent media briefing that achieving a consistent 2% inflation rate remains a distant target.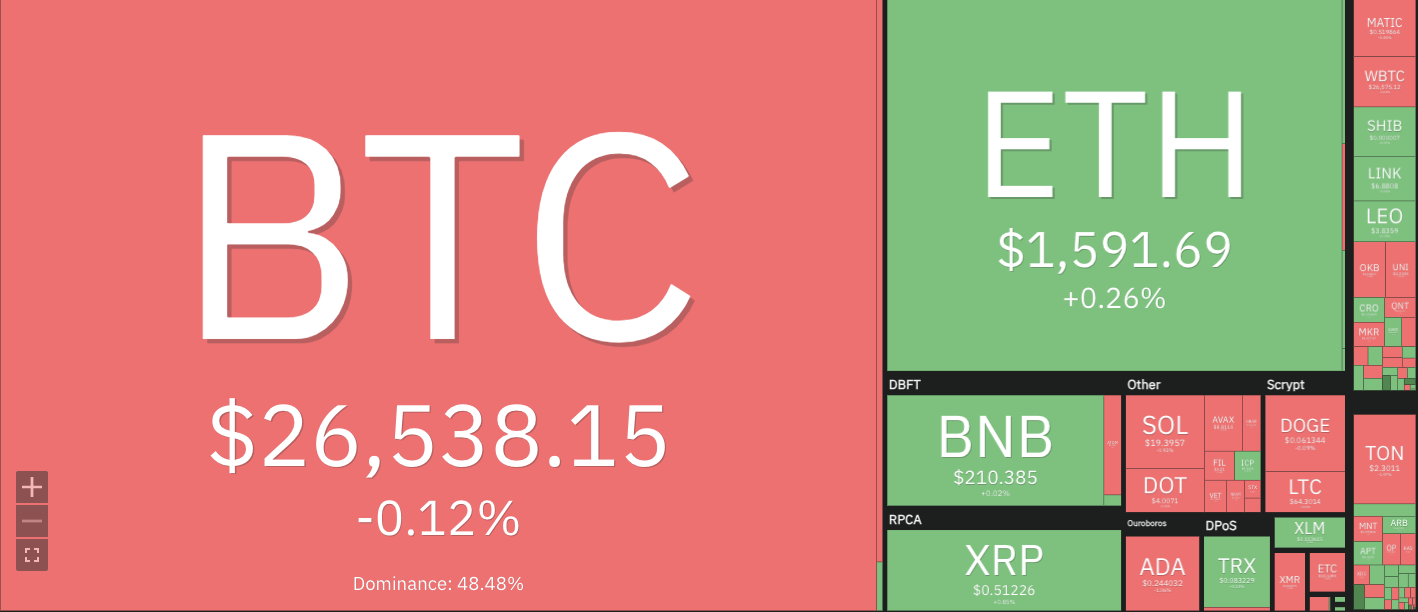
En una asamblea reciente celebrada el 20 de septiembre, la Reserva Federal optó por no elevar las tasas de interés. Sin embargo, podría vislumbrarse en el horizonte un período prolongado de tipos elevados. Jerome Powell, presidente de la Reserva Federal, subrayó en la rueda de prensa posterior que lograr una tasa de inflación constante del 2% sigue siendo un objetivo lejano.
Cryptocurrencies Price Heatmap, Source: Coin360
Mapa de calor de precios de criptomonedas, fuente: Coin360
Such indications potentially instigated the recent downtrend in the US stock market and extended to the digital currency domain. Elevated interest rates typically weigh on the performance of assets perceived as high risk.
Tales indicios potencialmente instigaron la reciente tendencia bajista en el mercado de valores de EE. UU. y se extendieron al dominio de las monedas digitales. Las tasas de interés elevadas suelen afectar el desempeño de los activos percibidos como de alto riesgo.
The week saw the S&P 500 index retract by over 2%, with the Nasdaq pulling back approximately 3%. In contrast, Bitcoin’s performance remained relatively unchanged. While alternative cryptocurrencies grappled to retain the week’s gains, primarily due to heightened risk aversion, there’s a silver lining. Bitcoin and its significant counterparts maintained positions above their vital support benchmarks. The impending price trajectory will be pivotal, and expected to spotlight a fierce tug-of-war between optimistic and cautious investors.
Durante la semana, el índice S&P 500 retrocedió más del 2%, y el Nasdaq retrocedió aproximadamente un 3%. Por el contrario, el rendimiento de Bitcoin se mantuvo relativamente sin cambios. Si bien las criptomonedas alternativas lucharon por retener las ganancias de la semana, principalmente debido a una mayor aversión al riesgo, hay un lado positivo. Bitcoin y sus homólogos importantes mantuvieron posiciones por encima de sus puntos de referencia de soporte vital. La inminente trayectoria de los precios será fundamental y se espera que ponga de relieve un feroz tira y afloja entre inversores optimistas y cautelosos.
Most of the cryptocurrencies in the past seven days have been trading in a sideways trend, with bulls and bears attempting to assert dominance. This has resulted in minor fluctuations in prices with no clear direction.
La mayoría de las criptomonedas en los últimos siete días se han negociado en una tendencia lateral, con alcistas y bajistas intentando afirmar su dominio. Esto ha dado lugar a pequeñas fluctuaciones en los precios sin una dirección clara.
BTC/USD
BTC/USD
Bitcoin price analysis shows that the dominant cryptocurrency has been trading in a tight range between $27,465 and $26,400 for most of the past week. This suggests that there is strong support at these levels, and any significant dips could be seen as buying opportunities by traders. BTC/USD is currently trading at $26,588, with a minimal decrease of 0.4% in the past 24 hours; however, in the past 7 days, it has recorded a modest 0.86% gain.
El análisis de precios de Bitcoin muestra que la criptomoneda dominante ha estado cotizando en un rango estrecho entre $27,465 y $26,400 durante la mayor parte de la semana pasada. Esto sugiere que existe un fuerte soporte en estos niveles, y los traders podrían considerar cualquier caída significativa como una oportunidad de compra. BTC/USD cotiza actualmente a $26,588, con una disminución mínima del 0,4% en las últimas 24 horas; sin embargo, en los últimos 7 días registró una modesta ganancia del 0,86%.
The support level for BTC/USD is seen at $26,400, while the resistance level remains at $27,465. If the price breaks above this resistance level, a retest of the key psychological level of $28,000 could be on the cards. However, if the support level is breached, we could see a dip towards the $26,000 region.
El nivel de soporte para BTC/USD se sitúa en 26.400 dólares, mientras que el nivel de resistencia se mantiene en 27.465 dólares. Si el precio supera este nivel de resistencia, podría estar en juego una nueva prueba del nivel psicológico clave de $ 28,000. Sin embargo, si se supera el nivel de soporte, podríamos ver una caída hacia la región de 26.000 dólares.
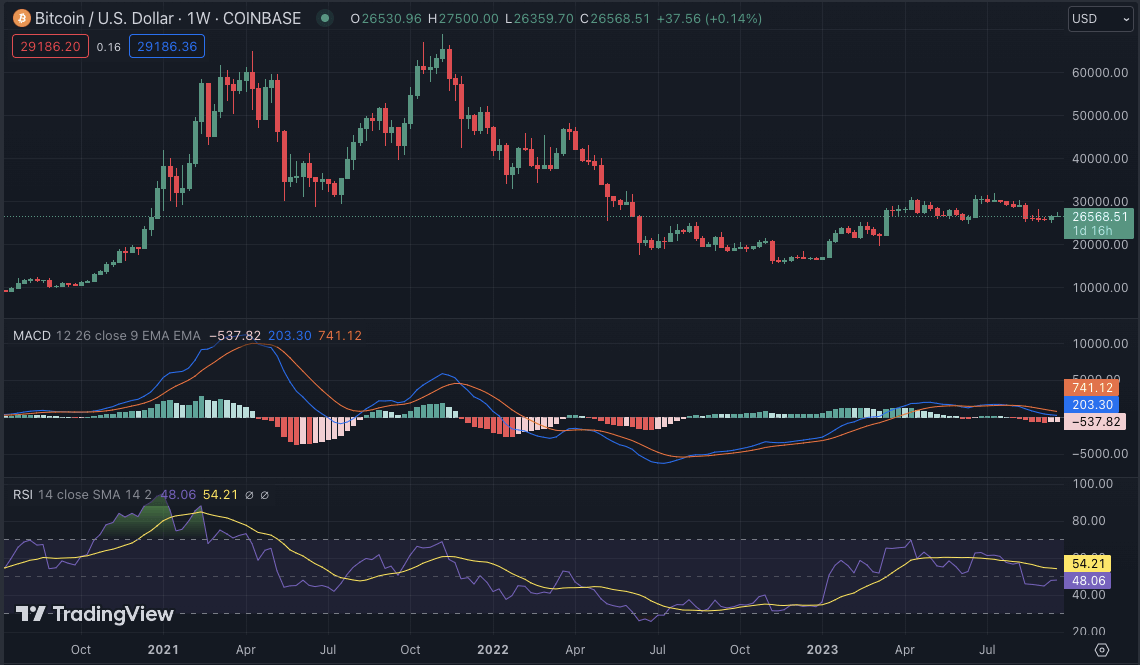
The technical indicators in the past few days have been in neutral territory, suggesting that the market is in a state of indecision. The MACD indicator is hovering around the zero line, while the RSI has been ranging between 40 and 50. The 50-EMA is currently acting as a support level, indicating that the bulls may have the upper hand in the short term.
Los indicadores técnicos de los últimos días se han situado en territorio neutral, lo que sugiere que el mercado se encuentra en un estado de indecisión. El indicador MACD ronda la línea cero, mientras que el RSI ha oscilado entre 40 y 50. La EMA 50 actúa actualmente como nivel de soporte, lo que indica que los alcistas pueden tener ventaja en el corto plazo.
ETH/USD
ETH/USD
Ethereum price analysis shows that the second-largest cryptocurrency has successfully broken below the key support level of $1,600. The bears have been successful in pushing the price towards a low of $1,570. However, ETH/USD has managed to bounce back and is currently trading at $1,594, with an increase of 0.36% in the past 24 hours. In the past week, ETH/USD has recorded a minor loss of 1.73%. The bulls and bears are currently in a tug-of-war at this level and the outcome of this battle could determine the short-term price trajectory.
El análisis de precios de Ethereum muestra que la segunda criptomoneda más grande ha superado con éxito el nivel de soporte clave de 1.600 dólares. Los bajistas han logrado empujar el precio hacia un mínimo de $ 1,570. Sin embargo, el ETH/USD ha logrado recuperarse y actualmente cotiza a 1.594 dólares, con un aumento del 0,36% en las últimas 24 horas. La semana pasada, ETH/USD registró una pérdida menor del 1,73%. Los alcistas y bajistas se encuentran actualmente en un tira y afloja en este nivel y el resultado de esta batalla podría determinar la trayectoria del precio a corto plazo.
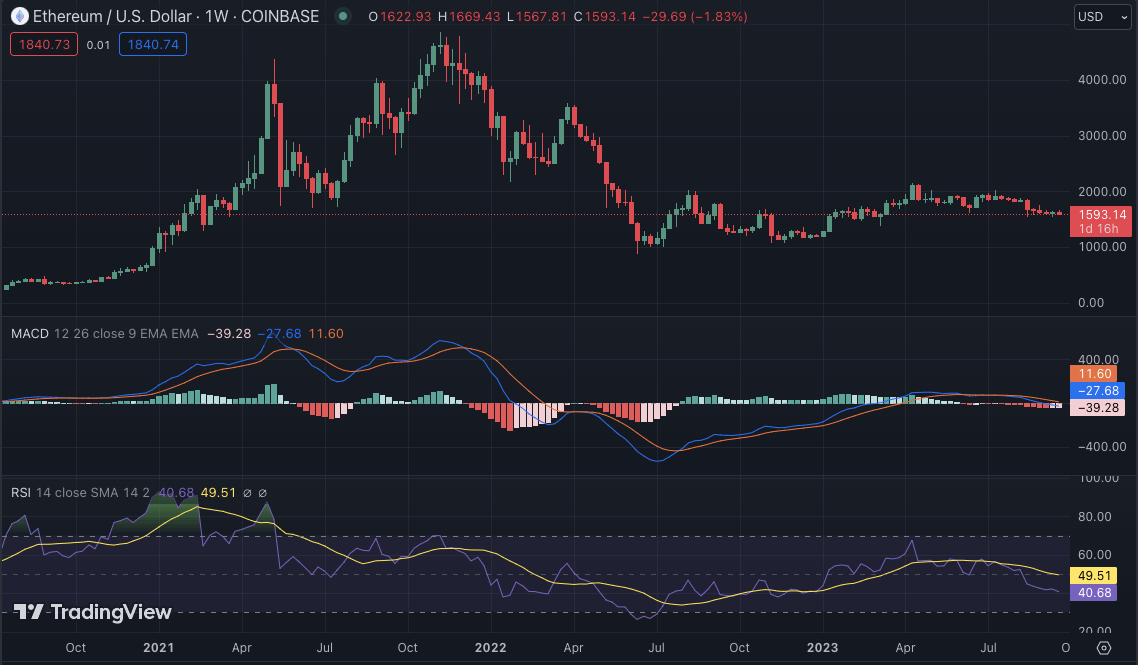
The support level for ETH/USD is seen at $1,570, while the resistance level remains at $1,620. If the bulls manage to break above this resistance level, ETH/USD could see a retest of the $1,650 level. However, if the bears take control and break below the support level, we could see a dip towards the next key support level at $1,500.
El nivel de soporte para ETH/USD se sitúa en 1.570$, mientras que el nivel de resistencia se mantiene en 1.620$. Si los alcistas logran superar este nivel de resistencia, el ETH/USD podría volver a probar el nivel de $1,650. Sin embargo, si los bajistas toman el control y rompen por debajo del nivel de soporte, podríamos ver una caída hacia el siguiente nivel de soporte clave en $1,500.
The technical indicators for ETH/USD also indicate indecision in the market. The 20-SMA and 50-EMA are both trending below the price, suggesting bearish pressure. However, the RSI is hovering around 40, indicating a balance between buying and selling pressure. The MACD indicator shows signs of a neutral crossover, which could indicate a potential reversal in the short term.
Los indicadores técnicos para ETH/USD también indican indecisión en el mercado. Tanto la 20-SMA como la 50-EMA tienen una tendencia por debajo del precio, lo que sugiere una presión bajista. Sin embargo, el RSI ronda los 40, lo que indica un equilibrio entre la presión de compra y venta. El indicador MACD muestra signos de un cruce neutral, lo que podría indicar una posible reversión en el corto plazo.
BNB/USD
BNB/USD
Binance Coin (BNB) price analysis shows that the fourth-largest cryptocurrency has been trading in a tight range between $221 and $208 for most of the past week. This suggests that there is strong support at these levels, and any significant dips could be seen as buying opportunities by traders. BNB/USD is currently trading at $210, with a decrease of 0.09% in the past 24 hours. In the past week, BNB/USD has recorded a modest loss of 1.04%.
El análisis de precios de Binance Coin (BNB) muestra que la cuarta criptomoneda más grande ha estado cotizando en un rango estrecho entre $221 y $208 durante la mayor parte de la semana pasada. Esto sugiere que existe un fuerte soporte en estos niveles, y los traders podrían considerar cualquier caída significativa como una oportunidad de compra. BNB/USD cotiza actualmente a 210 dólares, con una disminución del 0,09% en las últimas 24 horas. La semana pasada, BNB/USD registró una modesta pérdida del 1,04%.
On 18th September, BNB touched a weekly high of $221.6 but failed to sustain the bullish momentum, falling back towards the $210 level. The support level for BNB/USD is seen at $200, while the resistance level remains at $221. If the bulls manage to break above this resistance level, a retest of the key psychological level of $230 could be on the cards. However, if the bears take control and break below the support level, the next key support at $200.
El 18 de septiembre, BNB alcanzó un máximo semanal de 221,6 dólares, pero no logró mantener el impulso alcista y volvió a caer hacia el nivel de 210 dólares. El nivel de soporte para BNB/USD se considera de 200 dólares, mientras que el nivel de resistencia se mantiene en 221 dólares. Si los alcistas logran superar este nivel de resistencia, podría estar en juego una nueva prueba del nivel psicológico clave de 230 dólares. Sin embargo, si los bajistas toman el control y rompen por debajo del nivel de soporte, el siguiente soporte clave está en $200.
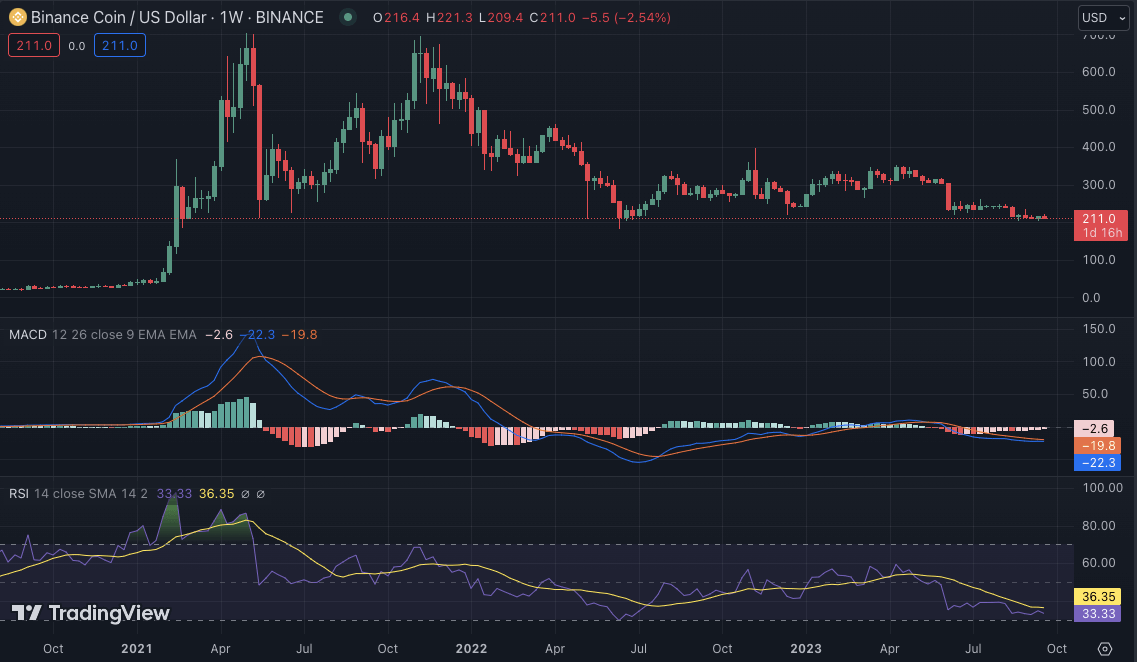
The technical indicators for BNB/USD also suggest neutral sentiment in the market. The 20-SMA is slightly above the price and acting as a resistance level, while the 50-EMA is trending below, indicating bearish pressure. The MACD indicator is hovering around the zero line, and the RSI is showing the balance between buying and selling pressure.
Los indicadores técnicos para BNB/USD también sugieren un sentimiento neutral en el mercado. El 20-SMA está ligeramente por encima del precio y actúa como un nivel de resistencia, mientras que el 50-EMA tiene una tendencia a la baja, lo que indica una presión bajista. El indicador MACD ronda la línea cero y el RSI muestra el equilibrio entre la presión de compra y venta.
XRP/USD
XRP/USD
XRP has been trading below the $0.52 level for most of this week, with bears and bulls locked in a battle. The weekly high was seen at $0.5235 on 21st September and touched a low of $0.4896 on 18th September. The bulls have been gaining the upper hand in the past 24 hours, with XRP/USD currently trading at $0.515, recording a modest increase of 1.28% and a 7-day loss of 3.67%.
XRP ha estado cotizando por debajo del nivel de $ 0,52 durante la mayor parte de esta semana, con bajistas y alcistas enfrascados en una batalla. El máximo semanal se registró en 0,5235 dólares el 21 de septiembre y tocó un mínimo de 0,4896 dólares el 18 de septiembre. Los alcistas han ido ganando terreno en las últimas 24 horas, con el XRP/USD cotizando actualmente a 0,515$, registrando un modesto aumento del 1,28% y una pérdida de 7 días del 3,67%.
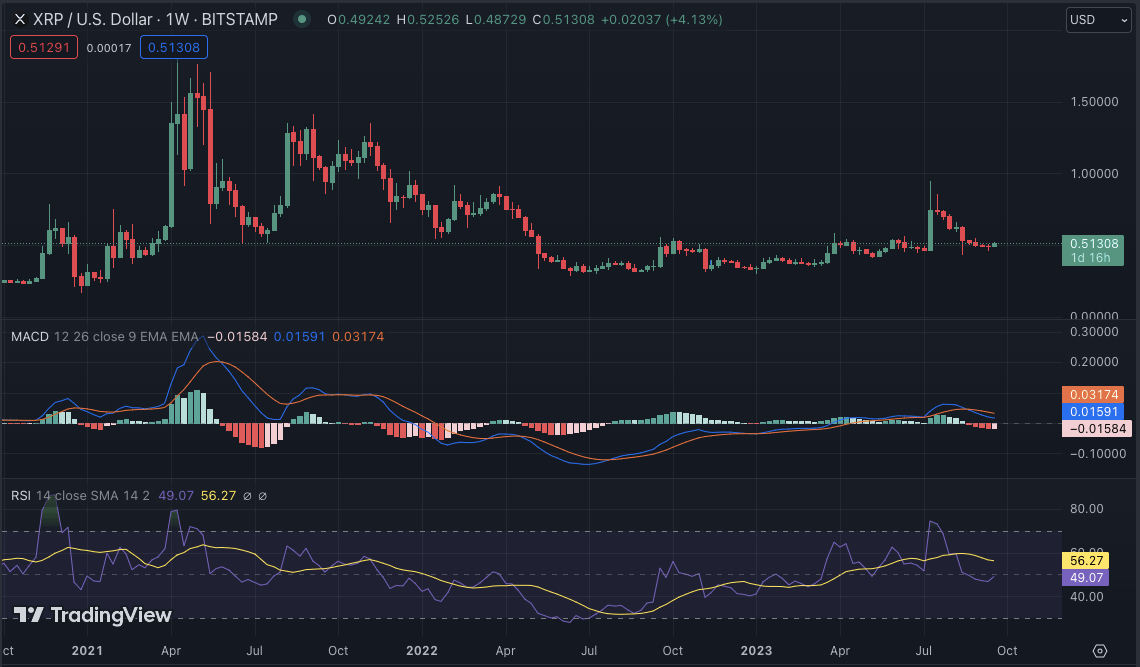
The moving averages for XRP/USD indicate a bullish trend, with the 20-EMA trending above the 50-SMA. The MACD indicator has also turned bullish, indicating a potential crossover in the short term. The RSI is hovering above the 40.00 level, showing buying momentum. The support level for XRP/USD is seen at $0.48, while the resistance level remains at $0.52.
Los promedios móviles para XRP/USD indican una tendencia alcista, con la EMA 20 por encima de la SMA 50. El indicador MACD también se ha vuelto alcista, lo que indica un posible cruce en el corto plazo. El RSI se sitúa por encima del nivel 40,00, lo que muestra un impulso de compra. El nivel de soporte para XRP/USD se sitúa en 0,48$, mientras que el nivel de resistencia se mantiene en 0,52$.
DOGE/USD
DOGE/USD
Dogecoin price analysis shows that the meme-inspired cryptocurrency has maintained its position above the key support level of $0.0600 this week, with minor fluctuations in prices. DOGE/USD is currently trading at $0.06145, recording a loss of 0.04% in the past 24 hours and a 7-day loss of 0.92%. The bears have been in control in the past few days, and if momentum continues, DOGE/USD could see a dip towards the support at $0.05800.
El análisis de precios de Dogecoin muestra que la criptomoneda inspirada en memes ha mantenido su posición por encima del nivel de soporte clave de $0,0600 esta semana, con pequeñas fluctuaciones en los precios. DOGE/USD cotiza actualmente a $0,06145, registrando una pérdida del 0,04% en las últimas 24 horas y una pérdida del 0,92% en 7 días. Los bajistas han tenido el control en los últimos días y, si el impulso continúa, DOGE/USD podría ver una caída hacia el soporte de $0,05800.
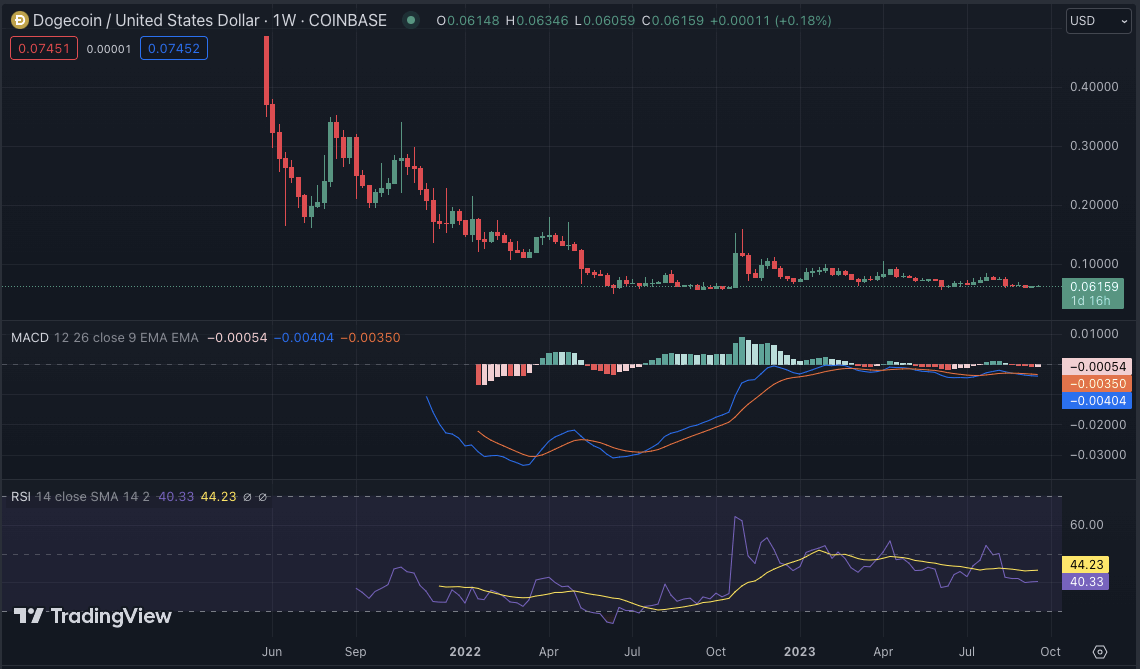
The technical indicators for DOGE/USD show that the 20-SMA is acting as a resistance level, with the 50-EMA trending below, indicating bearish pressure. The MACD indicator has also turned bearish, suggesting a potential crossover in the short term. The RSI is hovering around the 40.00 level, indicating a balance between buying and selling pressure.
Los indicadores técnicos para DOGE/USD muestran que la 20-SMA está actuando como un nivel de resistencia, con la 50-EMA con tendencia a la baja, lo que indica una presión bajista. El indicador MACD también se ha vuelto bajista, lo que sugiere un posible cruce en el corto plazo. El RSI ronda el nivel 40,00, lo que indica un equilibrio entre la presión de compra y venta.
LTC/USD
LTC/USD
Litecoin price analysis shows that LTC has been trading in a tight range between $63.30 and $68.00 for the past week. The sideways movement suggests indecision in the market, with neither bulls nor bears taking control. The bulls and bears have been in a tug-of-war near the key support level of $65.00, with LTC/USD currently trading at $66.33, recording an increase of 0.33% in the past 24 hours and a 7-day loss of 0.95%.
El análisis de precios de Litecoin muestra que LTC ha estado cotizando en un rango estrecho entre $63,30 y $68,00 durante la semana pasada. El movimiento lateral sugiere indecisión en el mercado, sin que ni los alcistas ni los bajistas tomen el control. Los alcistas y bajistas han estado en un tira y afloja cerca del nivel de soporte clave de $65,00, con el LTC/USD cotizando actualmente a $66,33, registrando un aumento del 0,33% en las últimas 24 horas y una pérdida de 7 días del 0,95%. .
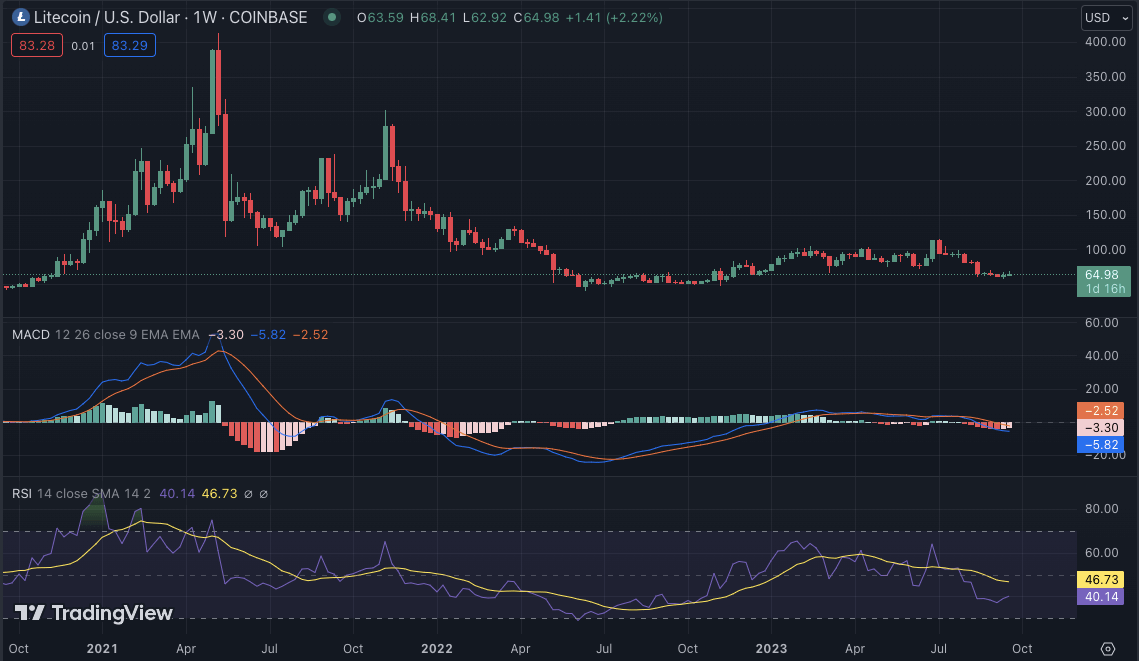
The technical indicators for LTC/USD are currently in neutral territory, with the moving averages closely tracking the price and the MACD indicator hovering around the zero line. The RSI is also ranging between 40 and 50, indicating indecision in the market. The 20-EMA is currently below the price and acting as a support level, while the 50-SMA is above, suggesting potential resistance.
Los indicadores técnicos para LTC/USD se encuentran actualmente en territorio neutral, con los promedios móviles siguiendo de cerca el precio y el indicador MACD rondando la línea cero. El RSI también oscila entre 40 y 50, lo que indica indecisión en el mercado. El 20-EMA se encuentra actualmente por debajo del precio y actúa como nivel de soporte, mientras que el 50-SMA está por encima, lo que sugiere una posible resistencia.
Weekly Crypto Analysis Conclusion
Conclusión del análisis criptográfico semanal
Overall, the crypto market is in a period of consolidation, with most coins trading within range-bound conditions. The bullish and bearish divergences being seen on many coins indicate that there is a tug-of-war occurring between the bulls and bears. In the near term, it is likely that some coins will break out of their current levels and begin to rally higher, while others might drop lower.
En general, el mercado de las criptomonedas se encuentra en un período de consolidación, y la mayoría de las monedas se comercializan dentro de condiciones limitadas. Las divergencias alcistas y bajistas que se observan en muchas monedas indican que se está produciendo un tira y afloja entre los alcistas y los bajistas. En el corto plazo, es probable que algunas monedas salgan de sus niveles actuales y comiencen a subir, mientras que otras podrían caer más.
 BlockchainReporter
 Cryptopolitan_News
 DeFi Planet
 TheCoinrise Media
 DogeHome
 CoinoMedia
 COINTURK NEWS
 Cryptopolitan_News
 Optimisus


