Technical analysis is an essential tool for investors in the cryptocurrency market, especially those who trade in the futures market. So, what does technical analysis tell us about Dogecoin, which is currently trading at $0.07606? Let’s delve into a detailed chart analysis, examining important support and resistance levels.
El análisis técnico es una herramienta esencial para los inversores en el mercado de las criptomonedas, especialmente aquellos que operan en el mercado de futuros. Entonces, ¿qué nos dice el análisis técnico sobre Dogecoin, que actualmente cotiza a 0,07606 dólares? Profundicemos en un análisis gráfico detallado, examinando importantes niveles de soporte y resistencia.
Dogecoin Daily Chart Analysis
Análisis del gráfico diario de Dogecoin
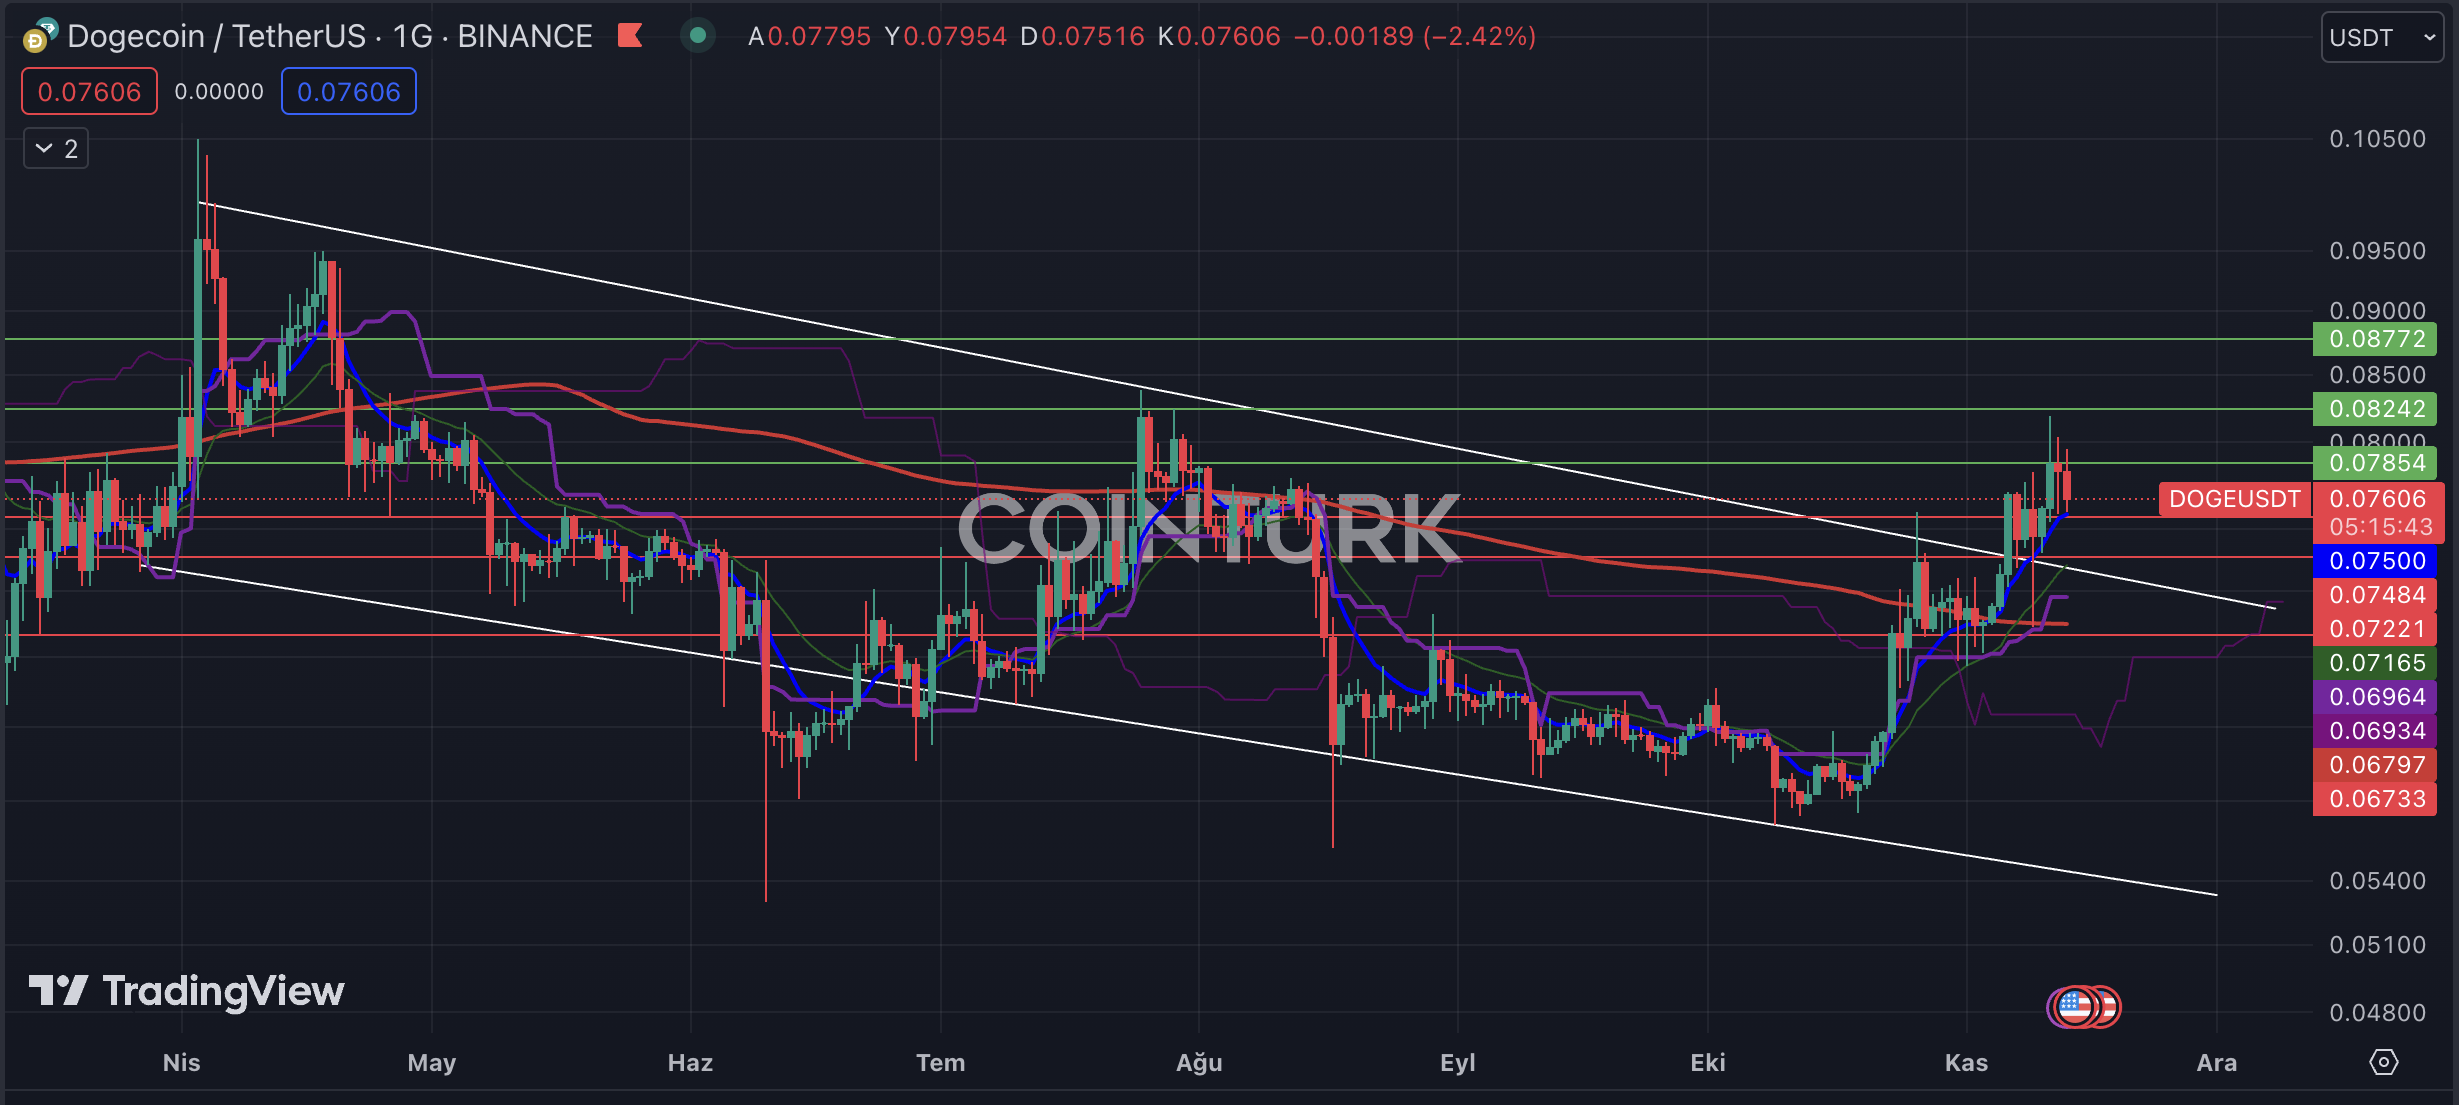
The first notable formation on the daily chart of Dogecoin is a descending channel pattern. This structure was surpassed when the resistance line was broken during the recent uptrend. Despite the dominance of selling pressure today, this formation may lead to a positive trend in the future.
La primera formación notable en el gráfico diario de Dogecoin es un patrón de canal descendente. Esta estructura fue superada cuando se rompió la línea de resistencia durante la reciente tendencia alcista. A pesar del predominio actual de la presión vendedora, esta formación puede conducir a una tendencia positiva en el futuro.
The crucial support levels to watch for DOGE on the daily chart are $0.07484, $0.07221, and $0.06733. If the daily closing price falls below the $0.06733 level, it could lead to a return to the formation zone and a price below the EMA 200 (red line), resulting in a significant loss of momentum for DOGE.
Los niveles de soporte cruciales a tener en cuenta para DOGE en el gráfico diario son USD 0,07484, USD 0,07221 y USD 0,06733. Si el precio de cierre diario cae por debajo del nivel de $ 0,06733, podría provocar un regreso a la zona de formación y un precio por debajo de la EMA 200 (línea roja), lo que resultaría en una pérdida significativa de impulso para DOGE.
On the other hand, the important resistance levels to monitor for DOGE on the daily chart are $0.07854, $0.08242, and $0.08772. If the daily closing price exceeds the $0.08242 level, it could trigger an upward trend for DOGE.
Por otro lado, los niveles de resistencia importantes a monitorear para DOGE en el gráfico diario son $ 0.07854, $ 0.08242 y $ 0.08772. Si el precio de cierre diario supera el nivel de $ 0,08242, podría desencadenar una tendencia alcista para DOGE.

Dogecoin Two-Hour Chart Analysis
Análisis del gráfico de dos horas de Dogecoin
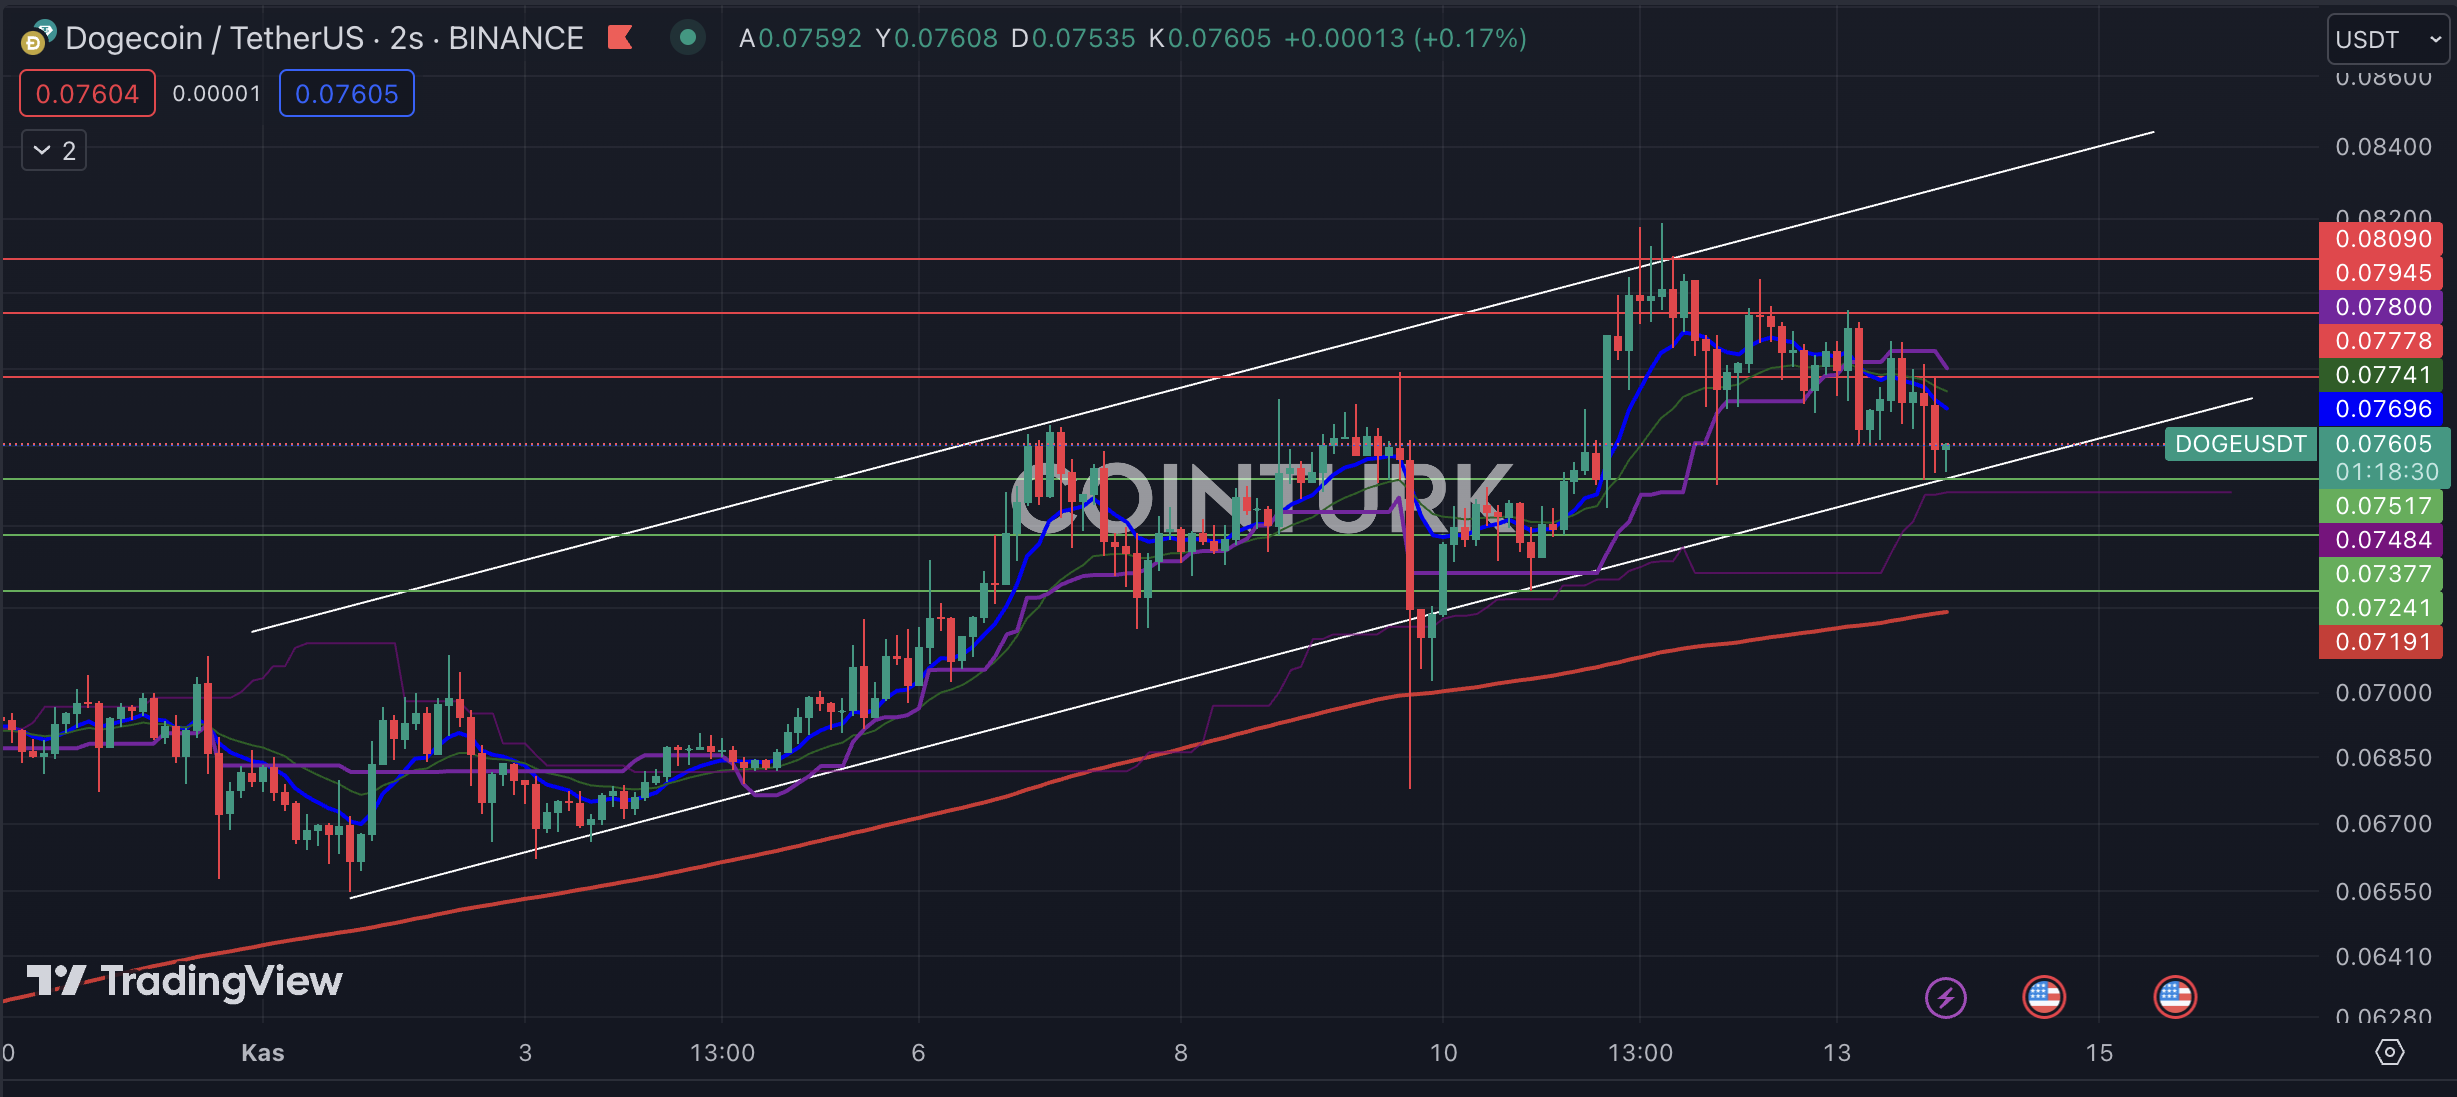
The first formation that stands out on the two-hour chart for DOGE is an ascending channel pattern. The breakdown of support on November 10th and three consecutive bar closures below this formation indicate a bear trap for investors. However, the presence of DOGE above the support line in recent bar closures suggests a significant waiting period.
La primera formación que se destaca en el gráfico de dos horas de DOGE es un patrón de canal ascendente. La ruptura del soporte el 10 de noviembre y tres cierres consecutivos de barras por debajo de esta formación indican una trampa bajista para los inversores. Sin embargo, la presencia de DOGE por encima de la línea de soporte en los recientes cierres de barras sugiere un período de espera significativo.
The crucial support levels to watch for DOGE on the two-hour chart are $0.07517, $0.07377, and $0.07241. If the bar closes below the $0.07517 level, it will disrupt the formation structure.
Los niveles de soporte cruciales a tener en cuenta para DOGE en el gráfico de dos horas son USD 0,07517, USD 0,07377 y USD 0,07241. Si la barra cierra por debajo del nivel de $0,07517, alterará la estructura de formación.
Regarding resistance levels, the important levels to observe for DOGE on the two-hour chart are $0.07778, $0.07945, and $0.08090. A bar closure above the major obstacle of $0.08090 will ignite a new upward trend for DOGE.
En cuanto a los niveles de resistencia, los niveles importantes a observar para DOGE en el gráfico de dos horas son USD 0,07778, USD 0,07945 y USD 0,08090. Un cierre de barra por encima del obstáculo principal de USD 0,08090 iniciará una nueva tendencia alcista para DOGE.

Continuar leyendo: https://en.coin-turk.com/analysis-of-dogecoin-charts-diving-into-technical-indicators/


 DogeHome
 Crypto Intelligence
 DogeHome
 CFN
CFN The Bit Journal
 Crypto Intelligence
 DeFi Planet
 Crypto News Land
 BH NEWS


